Solar PhotoVoltaics (SPV) are among the fastest growing energy resources in the world. Most of the SPV had been installed in the distribution systems as distributed generation. Now, a day’s Distributed generations (DGs) play an important role in distribution networks. Among many of their merits, loss reduction and voltage profile improvement can be the salient specifications of DG. Studies show that non-optimal locations of DG units may lead to losses increase, together with bad effect on voltage profile. So, this paper presents a new methodology using Particle Swarm Optimization(PSO) for the placement of Solar PV in the radial distribution systems. The proposed algorithm will identify the optimal location of Solar PV with minimum active power losses.. The developed algorithm has been tested on modified IEEE 14-bus test. The result shows a considerable reduction in the total power loss in the system and improved voltage profiles of the buses.
Keywords |
| Distributed Generators (DG); Fuel Cell ;Solar Photo Voltaics (SPV); Particle Swarm Optimisation(PSO); |
I. INTRODUCTION |
| Distributed generation is any electricity generating technology installed by a customer or independent electricity
producer that is connected at the distribution system level of the electric grid [1]. It can be said that DO is associated
with the use of small generation units located close to or in the load centers. The effects of DO on voltage profile, line
losses, short circuit current and system reliability are to be evaluated separately before installing it in a distribution
network. DG technologies can be categorized into renewable and non-renewable energy resources.
The DG technologies that based on renewable are solar, wind, small-hydro, biomass, geothermal
etc. whereas the DG technologies that based on non-renewable are combustion turbines, steam
turbines, micro turbines, reciprocating engines etc. Fuel cells can be categorized into
renewable (using hydrogen) and non-renewable (using natural gas or petrol) [2] [3]. |
| The benefits of DG are numerous [4, 5] and the reasons for implementing DGs are an energy efficiency or rational
use of energy, deregulation or competition policy, diversification of energy sources, availability of modular generating
plant, ease of finding sites for smaller generators, shorter construction times and lower capital costs of smaller plants
and proximity of the generation plant to heavy loads, which reduces transmission costs. Also it is accepted by many
countries that the reduction in gaseous emissions (mainly CO2) offered by DGs is major legal driver for DG
implementation [6]. |
| Photovoltaics(PV) is a method of generating electrical power by converting solar radiation into direct current
electricity using semiconductors that exhibit the photovoltaic effect. Solar photovoltaics is now, after hydro and wind
turbine, the third most important renewable energy source in terms of globally installed capacity. Integrating PV in
the distribution system has positive impacts. Some of them are, Solar energy is supplied by nature thus
it is abundant, it can be made available almost anywhere there is sunlight, ease of operation and negligible operating
cost, pollution free, they are totally silent, producing no noise at all, and have no mechanically moving parts [7]. |
| Optimal placement and sizing of PVS units in distribution systems is a complex combinatorial optimization problem
[8]. Recently, metaheuristics optimization methods are being successfully applied to combinatorial optimization
problems in power systems particularly in DG allocation and sizing. In [8]-[12], the DG placement problem was
presented using genetic algorithm (GA) technique. The placement problem presented in [8] is evaluated based on the
relation of benefit obtained by the installation of DG and the investment and operational cost incurred in their
installation. The authors in [9] presented the steps of DG allocation in two separate ways, i.e. not continuous, the
optimal location is determined first, and then the optimal size of the DG is solve second. The work presented in [13] discussed the combination of genetic algorithm (GA) and simulated annealing (SA) while evolutionary programming
optimization technique was used in [14] to solve the DG allocation problem. In [15] tabu search algorithm is presented.
As in [8], the authors in [14]-[15] discussed the placement of DG in two separate ways, the optimal location is
determined first, and then the optimal sizing of the DG is second. One of the metaheuristics optimization recently
developed was Particle Swarm Optimization (PSO). Comparing to another algorithms, Particle Swarm
Optimization [16] has the flexibility to control the balance in the search space and PSO
overcomes the premature convergence problem and enhances the search capability. Here the
solution quality doesn’t rely on the initial population. |
| In this paper, an algorithm is developed to find the optimal location of Solar PV in the distribution system. The
problem is formulated as a single objective function of minimizing the system active power losses considering the
constraints on active power generation and voltage limits. This optimization problem is solved using Particle Swarm
Optimization (PSO) algorithm. At each step, Solar PV is placed at a bus and the power flow analysis is carried out by
Newton-Raphson method to evaluate the variation in power losses of the system considering the constraints. |
| This paper is organized as follows: Proposed methodology and modelling of the power system and Solar PV are
described in section II. Problem formulation for the optimal placement of Fuel Cell DG and Solar PV and the PSO
algorithm are presented in section III. The results and discussions are described in section IV. Finally a brief conclusion
is deduced in section V. |
II. PROPOSED METHODOLOGY & MODELING |
| The proposed methodology consisted of finding the best suitable bus for connecting the Solar PV as shown in Figure
1. The development of the algorithm required problem formulation with modeling of Solar PV and the dynamic model of
IEEE 14-bus system. |
| A. Modeling of Power System Components |
| IEEE 14-bus system with Solar PV has been modeled in this paper for the analysis. The dynamic model of IEEE 14-
bus system has been analyzed and the power flow results are verified with the standard values. The Solar PV model has
been explained in the next section. |
| B. Modeling of Solar PV |
| PV is the most versatile, simplest to install and cheapest to maintain, and provides a highly valued product –
electricity- generally at or close to the point of use, avoiding the cost and risk of failure of infrastructure[19].A storage
system is in general absent in large grid-connected SPVG installations, except for small critical loads of the plant such as
start-up controls. However, there are some instances in which considerable storage has been integrated into large scale
SPVGs [18]. |
| In the current paper, the following models are considered
for the SPVG : |
| • Model 1: Constant P and constant Q control. |
| • Model 2: Constant P and constant V control. |
III. PROBLEM FORMULATION |
| A. Objective Function & ConstraintsA general constrained single-objective optimization problem considering active power loss of all the transmission lines
in the system has been formulated to find the optimal location of the Solar PV. Accordingly, the objective function has
been formulated for any time (t) as: |
| Minimize, |
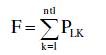 (1) (1) |
| Subjected to the following equality constraints |
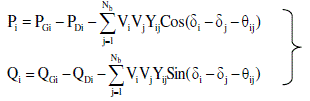 (2) (2) |
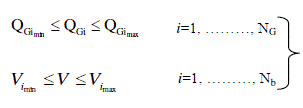
| And the following inequality constraints |
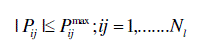
 (3) (3) |
 (4) (4) |
| Where |
| F is the objective function. |
| PLK is the active power loss in the Kth line. |
| ntl is the number of lines in the system |
| Nb is the set of buses indices |
| NG is the set of generation bus indices |
| Yij and θij are the magnitude and phase angle of element in admittance matrix |
| Pgi and Qgi are the active and reactive power generation at bus i |
| Pdi and Qdi are the active and reactive power load at bus i |
| Vi is the voltage magnitude at bus i. |
| B. Particle Swarm Optimization (PSO) |
| PSO is a robust stochastic optimization technique based on the movement and intelligence of swarms. PSO applies
the concept of social interaction to problem solving. It was developed in 1995 by James Kennedy (social-psychologist)
and Russell Eberhart (electrical engineer). It uses a number of agents (particles) that constitute a swarm moving around
in the search space looking for the best solution. Each particle treated as a point in a N-dimensional space which
adjusts its “flying” according to its own flying experience as well as the flying experience of other particles. Each
particle keeps track of its coordinates in the solution space which are associated with the best solution (fitness) that has
achieved so far by that particle. This value is called personal best, Pbest . Another best value that is tracked by the PSO
is the best value obtained so far by any particle in the neighbourhood of that particle. This value is called Gbest. The
basic concept of PSO lies in accelerating each particle toward its Pbest and the Gbest locations, with a random weighted
acceleration at each time step. |
| Each particle tries to modify its position using the following information: the current positions, the current velocities,
the distance between the current position and Pbest, the distance between the current position and the Gbest. The
modification of the particle’s position can be mathematically modeled according the following equation: |
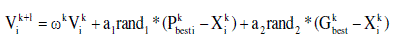 (5) (5) |
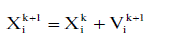 (6) (6) |
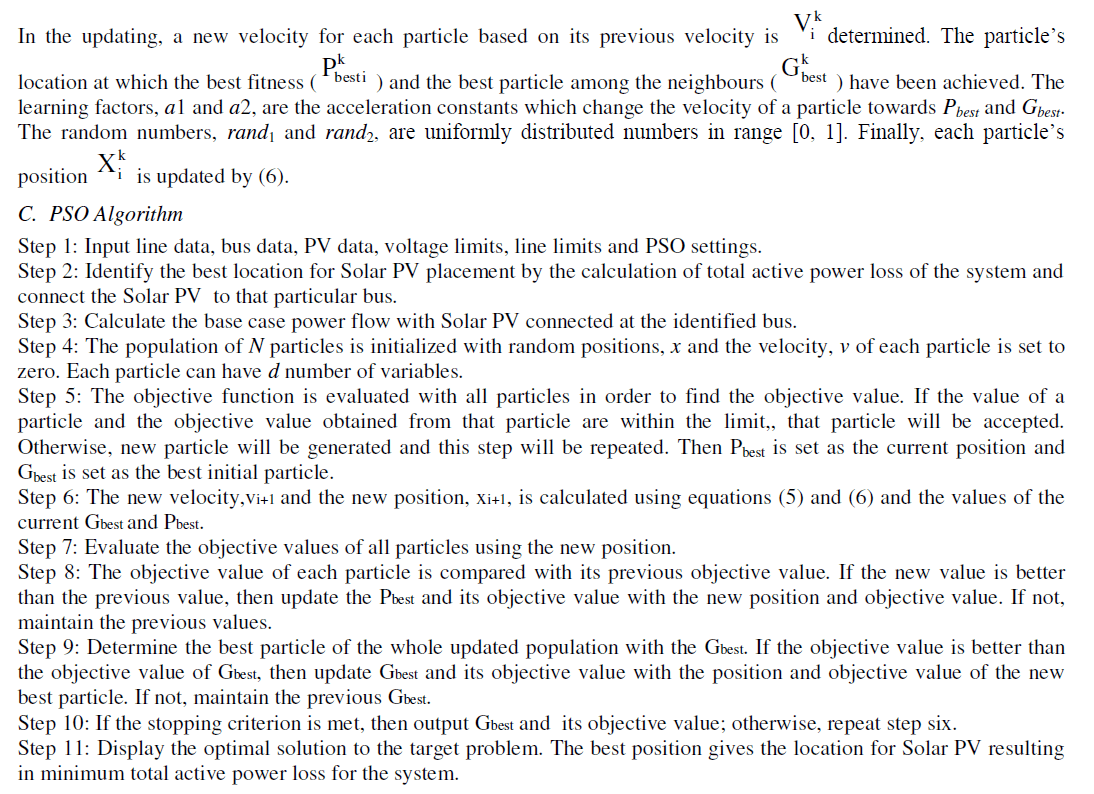 |
IV. RESULT & DISCUSSION |
| A. Specification of Test system |
| The proposed solution method was tested on an IEEE 14 bus test system, shown in Figure.5. The network consists of 6
generators, of which one is slack and there are 20 lines. The results consist of two steps. The first step is to access the
best location of Solar PV and the second is the calculation of minimum active power loss. The proposed methodology
has been tested on IEEE14-bus system as shown in figure 4. Bus-2, 13 are PV buses and 3, 6 and 8 are synchronous
compensator buses. |
| Solar PV have been connected to any of the bus (other than slack bus and buses connected to transformers),
voltage and angle settings of slack bus and Solar PV ratings are considered for minimising the active power loss. Loads
were modeled as constant power loads (PQ load) and were solved by using Newton Raphson Power flow Routine. The
program was coded in MATLAB |
| The base case without Solar PV bus voltage level is compared against the base case with Solar PV voltage limit in
Figure 6. The figure shows that optimal placement of Solar PV adjusted the voltages of PV buses and slack bus for
minimising the losses. The figure clearly states that all the bus voltages are within the set limits at minimum active
power loss with Solar PV at optimum location. |
| Figure 7 shows the bus generations at minimum active power loss using SPV at optimum location. |
| Figure 8 shows the bus reactive power generations at minimum active power loss using SPV at optimum location. |
| The active power flows in various lines are given in Figure 9. Except for line 7 and 13, the power carried through all
other transmission lines is reduced which in turn reduces the losses. |
| From this table, it is clear that the total active power loss of the system is reduced by the optimal allocation of Solar
PV. |
V. CONCLUSION |
| The new methodology proposed to optimally place the Solar PV so as to minimize the active power loss of the
system using PSO has discussed in this paper.Particle Swarm Optimization algorithm, is easy to implement and the
time taken for the iteration is less compared to other conventional methods and it is accurate .The results shows that the
optimal allocation of Solar PV will minimize the real power loss and it is tested on IEEE 14 bus system. |
ACKNOWLEDGMENT |
| The authors gratefully acknowledge Dr Federico Milano, for his excellent simulation software PSAT. |
Tables at a glance |
 |
| Table 1 |
|
| |
Figures at a glance |
 |
 |
 |
 |
 |
| Figure 1 |
Figure 2 |
Figure 3 |
Figure 4 |
Figure 5 |
 |
 |
 |
 |
| Figure 6 |
Figure 7 |
Figure 8 |
Figure 9 |
|
| |
References |
- Thomas Ackermann, GoranAndersson, LenartSoder, "Distributed generation: a definition," Electric Power Systems Research, Volume 57, Issue 3, Pages 195-204,20 April 2001.
- G. Pepermans, J. Driesen, D. Haeseldonckx, R. Belmans, and W. D'Haeseleer, "Distributed generation: definition, benefits and issues", Energy Policy, vol. 33, pp. 787-798, 2005.
- A. A. B. Rujula, J. M. Amada, J. L. Bernal-Agustin, J. M. Y. Loyo, Navarro, "Definitions for Distributed Generation: A Revision",International Conference on Renewable Energy and Power Quality, March 16-18 2005.
- P.A. Daly, J. Morrison, “Understanding the potential benefits of distributed generation on power delivery systems,”Rural Electri Power Conference, 29 April –1 May 2001, pp. A211 –A213.
- P. Chiradeja, R. Ramakumar, “An approach to quantify the technical benefits of distributed generation”IEEE Trans Energy Conversion, vol. 19, no. 4, pp. 764-773, 2004.
- “Kyoto Protocol to the United Nations Framework Convention on climate change” , http://unfccc.int/resource/docs/convkp/kpeng.html
- Gudimetla.B, Katriraei.FAquero.J.R and Enslin.J.H.R, “Integration of Micro-Scale Photovoltaic Distributed Generation on Power Distribution Systems: Dynamic Analysis”,IEEE Transmission and Distribution Conference and Exposition,7 may 2012.
- Carmen L.T. Borges, Djalma M. Falcão, “Optimal distributed generation allocation for reliability, losses, and voltage improvement”, International Journal of Electrical Power & Energy Systems, Volume 28, Issue 6, July 2006, Pages 413-420.
- B Kuri, M A Redfern and F Li, “Optimisation of Rating and Positioning of Dispersed Generation with Minimum Network Disruption”, Power Engineering Society General Meeting, Denver, Colorado, USA, June 6-10, 2004
- Amed R. Abdelaziz and Walid M. Ali, “Dispersed Generation Planning Using A New Evolutionary Approach”, Proceedings of Power Tech Conference, Bologna, Italy, 23-26 June, 2003.
- Jen-HaoTeng, Tain-SyhLuor and Yi-Hwa Liu, “Strategic Distributed Generator Placement for Service Reliability Improvements”, Power Engineering Society Summer Meeting, Chicago, IL, USA, 25 July, 2002.
- G. Celli and F. Pilo, “Optimal Distributed Generation Allocation in MV Distribution Networks”, Power Engineering Society International Conference on Power Industry Computer Applications, Sydney, NSW, Australia, 20-24 May, 2001.
- M. Gandomkar, M. Vakilian and M. Ehsan, “A Combination of Genetic Algorithm and Simulated Annealing for Optimal DG Allocation in Distribution Networks”, Proceedings of Canadian Conference on Electrical and Computer Engineering, Saskatchewan, Canada, 1-4 May, 2005.
- T. K. A. Rahman, S. R. A. Rahim and I. Musirin, “Optimal Allocation and Sizing of Embedded Generators”, Proceedings of National Power and Energy Conference, 29-30 November, 2004.
- Koichi Nara, Yasuhiro Hayashi, Kazushige Ikeda, and TomooAshizawa, “Application of Tabu Search to Optimal Placement of Distributed Generators”, Power Engineering Society Winter Meeting, Columbus, OH, USA, 28 January - 01 February, 2001.
- W. Krueasuk and W. Ongsakul, "Optimal Placement of Distributed Generation Using Particle Swarm Optimization", Australian Universities Power Engineering Conference, Dec 10-13 2006.
- “Modeling new forms of generation and storage,”CIGRE technical brochure, Nov. 2000.
- Y. Ueda, S. Suzuki, and T. Ito, “Grid stabilization by use of an energy storage system for a large-scale PV generation plant,”ECS Transactions, Vol. 16, No. 34, pp. 17-25, Oct. 2009
- BehnamTamimi, Claudio, Kankar Bhattacharya,”Modeling and Performance Analysis of Large Solar Photo-Voltaic Generation on Voltage Stability and Inter-area Oscillations”, IEEE PES conference meeting.
- Diolata, Ryan, Song, Hwachang, “Optimal Allocation of PV Systems in Distribution Systems using Particle Swarm Optimization”, The International Conference on Electrical Engineering 2008.
- A. Yazdani and P. P. Dash, “A control methodology and characterization of dynamics for a photovoltaic system interfaced with a distribution system,”IEEE Trans. Power Delivery, pp. 1538 –1551, Jul. 2009.
- D. Rama Prabha, R.Mageshvaran, EndlaRaghunath, GudaRaghuram,”Determining the Optimal Location and Sizing of Distribute Generation Unit using Particle Swarm Optimization Algorithm”, International Conference on Computer Communication and Informatics 2012.
- F. Milano, “An Open Source Power System Analysis Toolbox,”IEEE Transactions on Power Systems, vol. 20, no. 3, pp. 1199-1206, Aug. 2005.
- G. Celli, E. Ghaiani, S. Mocci, F. Pilo, "A Multiobjective Evolutionary Algorithm for the sizing and sitting of Distributed Generation," IEEE Trans. on Power Systems, vol.20, 2005.
|