This paper presents the extension of a conventional Optimal Power Flow (OPF) model to include the ramp rate limits of generators. The computational implementation of this model is carried out on the platform provided by the Matlab® optimization toolbox. The solution of the extended model allows verifying if the electric demand curve, for a given period of time, can be supplied at the minimum generation cost without violating the ramp rate limits and ratings of generators, as well as the electric network constraints. At the same time, the solution also reveals the nodal voltage profile of the whole electric network for the given electric demand curve. TheIEEE 3-machine 9-bus test system is considered to show numerical results.
Keywords |
| Power Systems, Optimal Power Flow, Ramp Rate Limits,Matlab®. |
I.INTRODUCTION |
| The conventional Optimal Power Flow (OPF) analysis is a very important tool to deal with economic and security
aspects of electric power systems. The concept of optimal power flow, introduced by Dommel and Tinney in the early
1960's [1], has received great attention since its early application to power systems analysis [2, 3]. OPF is a nonlinear
optimization problem [4], whose solution has been carried out by using a large variety of optimization techniques [2],
[3], [5]. From the power system operation and control viewpoints, an OPF solution gives an answer to adjust available
controls in order to meet the energy demand in the most economically manner while keeping within bounds all the
constraints imposed on the system. OPF studies are being used more and more by engineers, but further applications
ranging from planning, operation and control of power systems are of great interest and must be investigated [6]. |
| The conventional OPF model has already been extended to analyze a wide range of problems associated with the
operation of electric power systems. By way of example, the OPF model has been extended to; identify and analyze
saddle-node and limit-induced bifurcations [7], investigate the effects of reactive power limit modeling on Maximum
System Loading and Active and Reactive Power Markets [8], consider transient and voltage stability constraints
[9, 10, 11] and analyze the steadystate operation of power systems with Flexible AC Transmission Systems under static
security constraints [12]. Recently, the economic dispatch has received great attention to implement the tertiary control
of microgrids, which is devoted to the energy management in these systems [13]. |
| This paper presents the extension of the conventional OPF model to consider the ramp rate limits of the generators. For
this purpose, the conventional model reported in [14] is adopted. Physically, the ramp rate limits represent the rate at
which the output power level of given plant can be modified to satisfy the power balance [15]. The conventional OPF
model ignores these constraints. In this way, the steady state operating point provided by the solution of this
conventional model assumes that the output power level of any generator can be changed in the available period of time
to satisfy a new power demand level. Note, however, that under that assumption, the ramp rate limits of generators
could be violated. This condition would be more important if the power produced by renewable energy plants is
integrated to the system. |
| The paper is organized as follows. The Section II provides a description of related work. The Section III of the paper
shows, in general way, the mathematical extension of the conventional OPF to consider the ramp rate limit constraints.
The power system components modeling and the explicit OPF formulation are presented in Section IV. The solution
and the computational implementation of the extended OPF model are discussed in Section V. The prowess of the proposed implementation is illustrated by means of considering a numerical example in Section VI. The work
conclusions are given in Section VII. |
II.RELATED WORK |
| The efficient and optimum economic operation and planning of electric power systems have always occupied an
important position in the electric power industry [16, 17]. The first efforts to optimize the power system operation were
focused on determining the optimal generation dispatch, which encouraged the formulation and solution of the classic
economic dispatch problem. The classic economic dispatch, however, is formulated as a static problem that does not
"look ahead" over the future time horizon, using the predicted load trends to determine the economic allocation of
generation to the load [18]. Therefore, if the power is dispatched according to the solution provided by the classic
economic dispatch approach, the supply of electric power to the load may be at risk due to the ramp rate capacity of the
dispatchable generators.In order to circumvent this problem, the dynamic economic dispatch problem extends the
classic economic dispatch model for considering the ramp rate capacity of generators.Although the dynamic economic
dispatch has been a widely studied concept [18], the topic has recently received much attention due to the development
of innovative optimization techniques, the creation of competitive power markets, the integration of renewable energy
resources, environmental constraints, etc. |
| The heuristic optimization algorithms, as differential evolution [19] and hybrid heuristic optimization [20], have been
applied to solve the optimization model related to the dynamic economic dispatch problem. Also, in order to take into
account the integration of renewable energy sources, the particle swarm optimization method [21] and the sequence
operation theory combined with genetic algorithms [22] have been considered to solve the optimization model.Bearing
in mind the operation of electric power systems within an environment of electric power markets, the dynamic
economic dispatch model has been reformulated and solved in [23]. The benders decomposition method has also been
considered to solve the optimization problem within the aforementioned modern power system operation context [24].
Environmental considerations were taken into account in [25], where the dynamic economic dispatch problem is solved
via the particle swarm optimization method. It must be pointed out that the dynamic economic dispatch has also been
enlarged to approximate the optimal energy management of microgrids [26]. |
| The classic economic dispatch approach is close related to the OPF approach in the sense that the both optimization
procedures determine the optimal power dispatch that satisfies the power demand to the lowest objective function
value. Unlike the classic economic dispatch approach, however, the OPF approach can deal with transmission losses,
network constraints and static security constraints, and even dynamic security constraints [27], in a very flexible way.
In this sense, it is has been of interest to extend the OPF model to include the ramp rate limit of generators. The
solution of this enlarged OPF model has been solved by using the evolutionary programming [28, 29], as well as hybrid
particle swarm optimization and simulated annealing methods [30]. The imperialistic competitive algorithm was
applied to solve a OPF model with ramp rate limits constraints and FACTS controllers embedded [31]. Similar to de
dynamic economic dispatch model, the OPF model has been also enlarged to take into account ramp rate limits of
generators along with environmental considerations [32], but solving the resulting problem by means of a fuzzy linear
programming approach. It should be noted that the use of commercial solver packages, as AMPL, has been considered
to solve the OPF model with ramp rate constraints, as reported in [33]. |
| This work extends the conventional OPF model to consider the ramp rate limit of generators. The extended OPF is
formulated as a nonlinear convex optimization problem in polar coordinates. The extension of the conventional OPF is
given in the paper in detail. The resulting model can be viewed as a semi-infinite optimization problem. However, the
discretization of the constraints along the time axis can also be applied to simplify the solution of the model, as
described in Section V. In this way, the dynamic OPF model can be directly solved by using the “fmincon” function of
the Matlab optimization toolbox [34], which simplifies the computational implementation and solution of the
optimization problem. |
III.GENERAL EXTENDED OPF MODEL |
| The ramp rate limit R constrains the rate at which the output power level of given generator can be modified from one
time step tz-1to another step tz, where △t=tz-tz-1. Thus, in order to satisfy a forecasted demand curve for the time interval
T=[t0, t1,…,tend], the ramp rate limit of each generator should be satisfied for that whole time interval T. It must be |
| pointed out that for the purpose of simplifying the mathematical problem; the load demand curve and T were
discretized at time steps tz (z=0,1,…end) (see Section IV). Accordingly, in order to supply the power demand at step tz
with the minimum total generation cost, a corresponding optimal operating point that satisfy the physical and operating
limits of the system, as well as the ramp rate limit R constraints of the generators, at that time step must be computed.
Note, however, that the generator output power levels at consecutive time steps are related by the corresponding ramp
rate limit constraint. Therefore, the set of optimal operating points that satisfy the power demand for the whole set of
time steps, must be computed in a unified way. According with the aforementioned discussion, the set of optimal
operating points is obtained from the solution of the following extended OPF model, |
Minimize (1) (1) |
Subject to  (2) (2) |
 (3) (3) |
 (4) (4) |
 (5) (5) |
| where tend is the last time step of the time interval T of interest. Bearing in mind that the script tz represents the z-esim
time step, the description of theremaining terms of (1)-(5) for each time step tz is as follows. FT is the objective function
to be minimized, which is given as the sum of the total generation cost f(y) at each time step. h(y) is a set of equality
constraints representing the nodal active and reactive power balance equations. g(y) is a set of functional inequality
constraints representing operating limits that depend on the system variables. y is the set of variables to be solved and it
is composed by the sets of nodal voltages magnitude V and angles θ, as well as the output power of generators P. The
lower and upper limits of these variables are y and y , respectively. R and R are the down and up ramp rate limits of
generators, thus P represents the increments of P between two successive time steps tz and tz-1. |
IV.EXPLICIT FORMULATION |
| In this section the explicit model of the power system components are firstly given. The power system components
considered in this work are generators, loads, shunt compensation elements, transmission lines and transformers. Then,
these explicit models are used to assemble the explicit extended OPF model in polar coordinates. |
| A. Power system Modelling |
| 1) Generators |
| The generator is modeled as a controllable source of complex power, which at time step tz provides the complex output
power given by (6). Where z tg
P i and z tg
Q i are the active and reactive output power of the i-esim generator at time step tz.
The corresponding lower and upper limits are Qgi , Pgi and Pgi , Qgi , respectively. If thermal units are considered, the
active power production cost of the i-esim generator is given by (7). |
 (6) (6) |
 (7) (7) |
| where ai, bi and ci are the cost curve coefficients. The upper and lower limits of the voltage magnitude Vtz of the iesim
generation bus are Vgi and V gi , respectively. Please, note the aforementioned upper and lower limits are not
considered time dependent.An additional characteristic of the generator is its ramp rate limit R (in MW/hr). This limit
represents the change in the output power level that can be achieved for a generator in a period of time △t. This will be
formulated as inequality constraint in Section III.B. |
| 2) Loads |
| For the time step tz, the power demand is considered as constant complex power consumption, stated by (8). Where
tz
Pli and tz
Qli are the active and reactive power at the i-esim load bus. The upper and lower bounds of the voltage
magnitude Vtz for the load substation are tz
Vli and tz
Vli , respectively. These limits are not considered time dependent. |
 (8) (8) |
| 3) Shunt Compensation Element |
| Shunt compensation elements are described by means of a magnitude voltage dependent complex power for each time
step tz, as given by (9). The terms inj tz
Pi and inj tz
jQi are the active and reactive power injections provided by the
i-esim shunt admittance connected at the bus i, which are explicitly described by (10) and (11), respectively. |
 (9) (9) |
 (10) (10) |
 (11) (11) |
| where tz
Vi is the voltage magnitude at the compensation node with upper and lower limits Vshi and Vshi , respectively.
The compensation admittance is Y=G+jB, where G and B are the shunt conductance and susceptance. The values of
Vshi , Vshi , G and B are considered time independent. |
| 4) Transmission Lines |
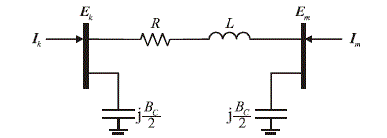
| The transmission lines are represented by the π equivalent circuit of Fig. 1, where tz
j I and tz
j E are the injected current
and voltage phasors at node i (i=k,m) and time step tz. R, L and Bc are the series resistance, series inductance and the
shunt susceptance. The current-voltage relation of the equivalent circuit is given by (12)-(15). |
 (12) (12) |
 (13) (13) |
 (14) (14) |
 (15) (15) |
| At time step tz, the power injected at node i through the transmission element connected between nodes i and j , where
i=k;m, j=k,m, i≠j, is mathematically described as follows, |
 (16) (16) |
| The Euler’s identity is applied to write (16) in its real and imaginary parts, |
 (17) (17) |
 (18) (18) |
| Please note that in the equations of the transmission line, only the voltages and currents are time dependent. |
| 5) Conventional Transformers |
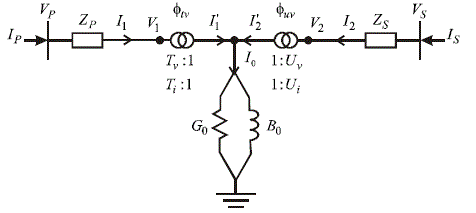
| In order to simulate networks with transformers having changers at off nominal tap ratio position at either primary or
secondary side, the two winding transformer is modeled with complex taps on both primary and secondary windings.
The schematic equivalent circuit is shown in Fig 2.The primary winding is represented as an ideal transformer having
complex tap ratios Tv:1 and Ti:1 in series with the impedance Zp, where Tv=Ti*=Tv tv [14]. The superscript * denotes
the conjugate operation. Also, the secondary winding is represented as an ideal transformer having complex tap ratios |
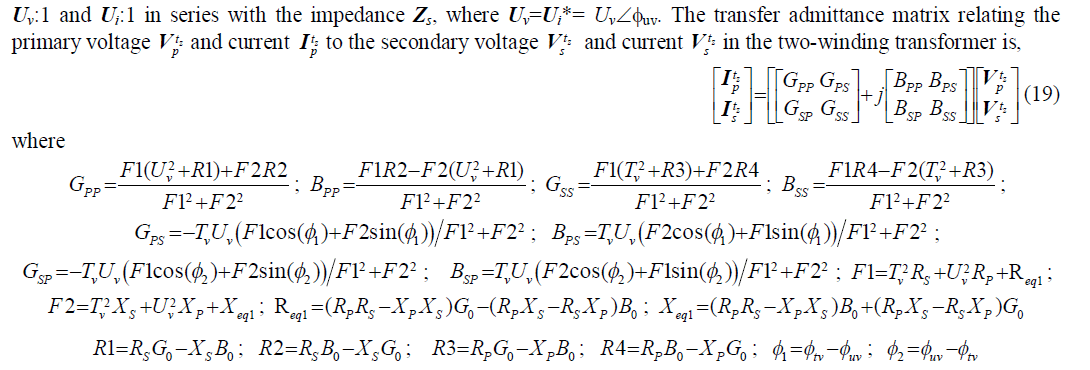 |
| At time step tz, the active and reactive power injections at node i through the transformer connecting nodes i and j,
where i=p,s, j=p,s, i≠j, are respectively computed by using (17) and (18), but using conductances and susceptances of
(19). It must be pointed out that in all the above mentioned equations of the conventional transformer, only the voltage
and current phasorsvariables are time dependent. |
| B. OPF Explicit Model |
| The OPF explicit formulation is straightforwardly assembled by considering the aforementioned models of the power
system components, as given below. |
| 6) Objective Function |
| The objective is to minimize (1), which is the sum of the total generation cost f tz ( ytz ) at each time step tz. Hence,
f tz ( ytz ) can be explicitly formulated taking into account (7), as given by (20),where ai, bi and ci are the cost curve
coefficients for generator connected to bus i. Ng is the number of generators, whose individual output power level is Pgi. |
 (20) (20) |
| 7) Equality Constraints |
| The energy balance of the power system must be unconditionally satisfied at each time step tz. This is enforced by
means of (2), which is explicitly formulated in terms of the active and reactive power balance at each bus according to
the equality constraint set (21). |
 (21) (21) |
| where Nb is the number of buses. The active and reactive output power levels, z tg
P i and z tg
Q k , respectively, as indicated |
| by (5). The active tz
Pli and reactive tz
Qlk power loads are the complex power consumption, as given by (7). Σji,k is the |
| set of nodes adjacent to node j, whilst tz
Pinj j and tz
Qinj j are active and reactive power flows injected at bus j through the
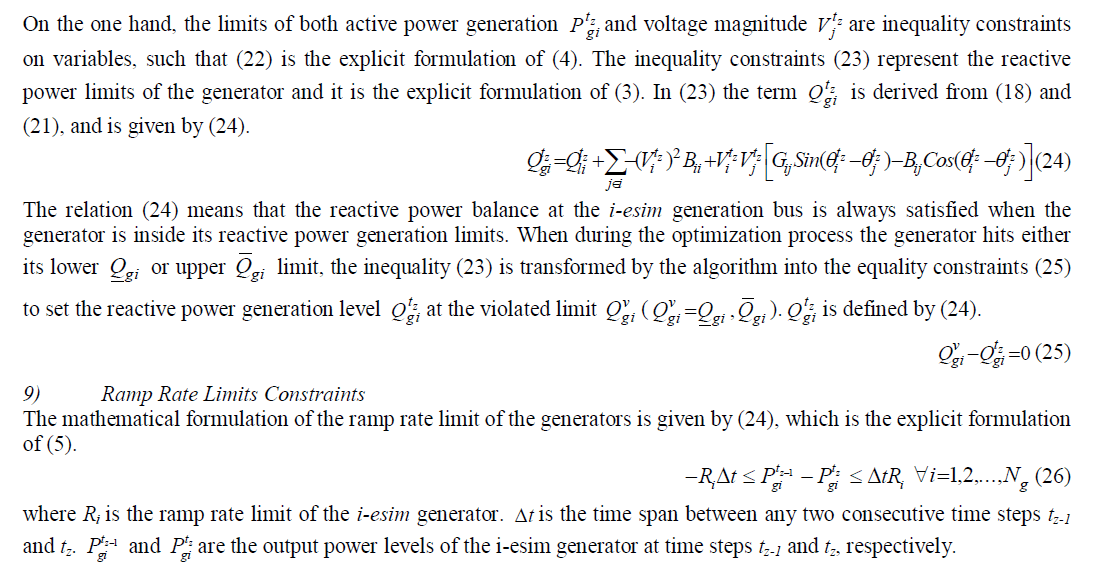
network elements, according to (10), (11), (17) and (18). The reactive power balance equality constraint can be only
stated for non-generation buses (kNg). However, the reactive power balance at generation buses is handled by means
of an inequality constraint [14], as stated in the following section. |
| 8) Inequality Constraints |
| The physical and operating limits of generators and substations are formulated by means of inequality constraints sets, |
 (22) (22) |
 (23) (23) |
 |
V. IMPLEMENTATION AND SOLUTION OF THE EXTENDED OPF MODEL |
| From its origin, the model required to include the ramp rate constraints of the generators is a semi-infinite programing
problem. This means the optimization model has a finite number of variables, but infinite number of constraints. This is
because of the amount of variables is defined by the amount nodes and generators composing the power system. Note,
however, that in order to obtain a continuous solution along the time axis, the length of time step △t must tend to zero.
In this way, the resulting number of constraints is infinite. Unfortunately, there is not optimization technique able to
straightforwardly solve this kind of problem. In order to obtain an approximated solution of this problem, the time
interval T can be discretized in a finite number of time steps tz, which straightforwardly allows formulating a finite
optimization problem. Accordingly, the resulting finite problem can be solved considering the conventional
optimization theory. |
| The aforementioned reasoning was also used here to take into account the ramp rate limit constraints of the generators.
Then, the resulting optimization model (1)-(5) is solved by using the fmincon function of the optimization toolbox of
Matlab® [34]. This function is based on a Sequential Quadratic Programming optimization algorithm. In addition, the
computational implementation reported in [14] was adopted and extended in this work to solve the OPF problem taking
into account the ramp rate constraints of the generators. The following section shows numerical results. |
VI. NUMERICAL EXAMPLE |
| In order present numerical results, the computational algorithm developed in this work was applied to analyze the
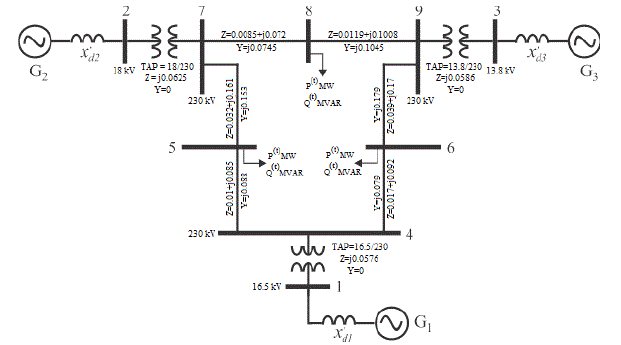
IEEE 3-machine 9-bus test system [35]. The Fig. 3 shows the schematic diagram of the system. In this diagram, the
electric parameters of the network components are given in pu on a base power of 100MVA. The system voltage levels
range from 13.8kV to 230kV. The generators data and ratings are given in Table I; the generator number, lower and
upper active power limits, lower and upper reactive power limits, curve cost coefficients (a, b, and c) [36] and the ramp
rate limits are shown from column 1 to 9, respectively. The limits of the nodal voltage magnitudes are set to
0.95≤Vi≤1.05 pu. The total active and reactive power demand curves for a time interval T of 23 hrs are illustrated in
Fig.4. It was considered that the power demand change at constant power factor. For the study, 24 time steps tz were
considered with a time step length △t equal to 1hr. For the purposed of this case study, both the active and reactive
total power demand are shared among the three loads connected at nodes 5, 6 and 8, respectively. |
| The fmincon function is executed to obtain the unified solution of (1)-(5), which provides at once the set of optimal
operating points that satisfy the power demand for the whole set of time steps, minimize the total generation cost,
satisfy the physical and operating limits and the ramp rate limit constraints. The convergence tolerance for the fmincon
function was set to 1x10⁻⁶. The columns 2 through 7 of the Table II show the resulting optimal power dispatch
corresponding to the computed 24 operating points, which are illustrated in Fig. 5. Additionally, the associated nodal
voltage magnitudes at nodes Ni (i=1, 2, …, 9) are illustrated in Fig. 6.a. The status of the ramp limit constraint (24) of
the generators for the whole time interval T of interest is illustrated in Fig. 6.b. In this figure, a value of zero means that
the constraint is not active, i.e., the generator operates below of its ramp rate limit. Values of minus one and plus one
indicate that the generator is operating at either its upper or lower ramp rate limit. |
| Based on the above results, the following remarks are stated. The results shows that the power demand curve forecasted
for the time interval T can be satisfied by the generators; otherwise the optimization algorithm would reach an unfeasible solution. The Fig. 5 shows that the computed active and reactive power dispatch is in accordance with the
active and reactive power demand curves. Note from Fig. 6.b, however, that in order to economically satisfy the power
demand, the generator G1 must change its activeoutput power level from time step t16 to t20 at its upper ramp rete limit
(upper limit of constraint (24) is active). This generator also changes its active output power level at its lower ramp rate
limit from t22 to t24(lower limit of constraint (24) is active). Similarly, the generator G2 operates at its ramp rate limit
from time step t18 to t20. The generator G3 does not operates at its ramp rate limit along T. The ramp rate limit status
could be corroborated numerically from Table I by subtracting the output power of the i-esim generatorfor two
consecutive time steps. tz and tz-1. With regard to the nodal voltages, the figure 6.a reveals that the voltages have an
important decrease from t16 to t20. This could be also expected, since the reactive power demand importantly increases
during that time interval (see Fig.4.b). We highlight that based on these results, the complex power flow distribution
for the entire network, and the whole interval T, could be readily evaluated. |
VII.CONCLUSION |
| This work presents the extension of a conventional OPF model to consider the ramp rate limit of the generators. The
extended model was solved by using the optimization toolbox of Matlab®. The unified solution of the proposed model
provides a set of optimum steady state operating points that satisfy the forecasted demand curve whilst satisfying the
physical and operating conditions of the power system, as well as the ramp limit constraint of the generators. The value
of the whole set of network variables is known at the solution, such that the nodal voltage level can be verified for the
whole interval T. |
Tables at a glance |
 |
 |
| Table 1 |
Table 2 |
|
| |
Figures at a glance |
 |
 |
 |
| Figure 1 |
Figure 2 |
Figure 3 |
 |
 |
 |
| Figure 4 |
Figure 5 |
Figure 6 |
|
| |
References |
- B. Stott, “Power system dynamic respond calculations”. Proc. of the IEEE, Special Issue on Computers in Power System Operations, Vol. 67, No. 2, pp. 219-241, Feb. 1979.
- M. Huneault and F. D. Galiana, "A survey of the optimal power flow literature". IEEE Trans. on Power Syst., Vol.6, No.2, pp.762-770, May 1991.
- J.A. Momoh, "Optimal Power Flow with Multiple Objective Functions". Proc. of the 1989 IEEE North American Power Symposium, pp.105- 108.
- J. A. Momoh, M.E. El-Hawari, and R. Adapa, “A review of selected optimal power flow literature to 1993: part I: nonlinear and quadratic programming approaches”. IEEE Trans. Power Syst., Vol. 14, No. 1, pp. 96-104, February 1999.
- J. A. Momoh, M.E. El-Hawari, and R. Adapa, “A review of selected optimal power flow literature to 1993 part II: Newton, linear programming and interior point methods”. IEEE Trans. Power Syst., Vol. 14, No. 1, pp. 105-111, February 1999.
- J.A. Momoh, R.J. Koessler, M.S. Bond, B. Stott, and D. Sun, A. Papalexopoulos and P. Ristanovic, “Challenges to optimal power flow”. IEEE Trans. Power Syst. Vol. 12, No. 1, pp. 444-455, Feb. 1997.
- R. J. Avalos, C.A. Cañizares, F. Milano, and A. J. Conejo, “Equivalency of Continuation and Optimization Methods to Determine Saddle-Node and Limit-Induced Bifurcations in Power Systems”. IEEE Trans. on Circuits and Systems, Vol. 56, No. 1, pp. 210-223, January 2009.
- B. Tamimi, C.A. Cañizares, and S. Vaez-Zadeh, “Effect of Reactive Power Limit Modeling on Maximum System Loading and Active and Reactive Power Markets” IEEE Trans. on Circuits and Systems, Vol. 25, No. 2, pp. 1106-1116, May 2010.
- V.J. Gutierrez-Martinez, C.A. Cañizares, C.R. Fuerte-Esquivel, A. Pizano-Martínez, and X. Gu, “Neural-network security-boundaryconstrained optimal power flow”. IEEE Trans. Power Syst., Vol. 26, No.1, pp.63-72, Feb., 2011.
- Pizano-Martínez A., Fuerte-Esquivel C.R., and Ruiz-Vega D., “Global Transient Stability-Constrained Optimal Power Flow using SIME Sensitivity analysis,” IEEE-PES General Meeting 2010, pp. 8, July 2010.
- R. Zárate-Miñano, T. Van Cutsem, F. Milano and A. J. Conejo, “Securing transient stability using time-domain simulations within an optimal power flow”. IEEE Trans. on Power Syst.,Vol.25, No.1, pp. 243-253, Feb. 2010.
- I. Catherine Divya and Dr. S. Nagalakshmi, “Comparison of Mincut and Differential EvolutionAlgorithms for SCOPF with FACTSDevicesunder normal and n-1 contingency conditions,” IJAREEIE, Vol.3, No. 4. pp.9159-9167, April 2014.
- Bidram, A.; Davoudi, A., "Hierarchical Structure of Microgrids Control System,"IEEE Trans. onSmart Grid, Vol.3, No.4, pp.1963-1976, 2012.
- Pizano-Martínez, A., Fuerte-Esquivel, C., Zamora-Cárdenas, E.A., and Segundo Ramírez, J., “Conventional Optimal Power FlowAnalysis Using the Matlab Optimization Toolbox,” IEEE ROPEC International 2010, pp. 6, Nov. 2010.
- K. Asano and T. Kumano,"Dynamic economic load dispatch by calculus of variation considering ramp rate," Proc. of the 2007 PowerEngineering Conference, IPEC 2007, pp.167-172, 2007.
- A. J. Wood and B. F. Wollenberg, Power Generation, Operation, and Control. 2nd ed., John Wiley and Sons, 1984.
- MohdJaved Khan and HemantMahala, “Particle Swarm Optimization by NaturalExponent Inertia Weight for Economic loadDispatch,” IJAREEIE, Vol.3, No. 12. pp.13657-13662, April 2014.
- D. W. Ross and Sungkook Kim, “Dynamic Economic Dispatch of Generation”. IEEE Trans. on Power Apparatus and Systems, Vol.PAS-99, No.6, pp.2060-2068, Nov./Dec.1980.
- N. Noman and H. Iba, "Solving dynamic economic dispatch problems using cellular differential evolution,"IEEE Congress on Evolutionary Computation (CEC) 2011, pp. 8, June 2011.
- W. Ongsakul and Ruangpayoongsak, N., "Constrained dynamic economic dispatch by simulated annealing/genetic algorithms," Proc. of the 2001 Power Industry Computer Applications, pp.207-212, 2001.
- F.S. Abu-Mouti and M.E. El-Hawary,"Optimal dynamic economic dispatch including renewable energy source using artificial bee colony algorithm," Proc. of the 2010 Systems Conference, pp.1-6, 2010.
- Dewei Liu, JianboGuo, Yuehui Huang, Weisheng Wang, and Ping Wang, "A dynamic economic dispatch method of wind integrated power system considering the total probability of wind power," IET Renewable Power Generation Conference (RPG 2013), pp.4, Sept. 2013.
- Y. Chien-Ning, A. I. Cohen and B. Danai,"Multi-interval optimization for real-time power system scheduling in the Ontario electricity market," IEEE Power Engineering Society General Meeting 2005, pp.2717-2723, June 2005.
- J. Martínez-Crespo, J. Usaola and J.L. Fernández, “Optimal security-constrained power scheduling by Benders decomposition”, Electric Power Systems Research, Vol. 77, No. 7, pp 739-753, May 2007.
- Y. Guan, Y. Wang and Z. Tan, "Environmental Protection and Security Considered Dynamic Economic Dispatch for Wind Farm Integrated Systems," IEEE Asia-Pacific Power and Energy Engineering Conference (APPEEC) 2012, pp. 4, March 2012.
- L. Xiaoping, D. Ming, h. Jianghong, H. Pingping, y P. Yali,“Dynamic economic dispatch for microgrids including battery energy storage,” Proc. of the 2010 Power Electronics for Distributed Generation Systems (PEDG), pp.914-917, 2010.
- A. Pizano-Martínez, C.R. Fuerte-Esquivel, A. Zamora-Cárdenas, and D. Ruiz-Vega," Selective Transient Stability-Constrained Optimal Power Flow Using a SIME and Trajectory Sensitivity Unified Analysis", Electric Power Systems Research, Elsevier, ISSN 0378-7796, Vol. 109, No. 3, pp.32-44, April 2014.
- R. Gnanadass, P. Venkatesh and N. Prasad Padhy,“Evolutionary Programming Based Optimal Power Flow for Units with Non-Smooth Fuel Cost Functions,” Electric Power Components and Systems, Vol.33, No. 3, pp. 349-361, 2004.
- B. Mahdad and K. Srairi, “A Study on Multi-objective Optimal Power Flow under Contingency using Differential Evolution,” J. Electr. Eng. Technol. (JEET) Vol. 8, No. 1, pp.53-63, 2013.
- T. Niknam, M.R. Narimani and M. Jabbari, “Dynamic optimal power flow using hybrid particle swarm optimization and simulated annealing,” International Transactions on Electrical Energy Systems, Vol. 23: No. 7, pp. 975–1001, October 2013.
- G. Nageswara Reddy, S. S. Dash, S. Sivangaraju and Ch. V. Suresh, “Optimal Power Flow in the Presence of Practical Constraints and with TCSC using Imperialistic Competitive Algorithm,” Global Journal of Researches in Engineering, Vol. 14, No. 8, pp. 14-22, 2014.
- K. Chayakulkheeree,"Unified multi-objective optimal power flow considering emissions with fuzzy network and generators ramp-rateconstraints," Electrical Engineering/Electronics, Computer, Telecommunications and Information Technology (ECTI-CON) 2011, pp.832-835, May 2011.
- W. A. Bukhsh,C. Zhang, P. Pinson, “A Multiperiod OPF Model Under Renewable Generation Uncertainty and Demand Side Flexibility,” Cornell University Library: math.OC,pp. 8, 2014.
- The MathWorks, Inc., “Matlab Optimization Toolbox,” Users Guide Version 2, available athttp://www.mathworks.com.
- P. W. Sauer and M. A. Pai. Power System Dynamics and Stability. Prentice-Hall, 1998.
- T. B. Nguyen and M. A. Pai, “Dynamic security-constrained rescheduling of power systems using trajectory sensitivities,” IEEE Trans. Power Syst., Vol. 18, No. 2, p.p. 848–854, May 2003.
|