ISSN ONLINE(2278-8875) PRINT (2320-3765)
ISSN ONLINE(2278-8875) PRINT (2320-3765)
NNEBE Scholastica .U
|
| Related article at Pubmed, Scholar Google |
Visit for more related articles at International Journal of Advanced Research in Electrical, Electronics and Instrumentation Engineering
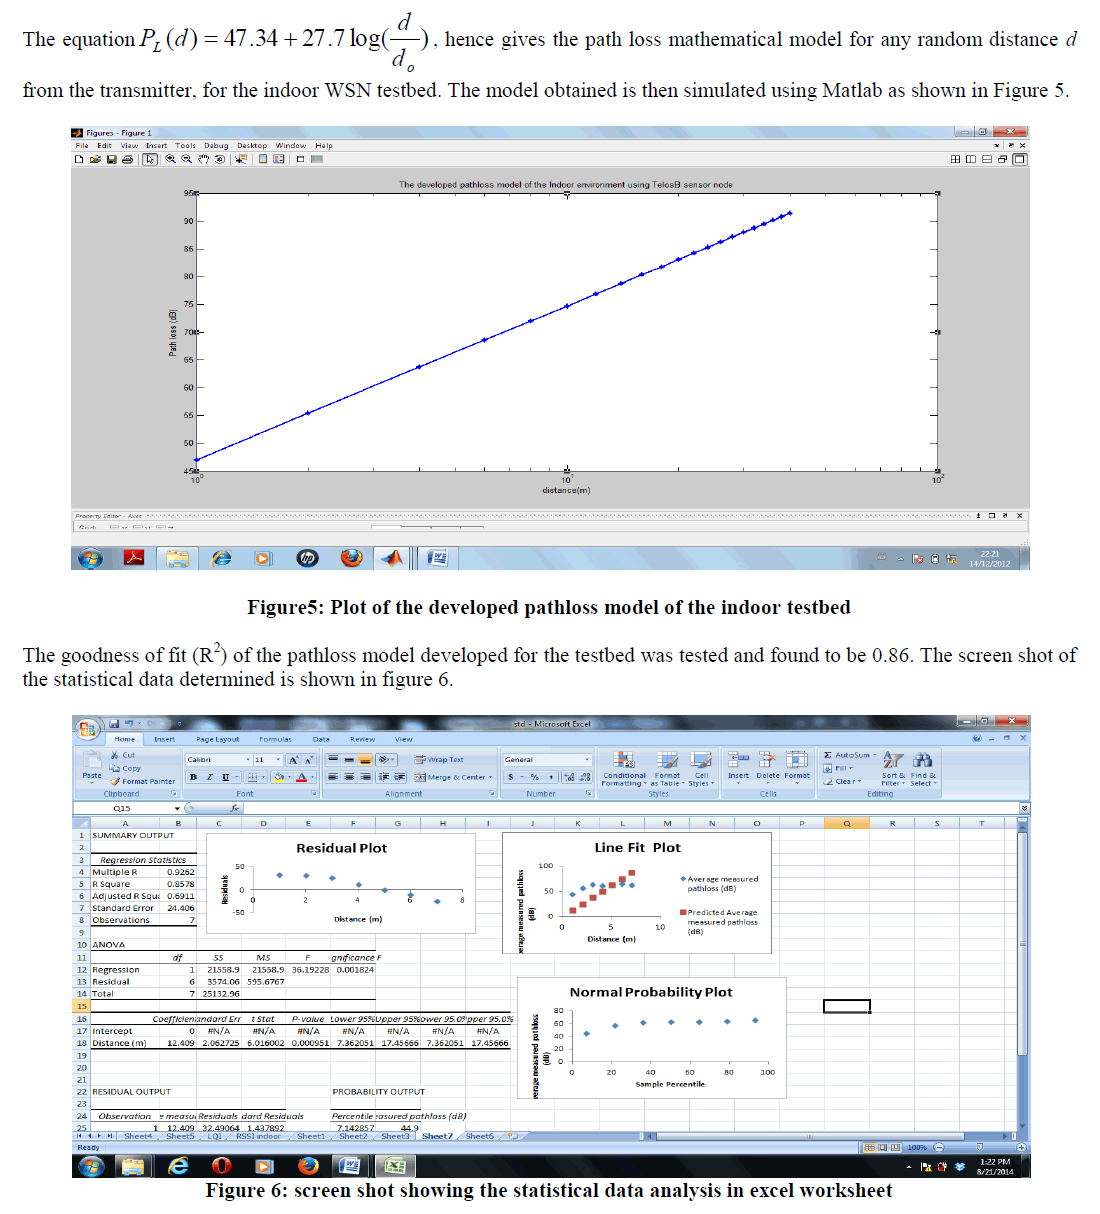
The propagation of radio signals is affected by several factors that contribute to the degradation of its quality and these are more significant on the propagation of wireless signals with low-power radios, typically used in Wireless Sensor Networks (WSNs). This makes radio links in WSNs to be unpredictable. This paper presents the development of an indoor channel prediction model of Wireless Sensor Network (WSN). A WSN testbed comprising of four TelosB sensor nodes was built at the corridor of first floor of Goddian Ezekwem building, faculty of Engineering, Nnamdi Azikiwe University, Awka. Three of the sensor nodes were placed at angles and the remaining one was attached to a laptop and used as the sink. Extensive measurements of RSSI were taken at distances of 1m to 7m at the interval of 1m. Channel prediction model of the environment was developed from the measured data using Linear Regression Analysis. The developed model was tested and the regression data analysis gives the R Square (R2) as 0.86, Multiple R as 0.93 and Adjusted R Square as 0.70.
Keywords |
| pathloss, TelosB sensor nodes, WSNs, Indoor environment |
I. INTRODUCTION |
| The propagation of radio signals is affected by several factors that contribute to the degradation of its quality. The effects of these factors are more significant on the propagation of wireless signals with low-power radios, typically used in Wireless Sensor Networks (WSNs). Consequently, radio links in WSNs are often unpredictable. In fact, their quality fluctuates over time [1, 2] and space and connectivity is typically asymmetric [3-5]. However, it is well known that three factors lead to link unreliability, namely: the environment, the interference and hardware transceivers. The environment leads to multipath propagation effects and contributes to background noise. The interference results from concurrent transmissions within a wireless network or between cohabiting wireless networks and other electromagnetic sources while hardware transceivers may distort sent and received signals due to their internal noise [6, 7]. |
| In WSNs, these radio transceivers transmit low-power signals, which make radiated signals more prone to noise, interference, and multi-path distortion. Also, they rely on antennas with non-ideal radiation patterns, which lead to anisotropic behaviour. To see to the proper monitoring of the wireless system, Wireless Sensor Network (WSN) can be deployed to the monitoring environments to sense, analyze and transmit/retransmit the data from remote distances wirelessly. It is necessary to evaluate the quality of the transmitted signals such that error detection, correction and control can be effected simultaneously in order to obtain an error free result. Therefore, this work provides the frame work for the characterization of an indoor environment. The sensor nodes used in the work are deployed at angles to obtain an all round measurements of signal strength in the form of Received Signal Strength Indicator (RSSI). The measurements were done for several months and the result obtained were analysed. The measurement environment was characterised and the pathloss model of the environment was developed. |
II. LITERATURE REVIEW |
| Path loss is the reduction in power density of an electromagnetic wave as it propagates through space. Path loss is a major component in the analysis and design of the link budget of a telecommunication system. This term is commonly used in wireless communications and signal propagation. Path loss may be due to many effects, such as free-space loss, refraction, diffraction, reflection, aperture-medium coupling loss, and absorption. Path loss is also influenced by terrain contours, environment, propagation medium, the distance between the transmitter and the receiver, the height and location of antennas. |
| Several works have been done on pathloss models of environment. A model that is widely used for predicting path loss in mobile wireless system is the COST-231 Hata model [8]. It was devised as an extension to the Hata-Okumura model [9, 10]. The COST-231 Hata model is designed to be used in the frequency band from 500 MHz to 2000 MHz. It also contains corrections for urban, suburban and rural (flat) environments. Although its frequency range is outside that of the measurements, its simplicity and the availability of correction factors has seen it widely used for path loss prediction at this frequency band. |
| To evaluate the applicability of the COST-231 model for the 3.5 GHz band, the model predictions are compared against measurements for three different environments namely, rural (flat), suburban and urban. In [10] Okumura carried out an experiment in the suburbs of Tokyo. He subdivided urban areas into „large cityâÃâ¬ÃŸ and „medium cityâÃâ¬ÃŸ categories. He also gives correction factors for „suburbanâÃâ¬ÃŸ and „openâÃâ¬ÃŸ areas. Since the characteristics of a highly built-up area such as Tokyo are quite different to those found in typical European suburban areas, use of the „medium cityâÃâ¬ÃŸ model is recommended for European cities [11, 12]. The accuracy of Hata-Okumura model is questionable for higher frequencies [9], despite the fact that it is widely used for UHF bands. |
| In [13], Electronic Communication Committee ECC-33 path loss model was presented. This extrapolates the original measurements by Okumura and modifies its assumptions so that it more closely represents a FWA system. However, the predictions produced by the ECC-33 model do not lie on straight lines when plotted against distance having a log scale. |
| The authors in [14] developed a channel prediction model of an outdoor environment using TelosB sensor nodes. They built a wireless sensor network testbed at the library field of Nnamdi Azikiwe University Awka. Extensive real time measurements of RSSI were taken at various distances up to 60m at the interval of 5m in the testbed. The measured RSSI was used to develop the pathloss model of the environment. |
III. RESEARCH METHODOLGY |
| This paper presents an experimental study of WSN in an indoor environment. Real-time experiments were conducted to determine the signal strength of Wireless Sensor Nodes in the test bed environment. The aim of the experiment is to characterize the test bed environment and develop the pathloss model of the environment under study. The testbed environment is the corridor of the first floor of Goddian Ezekwem building, faculty of Engineering, Nnamdi Azikiwe University, Awka. The development kit used is the Crossbow TelosB sensor node from Texas Instrument which uses CC2420 transceiver – an IEEE 802.15.4 with a built in 2.4GHz antenna. An ideal environment was created by avoiding serious obstacles that would impair the quality of the received signal. |
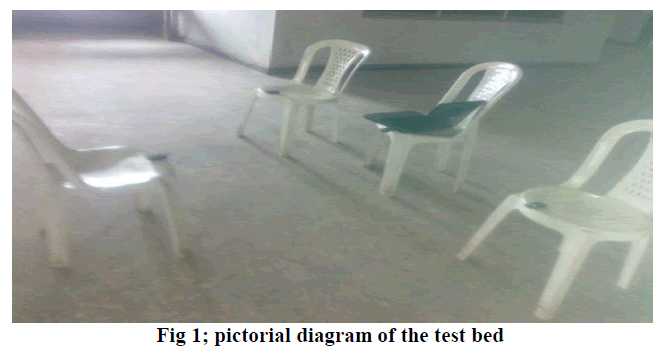
| The testbed consisted of four Crossbow TelosB sensor nodes programmed with NesC programming language. The program for the collection of data and graphical user interface display of the sensor nodes were written in Java language. The program displays the data received in an excel format. The nodes are programmed to send data every 5 seconds. The data collected over a long period of time was averaged and used for analysis. One of the sensor nodes was attached to the laptop and was used as the sink. The remaining three sensor nodes were placed at 00, 900, 1800 from the sink at the same distances while taking the measurements. This was done get approximately all round readings of the signal. The measurements were taken from 1m to 7m at the interval of 1m. At each distance reading were taken for 2 minutes given a total of 20 readings for every distance. The mean value of the RSSI obtained at a given distance was calculated. Figure 1 shows the pictorial diagram of the testbed during measurement. |
 |
| A. Path loss model of the environment |
| The empirical model used in this study is the Log-distance Path Loss Model. In both indoor and outdoor environments the average large-scale path loss for an arbitrary transmitter-receiver (T-R) separation is expressed as a function of distance by using a path loss exponent, n [7]. The average path loss PL(d) for a transmitter receiver separation, d is: |
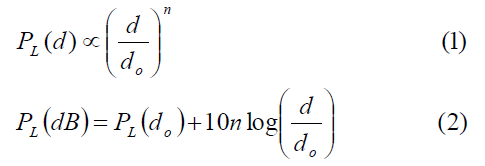 |
| In this model, PL, represents the average path loss experienced between the receiver and sender in dB. PL(do) represents the reference path loss in dB, when the transmitter-to-receiver (T-R) distance is at reference distance do, n is the path loss exponent which indicates the rate at which the path loss increases with distance, do is the close-in reference distance which is determined from measurements close to the transmitter, and d is the T – R separation distance. The value of n depends on the specific propagation environment. For example, in free space n is equal to 2, and when obstructions are present, n will have a larger value. |
| In the experimental measurement carried out, a reference distance, do of 1meter was used as a known received power reference point. The received power, Pr(d) at any distance d>do, is related to Pr at do. The value Pr(do) was measured in the radio environment by taking the average received power at many points located at a distance do from the transmitter. Equation 3 was used to determine the measured pathloss PLm, since the transmitted power Pt is known and received power Pr obtained in the experiment. In the experiment, Pt is set at 0dBm. Both theoretical and measurement based propagation models indicate that average received signal power decreases logarithmically with distance, whether in outdoor or indoor radio channels. Pathloss (PL) represents signal attenuation as a positive quantity measured in dB and is defined as the difference (in dB) between the effective transmitter power and the received power as shown in equation 3. |
 |
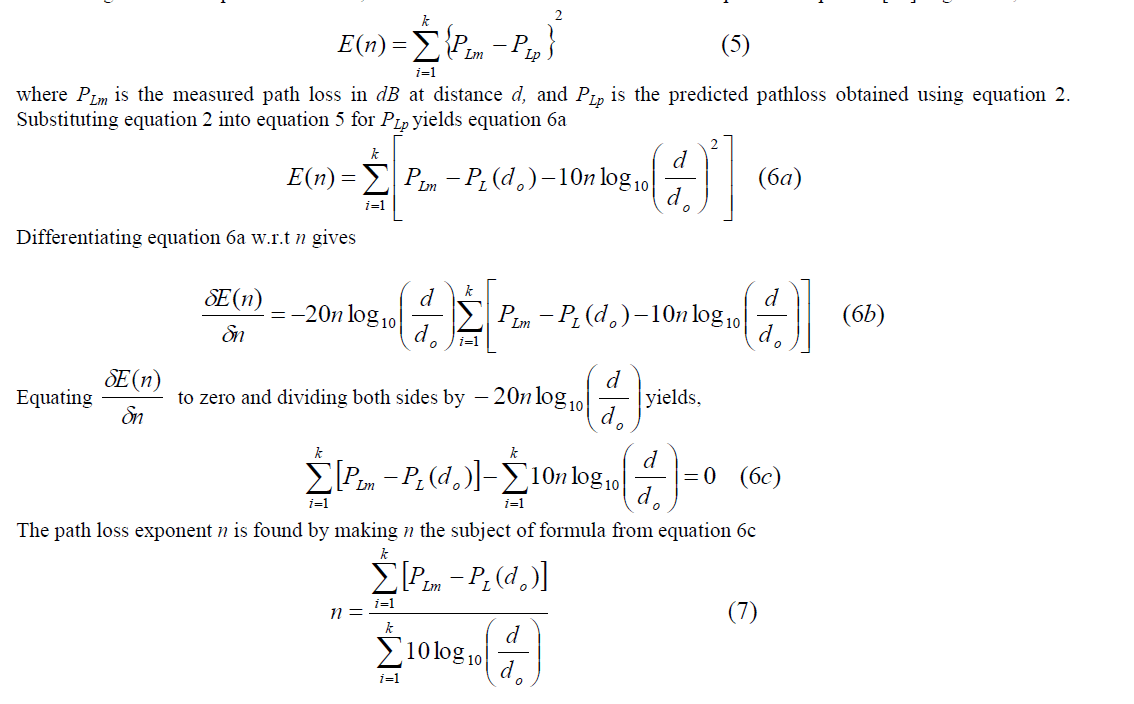
| With linear regression, the pathloss exponent can be determined from the measured pathloss and the predicted pathloss by minimizing in a mean square error sense, the difference between them. The sum of pathloss exponent [15] is given as; |
 |
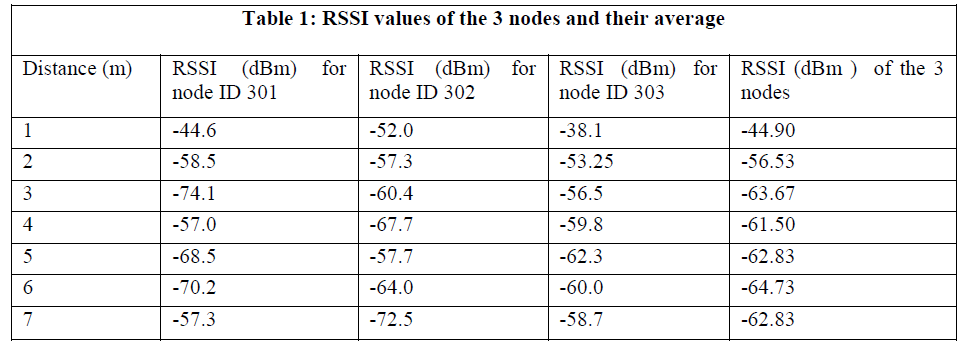
| Table 1 shows the mean of the RSSI values of the three sensor nodes and their average while table 2 shows the calculated path loss of the sensor nodes. |
 |
 |
IV. DATA ANALYSIS AND RESULT DISCUSSION |
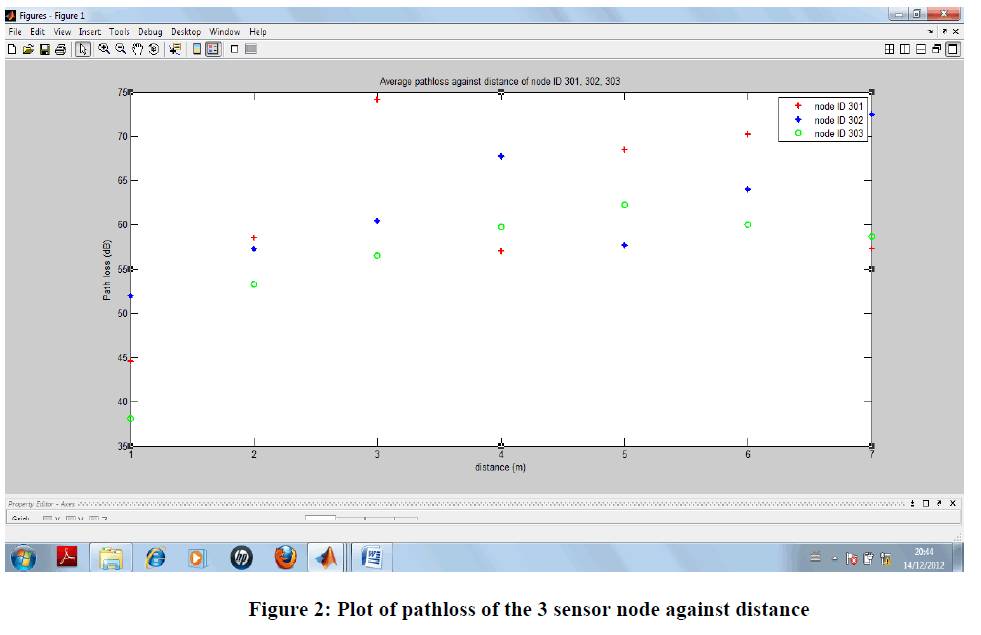
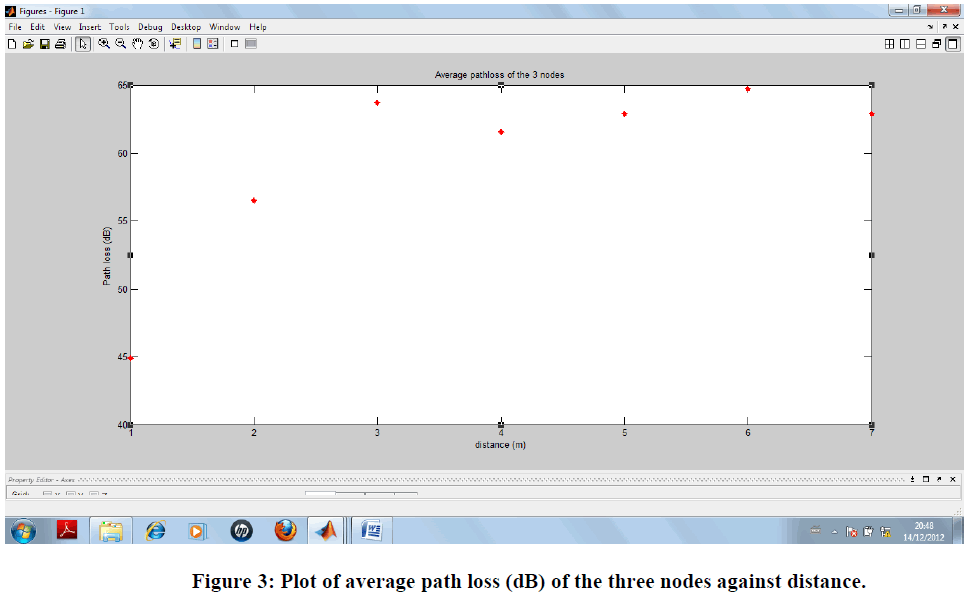
| The scatter plot of the path loss (dB) values of the three sensor nodes against distance (m) and also the average path loss (dB) of the three nodes against distance were shown in figures 2 and 3 respectively using Matlab software program. |
 |
 |
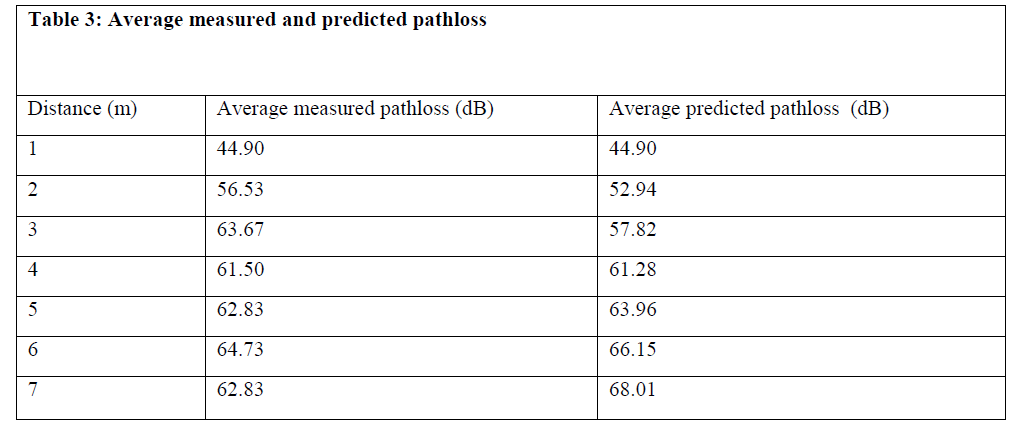
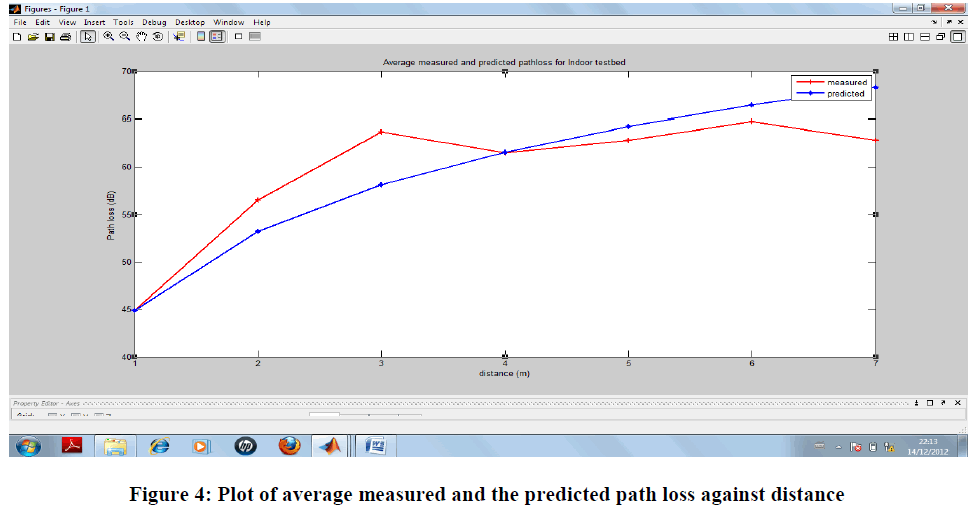
| Equation 7 was implemented using Matlab to calculate the path loss exponent as 2.77 for the testbed environment. The predicted path loss was calculated by implementing Equation 2 using Matlab. The measured path loss and the predicted path loss were plotted using Matlab software program to show the correlation between the values. Table 3 shows the values of the measured and predicted path loss against distance of the testbed environment. |
 |
 |
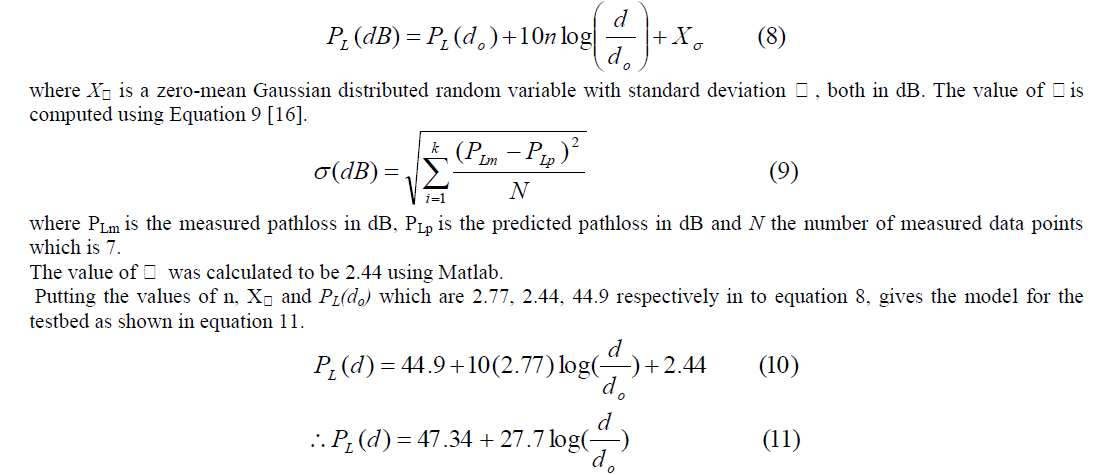
| Log-normal shadowing model was used to characterize the environment considering the fact that the surrounding environmental clutter may be vastly different at two different locations having the same transmitter-to-receiver (T-R) separation. This leads to measured signals which are vastly different from the average value predicted by equation 2. Measurements have shown that at any value of d the path loss PL(d) at a particular location is random and distributed lognormally about the mean distance as shown in Equation 8. |
 |
 |
V. CONCLUSION |
| In this work, WSN testbed using TelosB seansor nodes was built and the propagation channel of the testbed characterised. A pathloss model based on experimental data is developed for an indoor environment in Electronic and Computer Engineering, Nnamdi Azikiwe University, Awka. The path loss prediction parameters obtained using the log-normal shadowing model reveals that the path loss exponent value and the standard deviation caused by the shadowing effect are 2.77, 2.44dB respectively. This path loss exponent is therefore considered to be accurate since it falls within the stated range of values of pathloss exponent for indoor environment. |
| The pathloss model of the test environment developed was tested and the goodness of fit (R2) of the model showed that the model could be used to determine the pathloss of an environment with similar radio characteristics at known distances. It should be mentioned that measurements were performed in an indoor environment which is an empty corridor without serious obstacles. |
References |
|