Keywords
|
| Ultra High Frequency, Wireless, Gait, Instrument, Long range data transmission |
INTRODUCTION
|
| Gait may be defined as the walking pattern of an individual in a complex process controlled by interaction and coherence of the nervous and muscular systems. It is classified as either normal or pathological. Normal gait refers to the walking pattern of a subject who has got no neuromuscular disorder or articulate (joint) in their lower extremities, while the pathological gait refers to that of a subject with a disorder or handicap who responds to walking in an unconventional way. Quantitative evaluation of gait is currently limited by the availability and the size of motion analysis laboratories. Motion analysis laboratories are very expensive to maintain, and are typically found in hospitals in urban areas. Typically, patients can only walk about 7-10 meters per trial, and have one chance per trial to step on a disguised force plate [1] – [4]. Alternatively, many physicians and physical therapists rely instead on observational gait analysis to evaluate patients. While well-trained medical specialists are undoubtedly capable of discerning a great deal of information about their patients’ gait, small changes may be hard to detect and a qualitative observation is difficult to compare between office visits or by different specialists. Evaluation of common podiatric problems would be enhanced by an inexpensive method of quantitative evaluation. For instance, people with diabetes are often fitted with orthotics to improve their gait and reduce their chances of developing ulcerations on their feet; a straightforward and repeatable method of evaluating gait before and after use of an orthotic would be desirable to optimize its shape and placement. Various research works on the pathological gait monitoring instrumentation system have shown that the limitation of the system is the limited range of the walking distance of the patients [5] – [7]. Recent research has suggested that analysis of gait difficulties in Parkinson’s patients can be greatly enhanced by study of gait outside of the motion laboratories [8]. There is thus a need for a low-cost device that can meet the shortcomings of these current approaches, by providing quantitative and repeatable results with minimal imposition on the patient. In addition, there is a need for a device capable of monitoring gait over long period of time and at repeatable intervals in environments outside the clinical setting. |
| This paper presents the development and performance evaluation of a wireless Gait monitoring instrumentation system employing Ultra High Frequency UHF transmitter and receiver for long distance coverage over long period of time. The system was tested with a number of pathological patients in relative with normal subjects in form of graphical analysis of the data obtained at various intervals of time. The transmission data obtained were compared with some available existing data. |
METHODOLOGY (GAIT MONITORING INSTRUMENTATION SYSTEM
|
| The Gait Monitoring System (GMS), as a telemetry system, is designed as two major units based on the physical separation produced by radio links between the two end units, namely; the mobile transmitting unit and the stationary receiving unit. The mobile transmitting end is the portable part of the system, which is carried on the body of the subject during gait monitoring and the receiving end is the unit where analysis of the gaits parameters received are been carried out. Figure 1 is the schematic diagram describing the features of the gait monitoring instrumentation system [1]. The measurable quantity of the system is the ground-foot force that is exerted on the floor during walking. This can be described by kinematics based on the Newtonian equations that relates the resultant force on a body segment to its acceleration and its mass m; and are used in studying gait when the temporal factors like (i) step length (ii) stride-length and (iii) the velocity of motion are known [1] – [9]. The transduction is done using flexi-force sensors A201affixed to the sole of flat-soled sport shoes. This unit consists of a pair of instrumented shoes, signal pre-processing circuit and an FM transmitter (which constituted a transmitting unit). The signal preprocessing elements consists of a high slew rate, wide bandwidth, single supply operational amplifier (LM324) which amplifies and filters the transducer’s output signal and a 40-pin 8-bit RISC Flash-based Microcontrollers (PIC16F877A) with Universal Synchronous Asynchronous Receiver Transmitter (USART), and Analog to Digital (A/D) Converter and Pulse Width Modulation modules [9], [10]. |
| The receiving unit, which is the stationary part of the system, is composed of two main components: FM Receiver, and MAX 232 which is a product of Texas Instruments. It is a standard serial interface, a dual driver and receiver and Digital Interface Module with USB port. The FM receiver forms the front-end of the receiving unit. The MAX 232 has two drivers and two receivers that include a capacitive voltage regulator to supply EIA-232 voltage levels from a single 5V supply. It converts EIA 232 inputs to 5V TTL/CMOS level, and operates up to 120kbits per second; the output of MAX 232 via T1 of pin 14 was connected to the USB port of a Personal Computer (PC) for further analysis. The computer does the rest of the data manipulation (data analysis and data presentation). This is made possible through software developed to perform the processes. These units comprising the telemetry system are described in detail under the appropriate headings. |
A. Mode of Operation of the Transmitting Unit
|
| The sensors resistance of the improvised shoes changes with applied force and change in resistance is transformed into voltage by the voltage-divider network. The output of the dividing network is fed into the input of the buffer Operational Amplifier Circuit. The output of the buffer is fed into the microcontroller where the signal is now converted into digital form, pre-processed and sent to FM transmitter for broadcasting. |
B. The Improvised Instrumented Shoes
|
| The flexi-force sensor (A201) is an ultra-thin and flexible printed circuit that can measure force between almost any two surfaces and is durable enough to stand up to most environments. It has better force sensing properties, linearity, hysteresis, drift, and temperature sensitivity than any other thin-film force sensors. The sensors are constructed of two layers of substrate. This substrate is composed of polyester film. The silver circle on top of the pressure-sensitive ink defines the “active sensing area.” The “active sensing area” is 0.945cm diameter at the end of the sensor. In order to measure forces above 45.36kg, a lower drive voltage is applied and the resistance of the feedback resistor is reduced (1kΩ minimum.). The sensors act as variable resistors in an electrical circuit. When a sensor is unloaded, its resistance is high (about 8kΩ) when a force is applied to the sensor, the resistance decreases proportionately with the loading. Flexi-force sensors are terminated with a solder able male square pin connector, which allows them to be incorporated into a circuit. Connecting an ohmmeter to the outer pins of the sensor connector and applying a force in the sensing area can read the change in resistance. A means of calibration was then established to convert the output into appropriate engineering units. Depending on the setup, an adjustment could then be done to increase or decrease the sensitivity of the sensor. The circuit used is a non-inverting operational amplifier arrangement to produce an analog output based on the sensor resistance and a fixed reference resistance (RF). An analog-to-digital converter can be used to change the voltage into a digital output. The sensitivity of the sensor could be adjusted by changing the reference resistance (RF); a lower reference resistance will make the sensor less sensitive, and increase its active force range. The leads of the transducer were fasten to the sides of the shoes and connected to the operational amplifier circuit. Figure 1 also shows the placement of the sensors on the shoes. |
C. Functional Description of the Transmitter
|
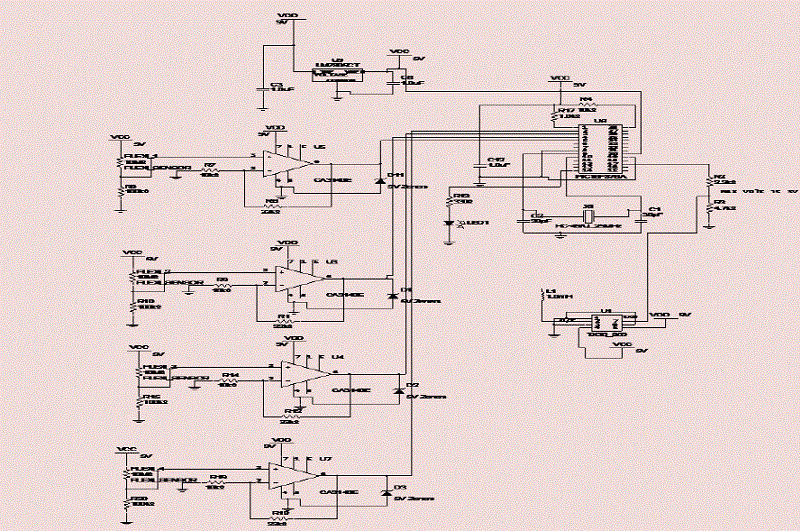
| The TX3B transmitter module is a two-stage, surface acoustic wave (SAW) controlled FM transmitter between 2V and 12V and is available in 869.85MHz. The TX3B module delivers nominally +9dBm from a 5V supply at 12mA. The module measures 32x12x3.8mm. It is fed directly from the output of the PIC microcontroller. A whip antenna is connected to the output pin of the TX3B transmitter used; the antenna is integrated into the mobile end unit. Figure 2 shows the circuit diagram of the 869.85 MHz Transmitter employed [11] – [14]. |

Fig. 1: Block diagram of the gait monitoring system |

Fig. 2: Circuit Diagram of Mobile Transmitting Unit |
D. Functional Description of the Receiver
|
| The RX3A module is a double conversion FM superhet receiver capable of handling data rates up to 160kbps. The safety integrity level (SIL) style RX2 receiver measures 48 x 17.5 x 4.5mm. it operates from a supply of 3V to 6V and draws 14mA when receiving. A fast-acting carrier detects and a power-up enable time of less than 1ms. This allows effective duty cycle power saving and a -107 dBm sensitivity. This combined with a SAW front-end filter results in an excellent RF performance and electromagnetic compatibility (EMC) conformance. The internal and external photograph of the constructed receiving unit is shown in figure 3 [11] – [14]. |

Fig. 3: Circuit diagram of the receiving Unit |
E. The Antenna`
|
| Three types of integral antennas are recommended and approved for use with the transmitting and receiving modules, namely: Helical antenna, Loop antenna and Whip antenna. Among the three antennas, Whip antenna is preferred as it is a high Q antenna characterized by very small size, good ultimate performance, excellent ease of design set-up, good immunity to proximity effects; with about 700m coverage range on open ground [9]. Whip antenna is made up of enameled copper wire (4 mm diameter former), connected directly to pin 2 of the transmitting module and pin 1 of the receiving module, open circuit at other ends. This antenna is very efficient given its small size (20mm x 4mm diameter). |
F. Firmware Development
|
| The firmware development is one of the major tasks in the design of this device. The basic procedure adopted in the design is explained in Figure 4. |

Fig. 4: The firmware design |
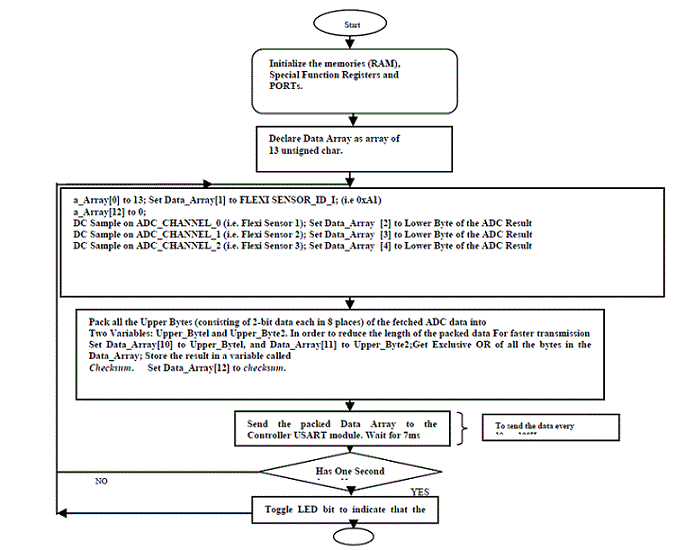
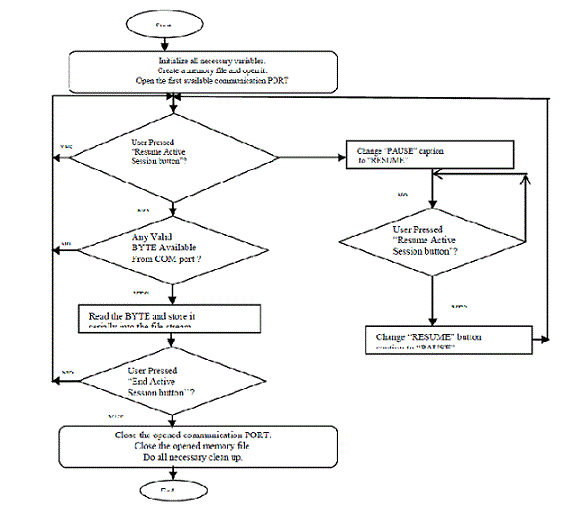
| MPLAB IDE is a “wrapper” that coordinates all the tools from a single graphical user interface, usually automatically. For instance, once code is written, it can be converted to executable instructions and downloaded into a microcontroller to see how it works. In this process multiple tools are needed: an editor to write the code, a project manager to organize files and settings, a compiler or assembler to convert the sources code to machine code and some sort of hardware or software that either connects to a target microcontroller or simulates the operation of a microcontroller. Once the hardware is in a prototype stage, a hardware debugger, such as MPLAB ICE 2000 in circuit emulator, MPLAB REAL ICE in-circuit emulator, or MPLAB ICD 2 in-circuit debugger can be used. These debug tools run the code in real time on the actual application. The MPLAB ICE 2000 emulator was used in this case and it physically replaces the microcontroller in the target using a high-speed probe to give us full control over the hardware in our design. The MPLAB REAL ICE emulator an MPLAB ICD 2 debugger use special circuitry built into many Microchip MCUs with Flash program memory and can “see into” the target microcontrollers program and data memory. These debuggers can stop and start program execution, allowing one to test the code with the microcontroller in place on the application. After the application is running correctly, one can program a microcontroller with one of Microchip’s device programmers, such as PICSTART Plus or MPLAB PM3. These programmers verify that the finished code runs as designed. The flowcharts in figures 5 and 6 show the step to step procedure of how data is fetched from the sensors, transmitted and how it can be captured for easy reading of the gait measurement and proper documentation |
EXPERIMENTAL SET-UP AND MEASUREMENTS
|
A. Gait Monitoring Accessories
|
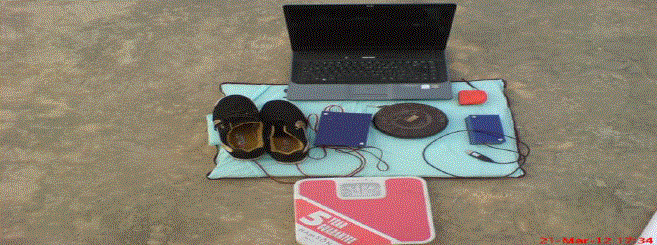
| The complete Gait Monitoring accessories are shown in the figure 7. The whole device consists of Thin film sensors embedded inside the instrumented shoes as part of the mobile transmitting end, the receiving end connected to the personal computer (PC) for analysis and storage of patients’ information. |
B. Measurement and Analysis of Gait Data
|
| A subject without any known physical disabilities was selected for the test. The subject was made to wear the instrumented shoes and made to walk with it. The data is acquired through the USB port and the data analysis was done on the computer. The kinetic data for each sensor were transformed to the frequency domain through Discrete Fourier Transforms. The measurement method involves the subject putting on the instrumented shoes and attaching the mobile transmitting-end around the waist or holding it such that the subject’s normal walking pattern was not affected, as shown in figures 8 and 9. This is done using the straps on the case of mobile transmitting-end to fasten it to the waist of the subject. Before acquiring data from a subject, the sensors offset was be fetched. This is done by clicking “Get Sensor Offset” in the data capturing dialog box. This is necessary for soft nulling of the Op-Amp Offset and variation in sensor resistance due to environmental factor. The subject was then asked to stand erect and to remain in this posture for some time. |
| After this initial measurement and activation of the gait, the subject was then asked to start walking at normal walking speed (on a flat floor i.e. free walking speed as shown in figures 8 and 9). This subject was allowed to continue to walk with instrument on, so as to get accustomed to the instrument such that the measurement is taken at the subjects steady state, and at the time when the subject is unaware. This greatly helped to overcome the psychological effect of the instrument on the subject. With the capacity of the available computer, each run of this measurement cycle was stored in the computer memory-along with the subject’s identification data, which are stored in the computer memory-along with the subject’s identification data, which are taken before the test, including the subject name, weight, height and sex. Almost immediately after the test run, the outline of the foot forces is displayed for each of the foot sensors for visual observation of the subject’s gait. This was followed by further analysis of the acquired data. |
RESULTS AND DISCUSSION
|
| Data gathered from different subjects were run with the developed software and interpreted for making useful decisions. This format is developed both for normal and impaired subjects for conscious and unconscious gait moments. The application software employs Direct Plotting and Fast Fourier Transform (FFT) for frequency (or Harmonic) analysis, and Peak values, RMS Values and the Cadence Frequencies are recorded and stored for future purpose which is one of the major contributions of this study. However, this analysis requires a consideration of time but it provides accurate information. In order to interpret result, it is usually necessary to provide further computations, which estimate the parameters of interest or the parameters that describe the physical process being measured. This helps to provide analytical solutions that help in the evaluation of the test procedures to guide in making useful decision. In the computation of the various parameters, scaling of the raw data is more generally necessary since a large volume of data and problems of discontinuities are usually encountered. Since the data processing will have to do more than just plotting general or specialized subroutines (functions) and computer programs were written to achieve these desired objectives. Apart from the scaling, other operating that is usually performed on the data is Fast Fourier Transform (FFT) for frequency (or harmonic) analysis. Frequency analysis is a very important operation in data processing, which provides information about the significant frequencies contained in the data. This analysis required a considerable amount of computer time but provides accurate information relatively easily. |
| The result obtained from the experiments show the peak value, the root mean square (RMS) value, and the mean frequency of each sensor for both right and left legs. Also the software was configured in a way that all the corresponding values show clearly on the screen. The corresponding waveform of each sensor can be viewed clearly in either Amplitude-Time Plot or Amplitude Frequency Plot (using FFT). Figures 10, 11, and 12 show the samples of the waveform of the ground reaction force of normal subjects in amplitude-time and amplitude-frequency waveform mode for both right and left leg. Each waveform shows the effects of pressure in each sensor attached to the specific points where the ground reaction force can be measured e.g. heel, metatarsals etc. It would be observed that the spectrum is highly weighted around zero frequency at some specific frequencies. It would also be observed that the magnitudes of some frequency components are small. The normal human walking speed is about 1Hz i.e. completes a gait cycle in about 1.02s. The harmonic spectrum of the ground reaction force (GRF), after being filtered using a 10Hz cut-off frequency digital filter, can be used to represent the gait waveform. This further confirms that the frequencies of comparative magnitude in the normal gait are less than 10Hz. The major limitation of the previous systems is the data transfer rate, which is done through the serial port. This greatly reduces the speed of data acquisition and processing. Sometimes, this introduces delay in data acquisition into the system: this therefore causes occasional frequency is the gait waveform. This limitation was moderated by employing a USB port instead of a serial port. The results of the measurements carried by the system correlated very well with the existing data available in the literature. |

Fig. 5: Data fetching and transmission flowchart |

Fig. 6: Data capturing flowchart |

Fig. 7: The complete gait monitoring instrumentation |

Fig. 8: Data measurement of impaired subjects with the mobile transmitter |

Fig. 9: Data measurement of normal subjects with the mobile transmitter |

(a) : Sample of graph obtained using Amplitude-Time plot on an impaired subject (left leg) |

(b): Sample of graph obtained using Amplitude-Time plot on an impaired subject (right leg) |
Fig. 10: Sample of graph obtained using Amplitude-Time plot on an impaired subject
(a) : Sample of graph obtained using Amplitude-Time plot on a normal subject (left leg) |
 |
| (b): Sample of graph obtained using Amplitude-Time plot on a normal subject (right leg) |
Fig. 11: Sample of graph obtained using Amplitude-Time plot on a normal subject
(a) : Sample of graph obtained using Amplitude-Frequency plot on an impaired subject (left leg) |

(b) : Sample of graph obtained using Amplitude-Frequency plot on a normal subject (left leg) Fig. 12: Sample of graph obtained using Amplitude-Frequency plot on an impaired subject and a normal subject |
CONCLUSION
|
| A Computer-based gait monitoring instrumentation system to determine gait asymmetry was constructed and tested. The system consists of two parts; the lightweight battery to power mobile transmitting unit; and a stationary data processing and receiving end. The mobile part consists of an improvised instrumented pair of shoes - an important part in the force signal transductions connected to a signal processing circuit whose output modulates an FM transmitter. The instrumented shoes are made by affixing removable force sensors to the heel and the metatarsal parts of the sole of the shoes (improvised shoes to remove the limitation of fixed size shoe). The radio link between the mobile part and the stationary processing ends helps to overcome a lot of problems common to most gait monitoring equipment; this includes the psychological restraints on the subject. The radio link unit also provides a means of continuous monitoring of the gait data, and more importantly, it provides necessary electrical isolation in the system; thus preventing case of electrical shocks. The gait monitoring system integrates the data acquisition, analysis and visual presentation. The gait data can be analyzed in either Amplitude-Frequency plot or Amplitude-Time plot. The data transfer mode is fast and accurate. The test and measurement taken with the system showed that the system can be used as research and clinical tools. |
| The results obtained show that qualitative visual observation could not detect any improvement on the gait of the sampled pathological patients after a week but quantitative observation with the developed device revealed improvement or otherwise, though minute, on the gait of the patients. This is evident by the slight increase in the peak voltage of the patients’ gait, hence the adequacy and necessity of the research in monitoring human gait is juxtaposed. |
ACKNOWLEDGMENT`
|
| The authors sincerely appreciate the contribution of the Communication Physics Research Group of Ladoke Akintola University of Technology, Ogbomoso, Nigeria for their support during data collection. Also, special thanks go to the Applied Research Institute, Osogbo, Nigeria for assistance during construction, the public and private hospitals who released their patients during data capturing. |
References
|
- Jacobs N.A, Skorecki J, and Chanley J (1972): Analysis of Vertical Components of Force in Normal and Pathological Gait, Journal of Biomechanics,Vol. 5, pp 11 – 34.
- Porter D. and Roberts V.C (1989): Review of Gait Assessment in the Lower Limb Amputee, Temporal and kinematic Analysis; ClinicalRehabilitation Center, Winnersh Triangle Wokingham, England, Vol. 3, pp 65 – 74.
- Smidt G.L. and Wardsworth J.B. (1973): Floor Reaction Force During Gait: Comparison of Patients with Hip Disease and Normal Subjects,Physical Therapy, Vol. 54 No. 1, pp 13 – 17.
- Brunnstornm Sigrie (1996): Clinical Kinesiology, Davis Company, 2nd Edition, USA, pp 18 – 72.
- Simkin A. and Stokes I.A.F(1982): Characterization of the Dynamic Vertical Force Distribution Under the Foot, Medical and Biological Engineeringand Computing, Vol. 20, pp 12 – 18.
- Chapman A.E, Morrison J.B and Hannah R.E (1984): Kinematic Symmetry of the Lower Limb, Article of Physics and Medical Rehabilitation, Vol.65, pp 155 – 158.
- Buraimoh-Igbo L.A., Olaogun M.O and Jubril A.M. (1997): Measurement of Ground Foot Reaction Force to Determine Gait Asymmetry UsingComputer-based telemetry System, Rehabilitation Research and development reports, Vol. 34, pp 53 – 55.
- Morris S. (2002) “Shoe-Integrated Sensor System for Wireless Gait Analysis and Real-Time Feedback,” PhD Thesis Proposal, Harvard/MITDivision of HealthSciences and Technology and MIT Media Laboratory, pp 10 – 32.
- Paradiso J.A, Hsiao K , Benbasat A.Y and Teegarden Z. (2000): “Design and implementation of expressive footwear,” IBM Systems Journal, 39:3,pp. 511–519.
- Advance Mechanical Technology Inc. (1984): AMTI Biomechanics Newsletter, Vol. 2. Microchip Technology Inc. (2001): PIC 16F87XA DataSheet, Microchip Technology Inc. U.S.A., pp 1 – 17.
- Motorola Inc (1996): Motorola Analog IC Device data. http://www.mpicmotorola.co.uk/products/tx2r2.html
- National Instruments (1996): Data Acquisition (DAQ) Fundamentals, National Instruments Application Note 007, 1996.
- http://www.tekscan.com/fexiforce/specs_elf.html
- http://www.radiometrix.co.uk/products/tx2r2.html
|