Keywords
|
| Femtocell, WiMAX, CINR, LIF scheme |
INTRODUCTION
|
| The main problem continued microization of cellular networks is that the network infrastructure for doing so is expensive. A recent development are femtocells, also called home base-stations, which are short range, low cost and low power base-stations, installed by the consumer for better indoor voice and data reception. The user-installed device communicates with the cellular network over a broadband connection such as DSL, cable modem, or a separate RF backhaul channel. While conventional approaches require dual-mode handsets to deliver both in-home and mobile services, an in-home femtocell deployment promises fixed mobile convergence with existing handsets. Compared to other techniques for increasing system capacity, such as distributed antenna systems and microcells, the key advantage of femtocells is that there is very little upfront cost to the service provider. |
PROPOSED SYSTEM
|
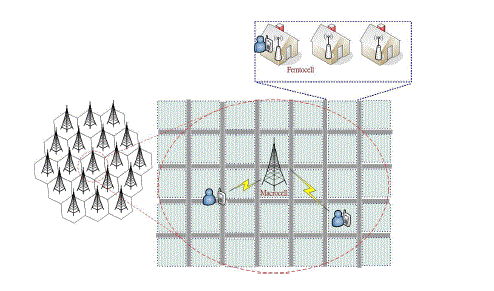
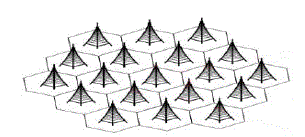
| We consider a 19-macrocell structure in a suburban area, where the coverage of each macrocell is approximated by a hexagon. The reason that a 19-macro cell structure is chosen is because the co-channel interference from macrocells beyond two tiers is negligible. Since I focus on the user CINR in a typical macrocell (the center macrocell in Figure 1), so can disregard macrocells that are three or more tiers away. |
| In the suburban area, streets form a grid structure and run in the north-south or east-west direction. Houses are situated in Fig. 3.1. Femtocell architecture. The square blocks separated by streets. There are 100 houses within each block. Some houses have femtocell base stations installed, some have not. Whether a house has femtocell base station or not follows a uniform probability distribution. The mean of the uniform distribution is also called the femtocell density. Users are randomly placed in the area. A user may be inside the house (indoors) or on the street (outdoors). A user may communicate with the macrocell base station or the femtocell base station, depending on the received signal strength. The CINR is calculated by considering interference from the other 18 macrocells and nearby femtocell base stations. |
IMPLEMENTATION
|
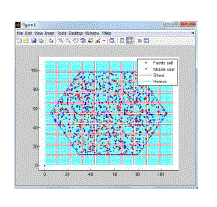
| In the suburban area, streets form a grid structure and run in the north-south or east-west direction. Houses are situated in Fig. 3.1. 19 cell Hexagon Architecture. The square blocks separated by streets. There are 100 houses within each block. Users are randomly placed in the area. A user may be inside the house (indoors) or on the street (outdoors). A user may communicate with the macrocell base station or the femtocell base station, depending on the received signal strength. The CINR is calculated by considering interference from the other 18 macrocells and nearby femtocell base stations. |
| System parameters |
| The WiMAX system parameters and OFDMA parameters are chosen based on the IEEE802.16m Evaluation Methodology Document (EMD) and IEEE802.16-2004. Femtocell base stations will be deployed in a great quantity. However, it is not necessary to calculate the interferences from all femtocells to a user because femtocell base station is a low power home device. Given the femtocell transmit power (0.01W) in Table 1, a femtocell base station that is 200 meter away will cause interference at least 30dB below the receiver sensitivity. Therefore, when calculating the interference from femtocells, I ignore the interference from femtocells that are at least 200 meters away. |
| The block, house and street |
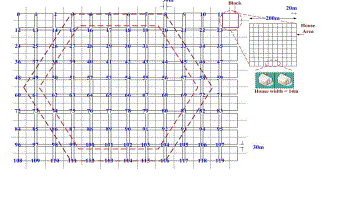
| In Figure 3.1 shows the relationship among houses, blocks and streets. Each side of a square block is 200 meter long and 100 houses are located within each block. |
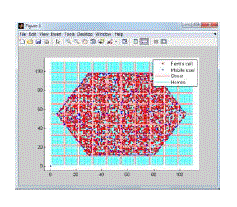
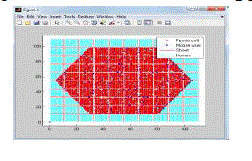
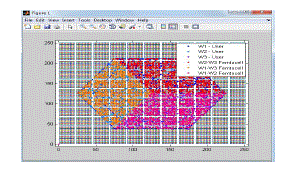
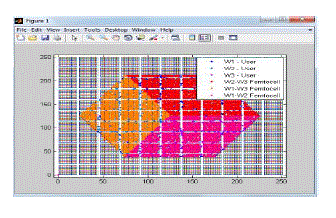
| A house occupies a 14x14 meter square area, centering within a 20x20 meter square land. Therefore the distance between two neighboring houses in the same block is 6 meters. The width of the street is assumed to be 30 meters. To speed up the simulation, only consider users located in the center macrocell in Figure 3.1 (also the inner hexagon in Figure 3.2). The other 18 macrocells are mainly used for calculating the interference to the users in the centre macrocells. Besides interferences from other macrocells, there are also interferences from nearby femtocells. In order to calculate femtocell interferences to users at the edge of the centre macrocell, the exact distribution of femtocells in neighbour macrocells needs to be taken into consideration. When the femtocell transmission range is set at 30 meters (Table 6.1), I have said that, only need to consider the interference caused by the femtocell base stations within the 200- meter distance because the femtocell transmission power is small. As a result, in our study, we don’t have to book keep all femtocells in neighbour macrocells. We only have to consider femtocells in the outer hexagon, which extends 200 meters outward from the inner hexagon, in Figure 3.2. |
| The femtocell base station is assumed to be placed in the middle of a house. Whether a house will have a femto BS or not is determined randomly according to the desired femtocell density. Since there are 100 houses in each block, if the density is 0.1, there will be about 10 houses with femtocell BS installed in each block. |
| 3.3. Frequency Reuse |
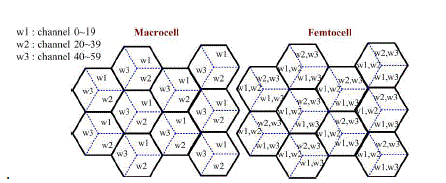
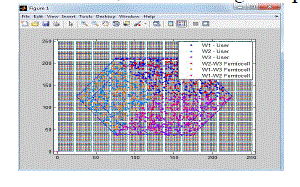
| Femtocell is deployed within the coverage of a macrocell and it is also within the interference range of several neighbouring macrocells and femtocells, it should try to avoid using the same frequency channels as those used by neighbour cells. On the other hand, there are limited frequency channels for the wireless communication system. Frequency reuse with minimized co-channel interference is common practice to increase the system capacity. In this study, I consider the (1, 3, 3) frequency reuse pattern for the macrocell. If a sector is allocated the w1 group, then the femtocells within this sector will be allocated channels from the w2 and w3 groups to reduce the co-channel interference |
| 3.4. Path loss model |
| The IEEE 802.16m EMD document has specified system models and parameters for researchers/engineers to evaluate the system performance on the same ground. The EMD includes outdoors, indoors, indoor to outdoor, and outdoor to indoor propagation models. In our suburban femtocell model, depending whether the user is indoors or outdoors, and whether it will connect to macrocell BS or femtocell BS, the following four path loss models are used. |
| 3.5. Received Signal Quality Evaluation |
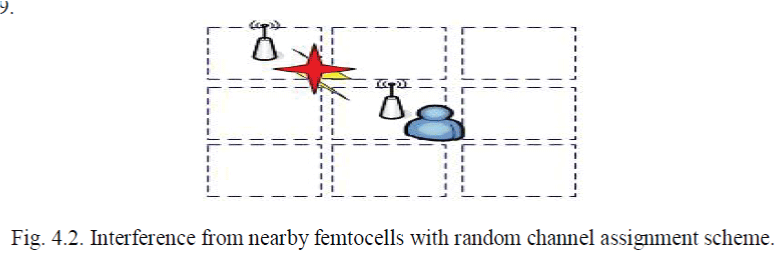
| The user may be inside or outside the house. First decide whether the user should connect to the macrocell BS or femtocell BS by comparing the received signal strength (RSS) from the macrocell BS and the RSS from the nearest femtocell BS. Once the BS is determined and the channel is selected, we then calculate the co-channel interference from the other 18 macrocells and surrounding femtocells to derive the CINR. For each femtocell density, 10 random femtocell placements are simulated, each with the random user placement being repeated for 3000 times. Under the (1,3,3) channel reuse assumption.C, a femtocell is allowed to use a particular group of channels based on its location. However, which channel from the pool of available channels to use might have significant performance ramification. |
RESULTS AND DISCUSSIONS
|
| The only channel assignment requirement is to make sure that any two users in the same macrocells do not use the same channels. In the following, we compare the random channel assignment and LIF channel assignment for femtocell users in terms of the average CINR and probability that an arbitrary user will connect to the femtocell. Primarily used channel assignment strategy is Random Channel assignment. |
| 4.1. Random channel Assignment Strategy |
| Table 4.1 shows the average CINR and the probability that an arbitrary user will choose to connect to the femtocell.. In the environment without the femtocell base station, the average CINR is 15.32dB. When the femtocell density is 0.1, 0.5, and 0.9, the average CINR improves by approximately 1.3dB, 7dB, and 12 dB, respectively. |
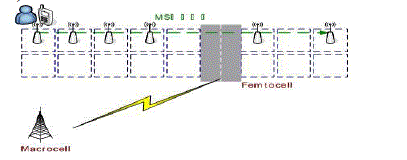
| In Figure 4.1, it is assumed that an MS moves in and out of 5 lands/houses, crosses a street, and in and out of 3 lands/houses, from left to right. The total moving distance is 190m and the distance from the macrocell BS is roughly 780m. Will calculate the received CINRs with respect to the serving macrocell and femtocell . as the MS moves and plot the stronger of the two CINR in Figure 4.3. The stronger CINRs (in the 50-60dB range) occur mostly when the MS is indoors. The MS connects to the femtocell BS in this case. As the MS moves out of the house, the femtocell BS signal attenuates severely through the wall so that the MS will pick up the stronger signal (roughly 10dB in CINR) from the Macrocell BS and thus choose to connect to macrocell BS. Inside a house without the femtocell BS, the MS also receives stronger CINR (around 2dB) from the macrocell BS than that from the next-door femtocell BS. |
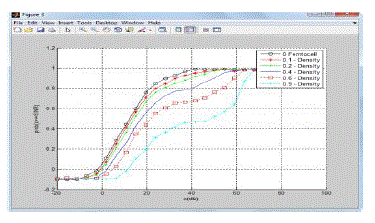
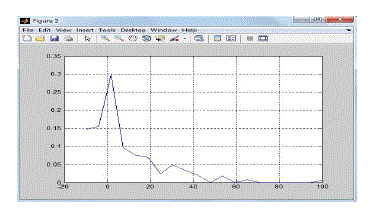
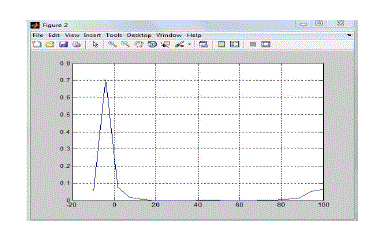
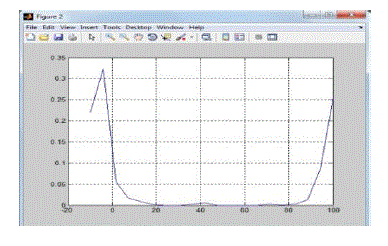
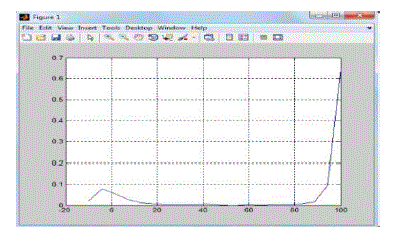
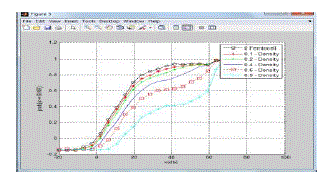
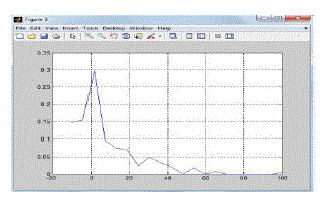
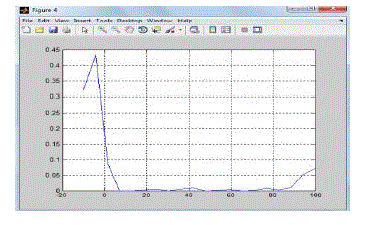
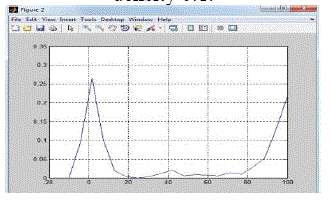
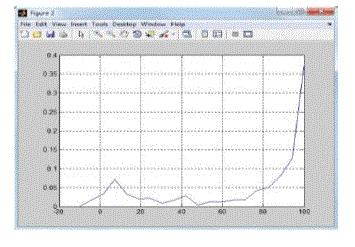
| Figure 4.3 plots the cumulative distribution function (CDF) of the CINR. It can be seen that as more femtocells are deployed, the probability of getting high CINR (larger than 50 dB) becomes higher. On the other hand, if observe the low 5 percentile, it is found that only roughly 1dB and 2dB improvement for femtocell density at 0.5 and 0.9, respectively. Figure 4.4, 4.5, 4.6 and 4.7 shows the CINR probability density function (pdf) for femtocell density=0, 0.1, 0.5, and 0.9. |
| As the femtocell density increases, the CINR PDF slowly transforms from a single mode (single peak) distribution to a dual-mode (dual-peak) distribution. The CINR is between -5dB and 60dB. As more femtocells are deployed, more indoor users may connect to femtocell BS. When a user connects to the femtocell BS via the line-of-sight (LOS) path, the CINR will lie between 50 to 62 dB. |
| 4.2. LIF Channel Assignment |
| Table 7.2 shows the average CINR and the probability that an arbitrary user will choose to connect to the femtocell when the LIF mechanism is used. when the density of the femtocell base station becomes higher, the probability of connecting to a femtocell becomes higher, and the system average CINR improves more. When the femtocell density is 0.1, 0.5, and 0.9, the average CINR improves by 1.5dB, 7.5dB, and 14.5dB, respectively. |
| The LIF scheme improves the average CINR by up to 2dB (at femtocell density=0.9). This is not a great deal of improvement by considering the amount of extra effort needed for the LIF to work. Figure 7.8 is the CDF of CINR when the femtocell uses the LIF channel assignment scheme. It is very similar to the CDF in Figure 7.3. |
| If carefully compare the PDF curves of CINR shown in Figures 4.9 to 4.12 for the LIF scheme with Figures 4.3 to 4.6 for the random scheme, though they look quite similar, but there is a distinct difference. The spike at -5dB in Figure 4.7 no longer appears in Figure 4.12. |
CONCLUSION
|
| Femtocells are going to be upcoming technology in telecommunication industry; in this project I have proposed a suburban femtocell model that is suitable for evaluating the CINR improvement when femtocell base stations are deployed in a WiMAX network. With the model, we can quantify how CINR is improved as different densities of femtocells are deployed. The major benefit of deploying femtocells is in its improvement of the indoor users CINR to the 50-60dB range. As more femtocells are deployed, more indoor users connect to the femtocell instead of the macro cell, greatly increasing the average CINR. The LIF (Least-Interfered-First) channel assignment scheme can effectively the co-channel interference between nearby femtocells. |
| |
Tables at a glance
|
 |
 |
 |
 |
| Table 3.1 |
Table 3.2 |
Table 4.1 |
Table 4.2 |
|
| |
Figures at a glance
|
 |
 |
 |
 |
 |
| Figure 2.1 |
Figure 3.1 |
Figure 3.2 |
Figure 3.3 |
Figure 3.4 |
 |
 |
 |
 |
 |
| Figure 3.5 |
Figure 3.6 |
Figure 3.7 |
Figure 3.8 |
Figure 3.9 |
 |
 |
 |
 |
 |
| Figure 4.1 |
Figure 4.2 |
Figure 4.3 |
Figure 4.4 |
Figure 4.5 |
 |
 |
 |
 |
 |
| Figure 4.6 |
Figure 4.7 |
Figure 4.8 |
Figure 4.9 |
Figure 4.10 |
 |
 |
| Figure 4.11 |
Figure 4.12 |
|
| |
References
|
- Performance of macro and co-channel femtocells in hierarchical cell structure by Holger Claussen Bell Laboratories, Alcatel-Lucent Swindon, United Kingdom
- Self-optimization of Coverage for Femtocell Deployments by Holger Claussen, Lester T. W. Ho, Louis G. Samuel Bell Laboratories, Alcatel- Lucent, Swindon,
- Throughput Enhancement of Macro and Femto Networks By Frequency Reuse by Tae-Hwan Kim and Tae-Jin Lee School of and Engineeringm Sungkyunkwan University, Suwon, South Korea
- Uplink Capacity and Interference Avoidance for Two-Tier Femtocell Networks by Vikram Chandrasekhar and Jeffrey G. Andrews, Senior Member, IEEE
- WiMAX Femtocell: Requirements, Challenges, and Solutions by Ronny Yongho Kim and Jin Sam Kwak, LG Electronics, Inc. Kamran Etemad,
- Co-channel co-existence study of outdoor macrocell and indoor femtocell users by Pekka Pirinen, Centre for Wireless Communications P.O. Box 4500, FI-90014 University of Oulu Oulu, Finland
|