Keywords
|
| Attribute charts, p -chart, CUSUM, fuzzy α cut and α –level fuzzy mid range |
I. INTRODUCTION
|
| Statistical Process Control (SPC) is used to monitor the process stability which ensures the predictability of the process. The power of control charts lies in their ability to detect process shift and to identify abnormal conditions in the process. In 1924, Walter Shewhart designed the first control chart. According to him, if w be a sample statistic that measures some quality characteristic of interest the mean of w is w, and the standard deviation of w is w, then the center line (CL), the upper control limit (UCL) and the lower control limit (LCL) are defined as |
 |
| where d is the “distance” of the control limits from the center line, expressed in standard deviation units. A single measurable quality characteristic such as dimension, weight or volume is called a variable. In such cases, control charts for variables are used to monitor the process. These include the X-chart for controlling the process average and the R -chart (or S -chart) for controlling the process variability. For the quality-related characteristics such as characteristics for appearance, softness, color, taste, etc., attribute control charts such as p-chart, c-chart are used to monitor the production process. Sometimes the product units are classified as either "conforming" or "nonconforming", depending upon whether or not product units meet some specifications. The p -chart is used to monitor the process based upon the fraction of non conforming units. |
| Many quality characteristics cannot be conveniently represented numerically. In such cases we usually classify each item inspected as either conforming or non conforming to the specifications on that quality characteristics. Numerical |
| Example: |
| In practice, one may classify each item in more than two categories such as "bad", "medium", "good", and "excellent”. On a production line, a visual control of the particular product might have the following assessment possibilities |
| 1. "Reject" if the product does not work;. |
| 2. "Poor quality" if the product works but has some defects; |
| 3. "Medium quality" if the product works and has no defects, but it has some aesthetic flaws; |
| 4. "Good quality" if the product works and has no defects, but has few aesthetic flaws; |
| 5. "Excellent quality" if the product works and has neither defects nor aesthetic flaws of any kind. |
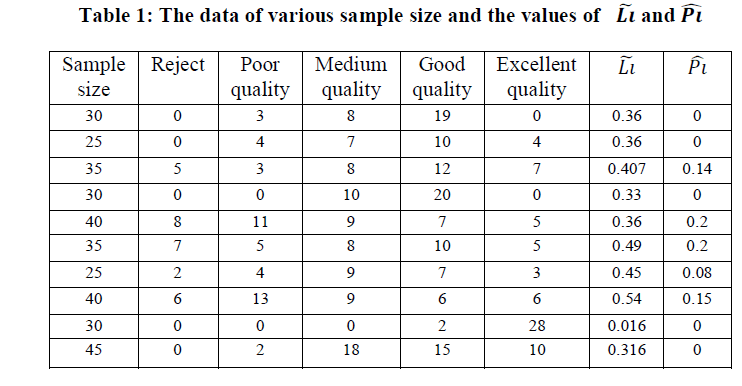
| To monitor the quality of this product, 10 samples of different sizes are selected. The degrees of membership for the above assessment are taken as 1, 0.75, 0.5, 0.25 and 0 respectively. The data with and piˆ are given in Table –1. |
 |
 |
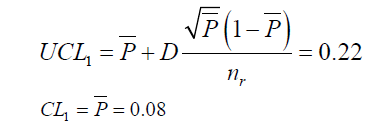
| For sample 1: |
 |
 |
| The chart given below depicts the conventional p – chart for 10 samples |
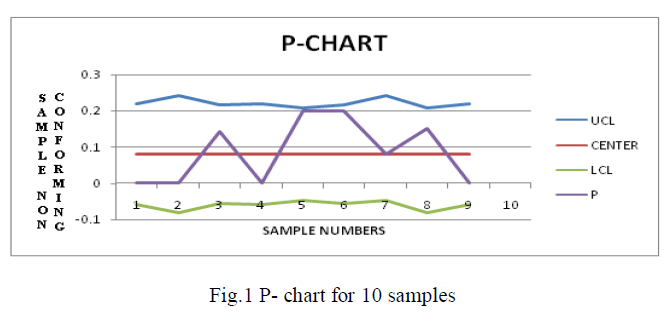 |
| In fig.1 out of control signal is not seen corresponding to the 10 samples. So the process is under control |
II. CUSUM CHART
|
| The cusum chart directly incorporates all the information in the sequence of sample values by plotting the cumulative sums of the deviations of the sample values from a target value. For example, suppose that samples of size n 1 are connected, and j x is the average of the jth sample. Then if 0 is the target for the process mean, the cumulative sum control chart is formed by plotting the quantity |
 |
| Against the sample i. i C is called the cumulative sum up to and including the ith sample. Because they combine information from several samples, cumulative sum charts are more effective than Shewhart charts for detecting small process shifts. Cumulative sum control charts were first proposed by Page (1954) and have been studied by many authors; in particular, see Ewan (1963), Page (1961), Gan (1991), Lucas (1976), Hawkins (1981) (1993a), and Woodall and Adams (1993). In this section we concentrate on the cumulative sum chart for the process mean. It is possible to devise cumulative sum procedures for other variables, such as Poisson and binomial variables for modeling nonconformities and process fallout. We will show subsequently how the cusum can be used for monitoring process variability. |
 |
 |
 |
III. RESULT
|
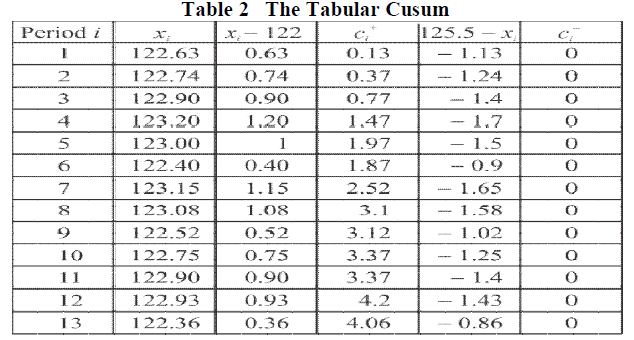
| The cusum calculations in table 2 show that the upper side cusum at period 15 is c+15=5.76 Since this is the first period at which c+i > H=5we would conclude that the process is out of control at that point |
IV. FUZZY X CONTROL CHART BASED ON STANDARD DEVIATION
|
 |
| Where j S is the standard deviation of sample j and S is the average of ' j S s . |
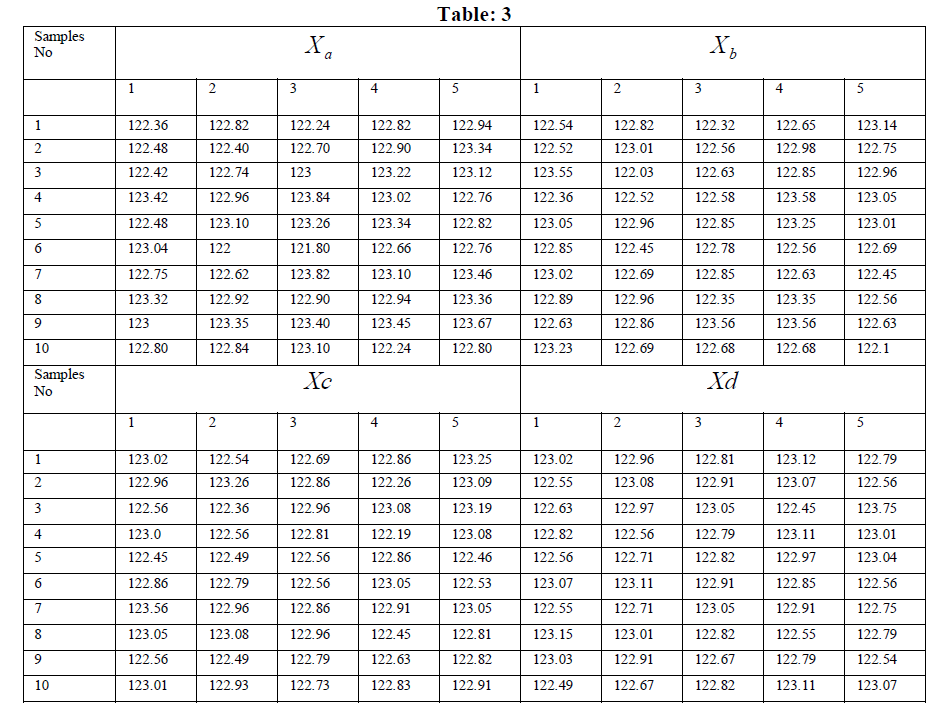
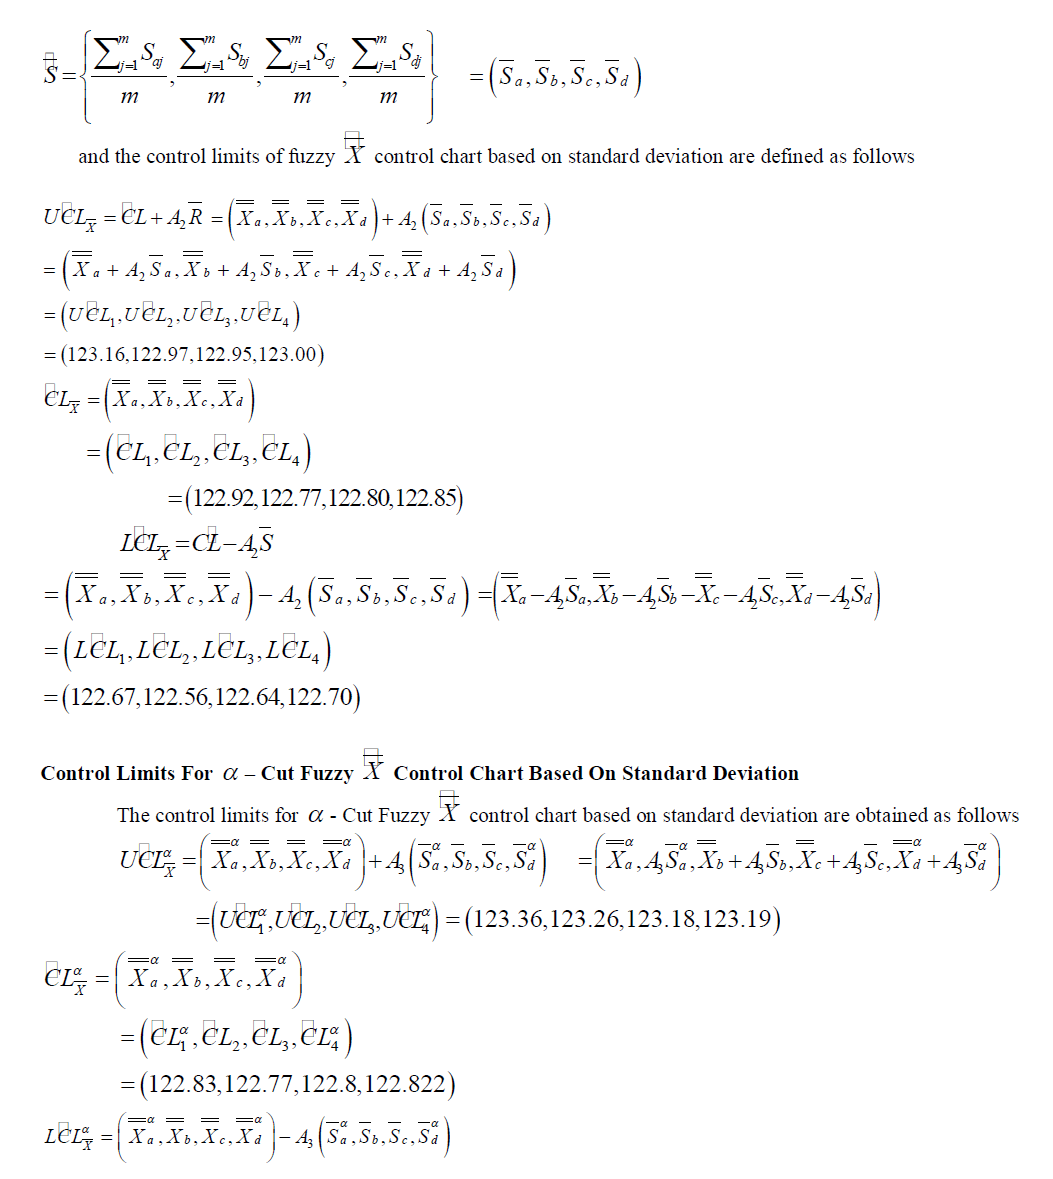
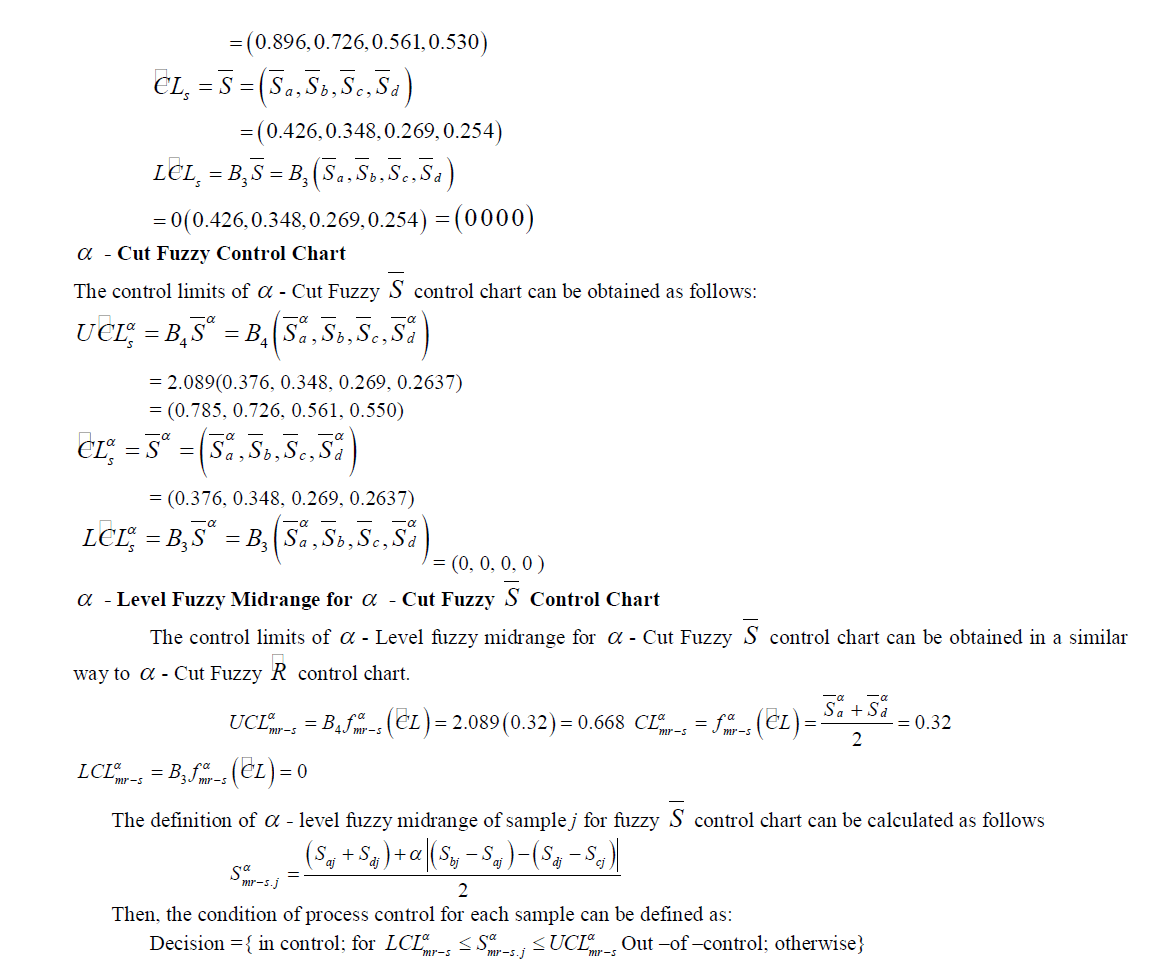
| Application: Different Observation data have been considered with 10 samples. Fuzzy control limits are calculated according to the procedures. For n = 5,A2 = 0.577 Where A2 is obtained from the coefficients table for variable control charts |
 |
V. FUZZY X CONTROL CHART BASED ON STANDARD DEVIATION
|
 |
 |
 |
 |
 |
 |
VII. RESULT AND CONCLUSION
|
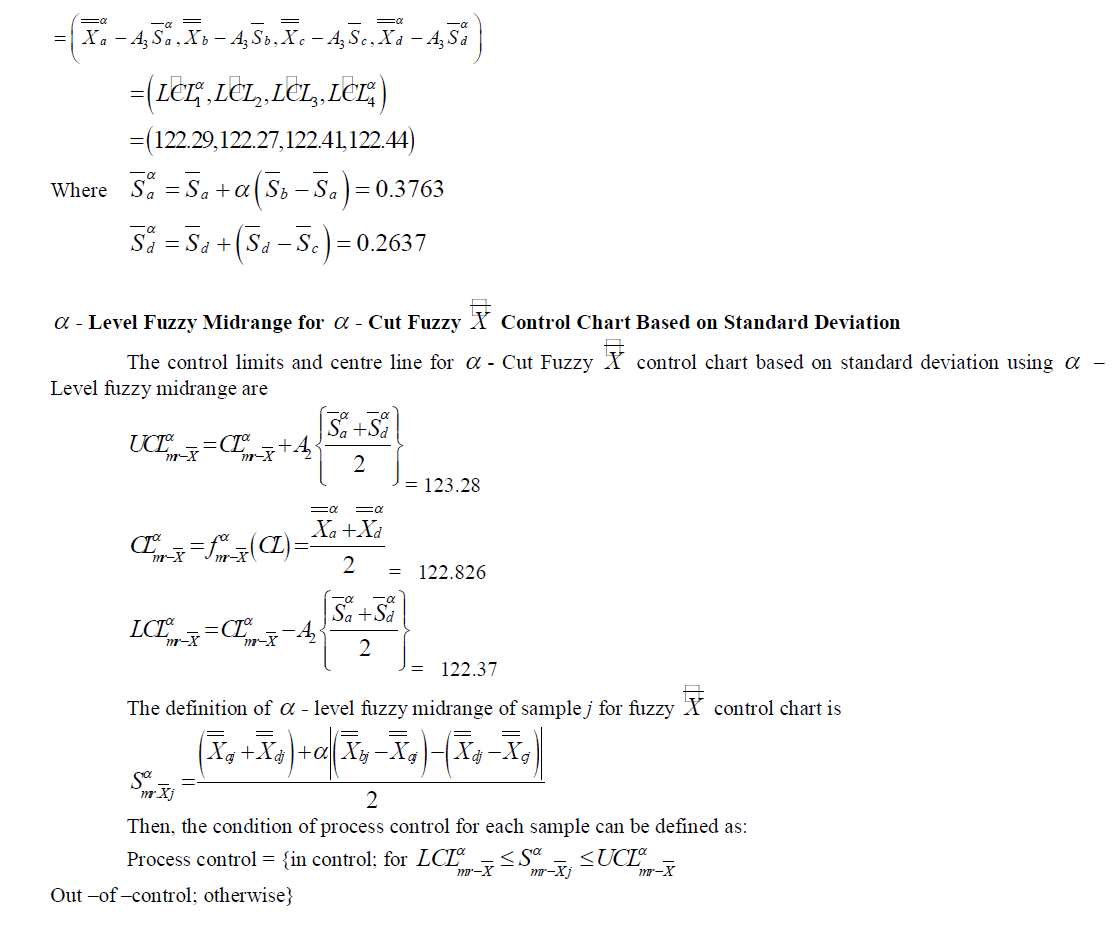
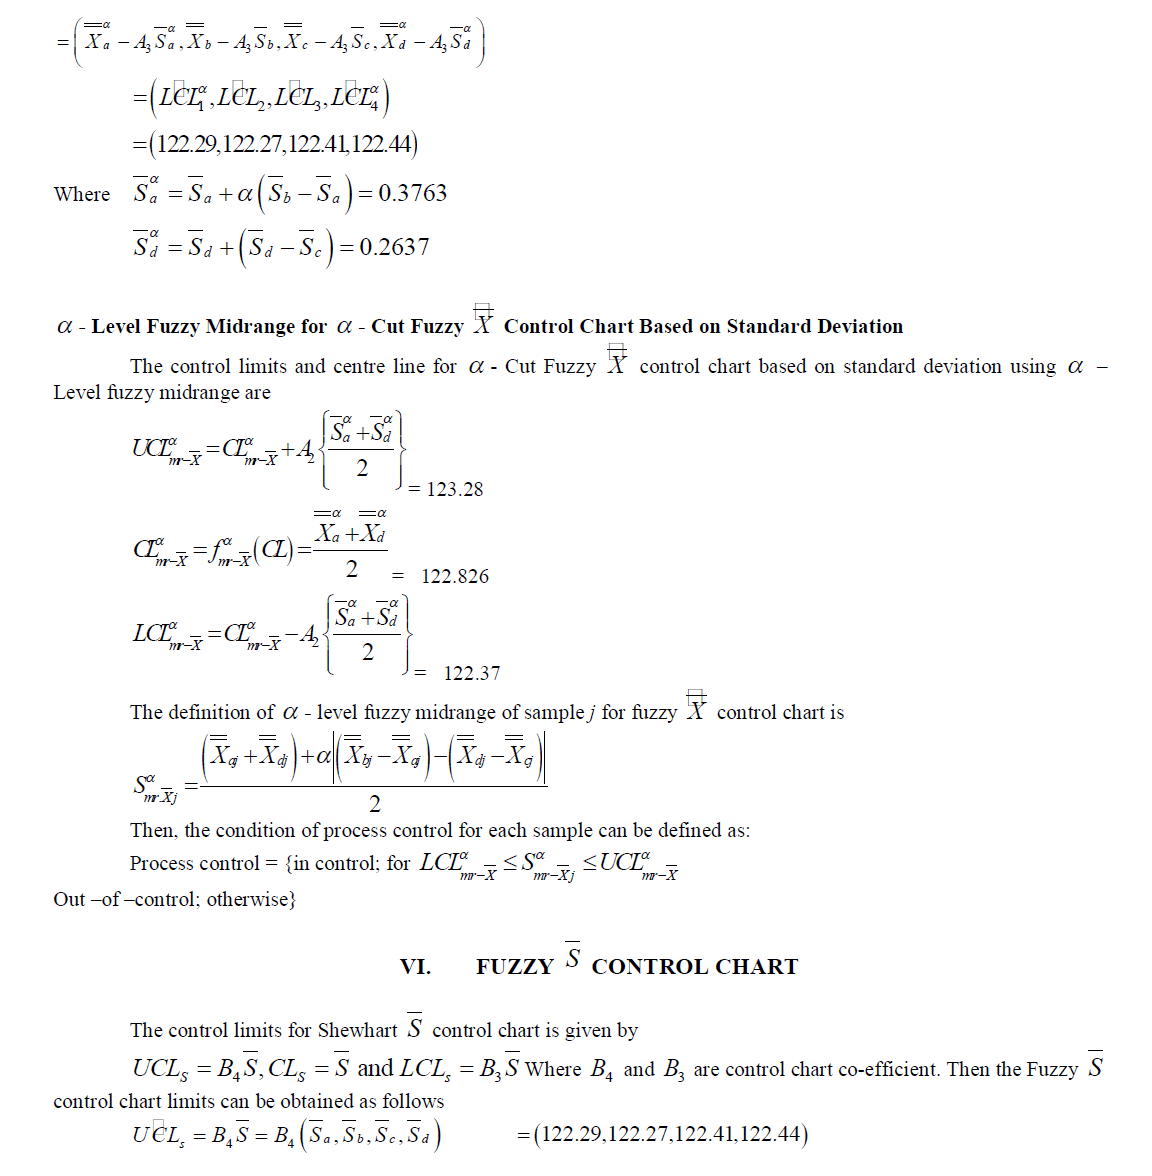
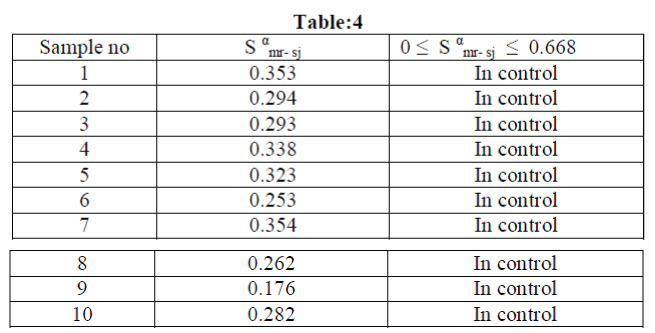
| From Table 4 it is found that the process is under control with respect to S α mr- sj for each sample. So these control limits can be used to control the production process. Since the plotted values are close to the control limits, Fuzzy control limits can provide more flexibility for controlling a process.Control charts have an efficient usage field to keep the process under control. In this investigation control chart and fuzzy logic are tried to combine. Construction of fuzzy control chart has some advantages and disadvantages. The major contribution of fuzzy set theory is its capability of representing vague data. With the help of the fuzzy set theory, flexibility of the system is improved. The main difficulty of constructing fuzzy control chart is selecting suitable membership function of linguistic variables. The assignment of membership function to each linguistic variable is not easy for process and quality engineers. The shape of membership function should be based on system behavior and user’s preferences and also increasing and decreasing number of linguistic variables affect the performance of fuzzy control chart. |
References
|
- Ryan, T. (1989), Statistical Methods for Quality Improvement, New York: John Wiley & sons
- Wang, J.H and Raz, T. (1990a) “On the construction of control charts using Linguistic Variables”, Intelligent Journal of Production Research 28, pp. 477-487
- Wetherill,G.B And D.W.Brown(1991).”Statistical Process Control: Theory and Practice”, chapman and hall ,New York
- Wheeler, D J & Chambers, D S (1992), Understanding Statistical Process Control ISBN 0-945320-13-2
- El – Shal, S. M., Morris A. S. (2000) “A fuzzy rule -based algorithm to improve the performance of statistical process control in qualitySystems”, Journal of Intelligent Fuzzy Systems, 9, pp. 207– 223
- Rowlands, H and Wang, L.R, (2000) “An approach of fuzzy logic evaluation and control in SPC”, Quality Reliability Engineering Intelligent ,16, pp. 91-98
- Basher,I.A&Hajmeer.M(2000).’Artificial neural ntworks:fundamentals,computing,design and application’ Journal of microbiological methods 43,3-31
- Gulbay, M., C. Kahraman and D. Ruan, (2004) “alpha - cut fuzzy control charts for linguistic data”, International Journal of IntelligentSystems. 19, pp. 1173-1196.
- Gulbay, M and Kahraman, C. (2006) “Development of fuzzy process control charts and fuzzy unnatural pattern analysis”, Computational Statistics andData Analysis 51, pp. 434-451.
- Gulbay, M and Kahraman, C. (2006) “An alternative approach to fuzzy control charts: direct fuzzy approach” Information Sciences, 77(6), pp.1463-1480
- Pandurangan A and Varadharajan.R (2011), “Fuzzy Multinomial Control Chart with Variable Sample Size”, International Journal of EngineeringScience and technology, 3(9), pp. 6984– 6991.
- Pandurangan A and Varadharajan.R (2011), “Construction of - Cut Fuzzy Control Charts Using Fuzzy Trapezoidal Number”, InternationalJournal of Research and Reviews forApplied Sciences, 9(1), pp. 100–111.
- Nelson, L. (1984), "The Shewhart Control Chart -Tests for Special Causes," Journal of Quality Technology, 15, 237 -239.
|