ISSN ONLINE(2319-8753)PRINT(2347-6710)
ISSN ONLINE(2319-8753)PRINT(2347-6710)
| Boopathy.S 1, Satheesh kumar.M 2, Mohamed Feroz.A 3, Dinesh.R 4 PG Student, Department of Embedded System Technologiesm Anna University, Regional Centre, Coimbatore, India |
| Related article at Pubmed, Scholar Google |
Visit for more related articles at International Journal of Innovative Research in Science, Engineering and Technology
This paper describes that the measurement of different parameters at the poultry farm such as temperature, humidity, level of water and valve control. In this, temperature sensor calibration has been done by help of two point formula. The level sensor outputs have been analyzed with respect to fuel in the generator. From the result of sensor output linearization of the particular instrument has been described.
Keywords |
| Classification of sensors, Comparison of sensors, Analysis of level sensor. |
INTRODUCTION |
| Instrumentation is a field in which the system or the device can respond with respect to environmental condition change. Most of the industries familiar with sensors like temperature, humidity, pH, level, moisture, flow, leak detector etc. Nowadays, with rapid development of poultry there is a large number of laying hens’ specialized culturist in rural areas. Generally farmers don’t get appropriate funds and advanced tools for their farm. Especially they are lagging in the field of automation and control the conditions of the farm. Hence it is severely affect the production of hens as well as eggs. Therefore, enhancing the automation and special type of equipment in the small farms were necessary. In this paper, initial idea has been described in terms of food feeding automation in time based manner and monitoring the different parameters at egg incubation tray then automating the equipment by measuring them at the particular band value. It also monitors the level of water in tank. Actually there is mechanical setup available for liquid (water) flow for hens. |
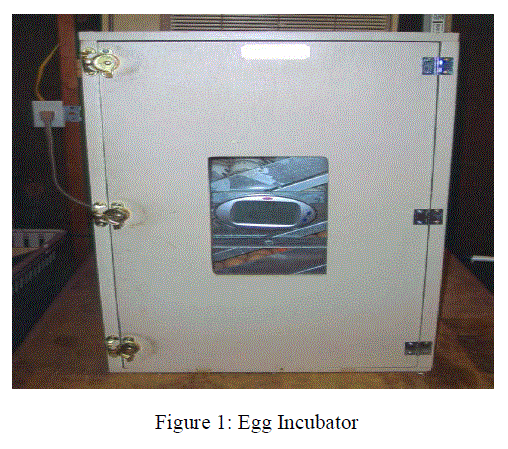
| Presently there are two types of incubation available namely artificial and natural. In natural method there will be a hen for hatching process. The some pros are 1.No electricity 2. Hen does all the work 3. It will brood chicks after they hatch. 4. High hatchability rate 5. Some breeds hatch better under hens (Nankin) than in incubators. 6. Good for hatching small size of chicks per year. Even though it has some advantages there are some cons, 1.Hen sometimes breaks eggs. 2. Will occasionally quit and get off nest.3. Hen sitting is 1 less not laying in the flock. 4. Can only sit on a small size of eggs at a time. 5. Disease transmission from hen to chick. Hence in heavy industries they adopt incubators. It has temperature range from 101 to 102 degree and relative humidity is about 50 to 60% and it consumes less electricity. |
 |
II. BASIC REQUIREMENTS AN EGG NEEDS TO HATCH |
| ïÃâ÷ Hatch Temperature 99 -102 Deg. F. ïÃâ÷ Humidity 50%-65% RH ïÃâ÷ Egg Turning at least 2x/day ïÃâ÷ Air Flow air and gas exchange |
III. CREATION OF GENERALIZED BLOCK |
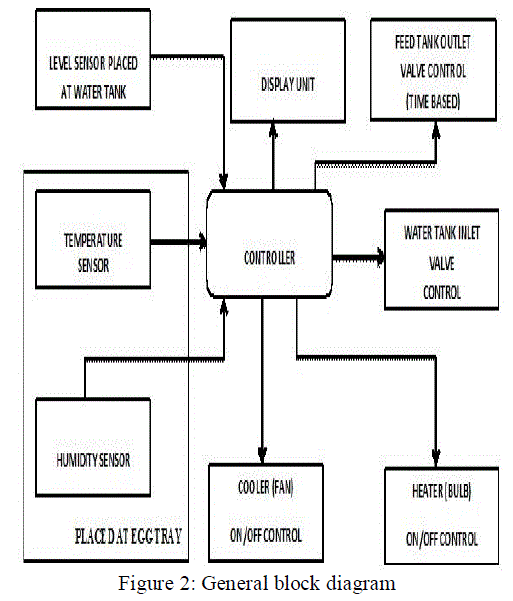
| Building the block diagram for an idea is necessary part in order to examine the overall operations of the defined solutions. In this it describes temperature, level, humidity as an input and feed box valve control, water tank valve, cooler, heater, and display unit as an output. The following figure 2 shows the block of the project. |
 |
IV. PROPOSAL OF THE PAPER |
| Currently in poultry farm hatching of eggs done by help of artificial method. There will be a light in order to maintain the temperature at certain level. Temperature can be measured in the tray for a certain interval of time. If suppose it exceeds or below the prescribed level, it will be adjusted manually. Added with this there will be a human intervention for food feeding for hens. Hence this paper will give an outline to automate all those things as mentioned above. It will be done by help microcontroller. Temperature and humidity sensors will be placed in the tray and then it is interfaced with control unit. There will be a cooler and heater. There also time based food feeding done automatically by incorporating real time clock (RTC) with them. There also provisional to monitor the level of water at tank. If it gets empty, valve will open automatically. Hence it reduces the manual work. |
V. TEMPERATURE SENSOR |
| Temperature sensors are devices used to measure the temperature of a medium. It played a significant role in everyday products. For example, household ovens, refrigerators, and thermostats all rely on temperature maintenance and control in order to function properly. From a thermodynamics view, temperature changes as a function of the average energy of molecular movement. As heat is added to a system, molecular motion increases and the system experiences an increase in temperature. It is difficult, however, to directly measure the energy of molecular movement, so temperature sensors are generally designed to measure a property which changes in response to temperature. The devices are then calibrated to traditional temperature scales using a standard |
| i). Classification of temperature sensors |
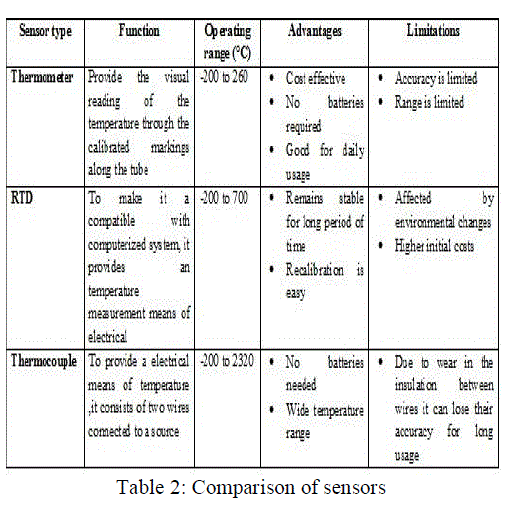
| Temperature sensor classified as thermometers, resistance temperature detectors, and thermocouples. All three of these sensors measure a physical property which changes as a function of temperature. A. Thermometer It is the most commonly used temperature sensor in everyday measurements of temperature due to its simplicity. Two examples of thermometers are |
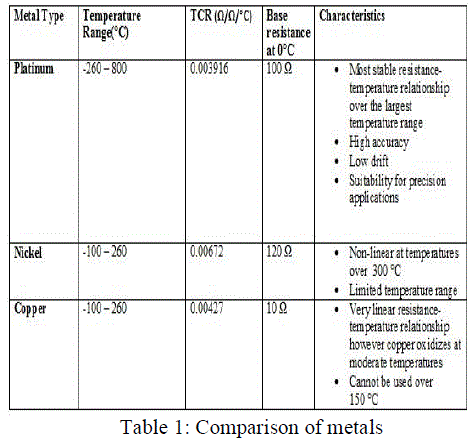
| 1. The Filled System The familiar liquid thermometer consists of a liquid enclosed in a tube. The volume of the fluid changes as a function of temperature 2. Bimetal thermometers In the bimetal thermometer, two metals (commonly steel and copper) with different thermal expansion coefficients are fixed to one another. As the temperature of the strip increases, the metal with the higher thermal expansion coefficients expands to a greater degree, causing stress in the materials and a deflection in the strip. B. Resistance Temperature Detectors An RTD works under the relationship between electrical resistance and temperature, which may either be linear or nonlinear. RTDs are traditionally used for their high accuracy and precision. However, at high temperatures (above 700°C) they become very inaccurate due to degradation of the outer sheath, which contains the thermometer. Therefore, RTD usage is preferred at lower temperature ranges, where they are the most accurate. The metals chosen depend on its property. Platinum is mostly used. The table shows characteristics of metals. |
 |
| C. Thermocouples Another temperature sensor often used in industry is the thermocouple. Among the various temperature sensors available, the thermocouple is the most widely used sensor. Similar to the RTD, the thermocouple provides an electrical measurement of temperature. The main principle upon which the thermocouple function is based on is the difference in the conductivities of the two wire materials that the thermocouple is made of, at a given temperature. At higher temperatures the conductivity difference increases and conversely, the conductivity difference decreases at lower temperatures. |
 |
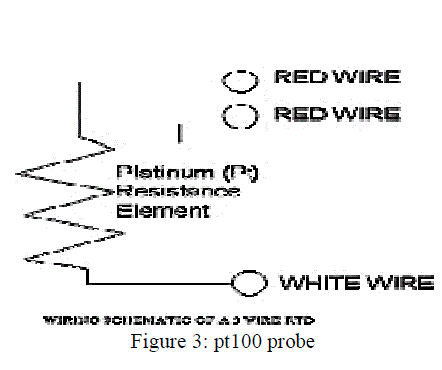
| iii). RTD PT100 Platinum most widely used since it has stable temperature resistance relationship. It have 100Ω at 0°C, hence is called pt100. This property increases accuracy, repeatability and stability. It have positive temperature coefficient. That is, when temperature increases resistance increases correspondingly. Most of the data logging system utilizes this device for temperature measurement. Connection probe of the sensor is shown in the figure. |
 |
| iv). Temperature Transmitter Temperature transmitter is a device which converts pt100 or thermocouple into 4-20mA current. It produces 4mA at 0°C and 20mA current at 100°C. It consists of input circuit and main circuit. In input circuit it has A/D converter and MUX and in main circuit it has mathematical co-processor and memory. The following figure shows the STT 648 HART temperature transmitter. |
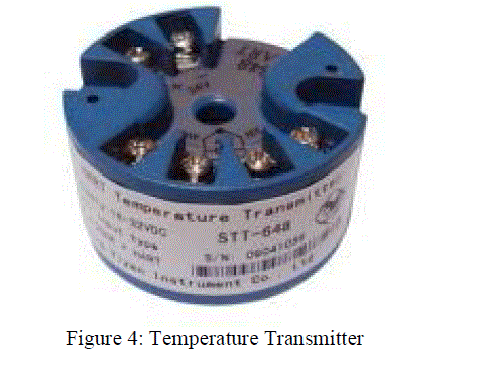 |
| STT 648 has good stability and high precision, strong adaptability. It is a two wire system with 4-20mA output signal. It has the power supply range from 11 to 36V and tolerance is about ±0.05% accuracy. 24V will be given to positive terminal pin and current output will be taken out from negative terminal pin for processing. v). Calibration |
| In order to maintain the accuracy of the sensor, calibration must be done properly. It should be done at temperature other than 0°C and 100°C. There are two basic types of calibration used in practice. One is fixed point calibration and second comparison calibration. In fixed point method, a point formula is used. That is it generates value with standard known and calibrated meter (namely multimeter). The formula is given below, |
| (X-X1)/(X2-X1) = (Y-Y1)/ (Y2-Y1) ------------- (1) |
| Where (X1, Y1) is lower end value and (X2, Y2) is higher end value. By using this formula, linear straight line value will be calculated. |
| Y=MX+C -------------- (2) |
| Where C, M are constants. In comparison method, measured value is compared with calibrated thermometer whose value is uniformly stable. It will be cost effective since all the sensors needs to be calibrated simultaneously with automated equipment. |
VI. LEVEL SENSOR |
| Measurement of fluid level is done by help of level sensor. Free flowing substances can be measured by using this sensor, such as water, oil, slurries, fuel etc. Granular/powder form solids (solids which can flow) also can be measured. It is classified in different ways depends on kinds. The following figure shows the classification of sensor. |
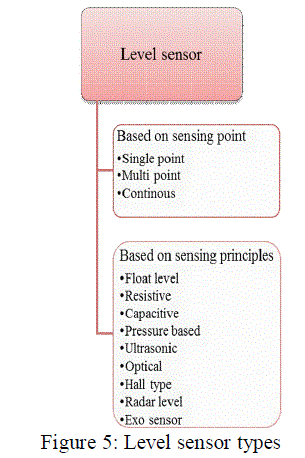 |
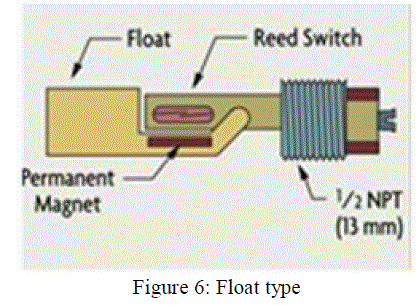
| A). Based on sensing points 1). Single point level sensor - These sensors are used where fluid level is to be sensed only at single location. 2). Multi-point Level Sensors - These sensors are used where fluid level is to be sensed at number of locations single location. 3). Continuous Level Sensors - These sensors are used where fluid level at all locations is too sensed. B). Based on sensing principles All of these sensors float type and resistive types are most widely used in practice due to its accuracy. 1). Floating type Here, a float is moved with the liquids. A core is attached to the float via spring. A reed switch (magnetic type) is mounted in the hermetically sealed core and the core moves inside a stem with the float movement. Powerful magnet encircles the stem. When the float rises or lowers with liquid level, the reed switch gets operated due to the magnetic field generated by the magnets. |
 |
| 2). Resistive Level Sensors These sensors are widely used in fuel level sensing. A wiper, connected to a lever arm with a float, moves across continuous resistive track. |
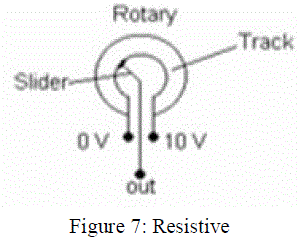 |
| It works based on potentiometric measuring principle. Current is made to flow through the resistance. Voltage drops linearly across this resistance. Slider across this resistance is connected to a float. Voltage output is taken between the slider and one end of the resistance. Thus with the varying fluid levels, slider moves and the output voltage varies. |
VII. RESULTS AND DISCUSSION |
| So far, temperature sensor and level sensor have been studied and identified in order to equip with the instrument at the poultry farm. Calibration of temperature and level sensor has been analyzed. For pt100 temperature sensor, different values have been taken and formula [1] has been calculated. The temperature transmitter produces 4-20mA current which is connected to signal conditioning module. Count value has been taken with respect to temperature. Let (X1, Y1) -> (-196,113) and (X2, Y2) -> (36.3, 497). By using these values, point formula has been calculated as follows. |
| (X+196) / (232.3) = (Y-113) / (384) |
| X = 0.600Y-263.829 ----------------- (3) |
| The above formula is the calibrated and tested for different values. Level sensor output has been analyzed at generator fuel tank. Readings have been taken by adding and removing of fuel (litre by litre). Graph has been plotted for the readings. |
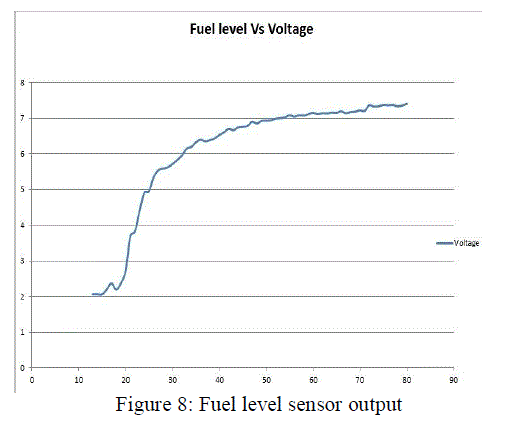 |
| When the indicator shows FULL, then the voltage is approximately 7 to 8V. If the fuel level is below 15ltr, then the indicator shows empty and the corresponding voltage is 2 to 3V app. This 15ltr is reserved level. It can be technically described as “Dead Band”. It is defined as that there will be maximum and minimum level. This is basic idea behind the level sensor which is used at fuel tank. |
VIII. CONCLUSION |
| The system design for poultry farm automation has been analyzed at different levels. Temperature sensor especially pt100 is calibrated for different values. Also level sensor output has been analyzed for its readings |
| Moreover PT100 sensor is mostly used in many industries due its stable property. Further these sensors will be interfaced with microcontroller. Also feed control and cooler/heater will be done in order to complete the automation of poultry farm environment. |
References |
|