International Journal of Advanced Research in Electrical, Electronics and Instrumentation Engineering
ISSN ONLINE(2278-8875) PRINT (2320-3765)
ISSN ONLINE(2278-8875) PRINT (2320-3765)
Veena V1, Asha Anu Kurian2
|
| Related article at Pubmed, Scholar Google |
Visit for more related articles at International Journal of Advanced Research in Electrical, Electronics and Instrumentation Engineering
This effort focus at identifying statistically significant time/frequency domain features with adequate separability and extensive interclass variability to discriminate probable Power Quality (PQ) disturbances such as sag, swell, harmonics, outage, transients etc. Understanding of disturbances is vital to investigate the origin and causes of PQ perturbances, events of equipment failure and for further classification as well as to employ mitigation measures. A database of PQ disturbances, simulated from their parametric equations, comprising normal signal, swell, sag, harmonics, outage and oscillatory transients was generated. Shannon entropy, global variance, maximum gradient, High/Low power spectral density ratio, skewness and kurtosis were extracted from these simulated disturbed power signals. Optimum decision boundary was set and decision rules were framed, by examining the seperability and intra/inter class variability and range of the aforementioned statistical attributes in 3D feature space, prior to synthesizing decision tree for classification. Shannon entropy, global variance, maximum gradient, High/Low power spectral density ratio, skewness and kurtosis exhibited amiable separability and inter/intra class variability, adequate enough to facilitate a simple and computationally feasible rule based characterization of PQ disturbances.
Keywords |
| Power quality (PQ), Shannon entropy, variance, maximum gradient, high/low power spectral density ratio, skewness, kurtosis. |
I. INTRODUCTION |
| Power quality issues have detrimental effect on power system. The rapid growth of non-linear devices has resulted in the degradation of power quality. As a result, power quality monitoring has become important in modern power systems. The scarceness of power quality (PQ) experts in the electric power industry possesses a problem in handling the huge amount of data gathered by the distributed PQ monitoring systems. Power quality monitoring programs are often driven by the demand for improving the system wide power quality performance. Power quality monitoring is the process of gathering, analyzing, and interpreting raw measurement data into useful information. The process of gathering data is usually carried out by continuous measurement of voltage and current over an extended period [9]. The process of analysis and interpretation has been traditionally performed manually, but recent advances in signal processing and artificial intelligence fields have made it possible to design and implement intelligent systems to automatically analyze and interpret raw data into useful information with minimum human intervention. Many industrial and commercial customers have equipment that is sensitive to power disturbances, and, therefore, it is more important to understand the quality of power being provided. |
| Different techniques used for the detection and classification of disturbances include rule-based expert systems, fuzzy classification systems, artificial neural networks (ANN), and support vector machines (SVM). All these techniques use feature vectors derived from disturbance waveforms to classify power quality events. In [1], a review on using wavelet transform approach in processing power quality data is dealt with. [2] Employs Kalman filter and Stransform for feature extraction. The standard deviation of each signal is utilized. [3] is focused on the classification, performed with wavelet neural network (WNN). The approach is based on wavelet norm-entropy based feature extraction and the classifier used is a multi-layer perceptron. Galil et.al [4] proposed classification using decision tree. The signal is decomposed using MRA technique and energy of each signal is calculated. Haibo He et.al [5] used a different learning-based strategy called SOLAR (self-organizing learning array), a type of neural network, for disturbance classification. Using MRA technique, energy of the signal at different decomposition levels was estimated. Eristi et.al [6] is based on feature extraction and selection using wavelet transform and SVM. Mean, standard deviation, skewness, kurtosis, RMS, form factor, crest factor, energy, Shannon entropy, log-energy entropy and interquartile range were used as features for classification. Lee et.al [7] demonstrated an optimal feature selection method, namely, probabilistic neural-network feature selection (PFS). The PFS was combined with an adaptive probabilistic neural network (APNN) to remove insignificant features. In [8], Milchevski et.al uses the same feature vector as in [4], they used a binary decision tree and SVM classifier is trained for each node of the tree. |
| This attempt is an investigation to seek the scope of replacing mathematically complex wavelet decomposition and analytically tedious fuzzy/neural classifiers with a simple and computationally feasible rule based PQ disturbance characterizing method. |
| Section II comprises of parametric mathematical model with PQ disturbances, strategy for PQ disturbance database creation, contextual significance of statistical attributes as well as the mathematical basis of its estimation and the transformation of qualitative attributes into the statistical domain. In Section III decision rules eveluted, decision tree synthesized and analysis of separability and inter class variability in feature space. |
II. METHODOLOGY |
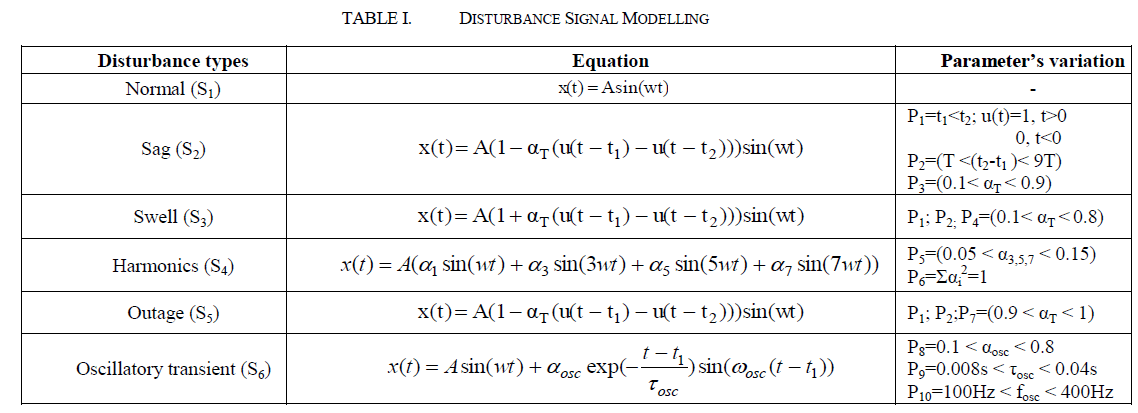
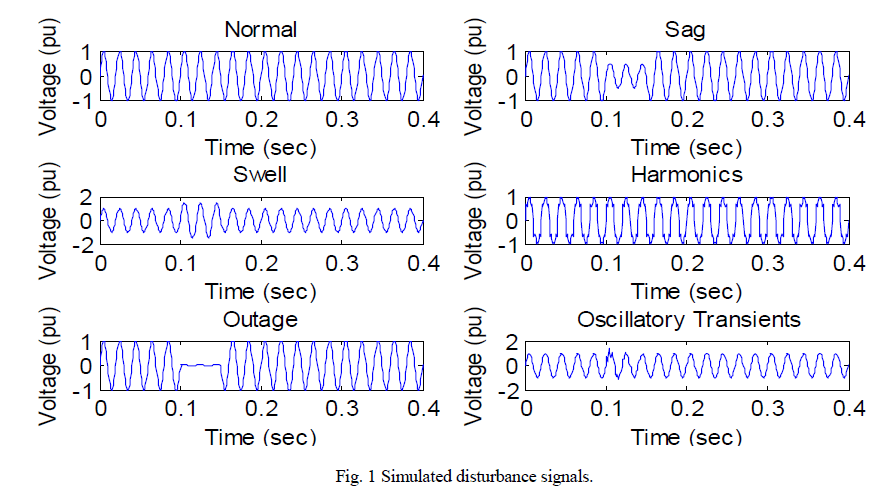
| Six classes of signals consisting of normal signal and disturbance signals sag, swell, outage, oscillatory transients and harmonics is generated using the parametric mathematical model [6] furnished in table I. Fig.1 demonstrates the simulated signals. The PQ disturbances following the parameter variation as in table I are synthesized and database of each signal is created in „xlsxâÃâ¬ÃŸ format including 60 different types of disturbances. |
 |
 |
| When power quality disturbances superimpose over normal signal, the randomness of the natural signal may vary and even the extent with which the signal amplitude can deviate from its mean may vary. This makes the Shannon entropy [6] and global variance significant in us. |
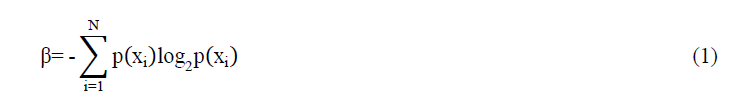
| The Shannon entropy is given as: |
 |
| The global variance is calculated as: |
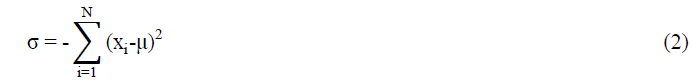 |
| where μ is the mean of the signal. |
| First derivative registers maximum intensity at the point of maximum signal slope. Surges and transients hence pose maximum gradient. |
| High/low power spectral density ratio is a feature that well characterizes harmonics and its hybrids with sag and swell. Power spectral density was estimated from Welch Periodogram. The window of low frequency and high frequency are selected such that maximum and minimum frequency contributing non-zero power is estimated initially and the mean of which is set as frequency threshold which separates low/high frequency regions of spectrogram. |
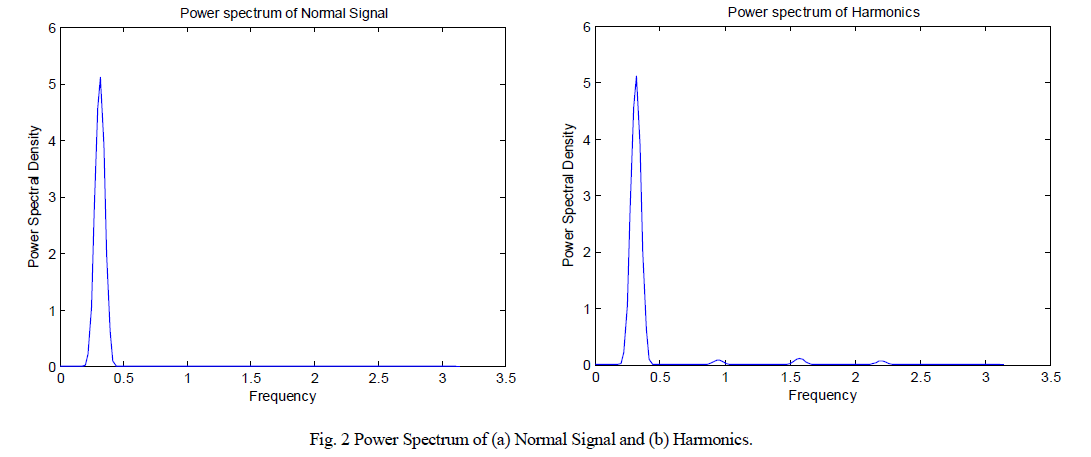 |
| Compared to the power spectrum of normal signal and the power spectrums of harmonics and its hybrids with sag and swell furnished in fig. 2 (a) and (b) reveals that even after low frequency region, repeated peaks contributing nonzero power exist in the latter two. |
| The frequency spectrum calculated by Welch Periodogram estimate is given by, |
 |
| U is the discrete-time window energy of the used window function w[n] defined a s follows, |
 |
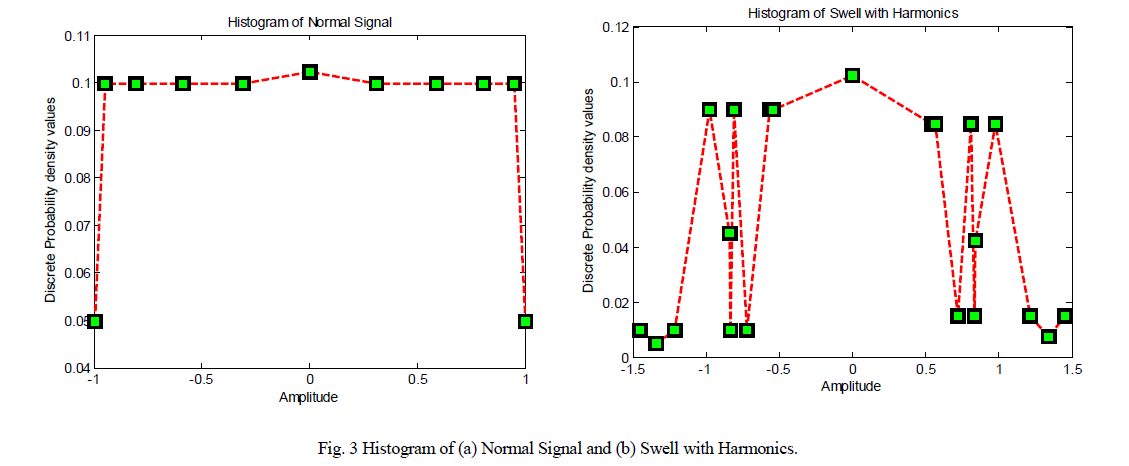
| The efficacy of skewness and kurtosis [6] was investigated with the belief that the symmetry and peakedness of probability distribution function may change as PQ perturbances leak into the normal signal. Even though sufficient variation in the symmetry of distributions of different classes of perturbances exhibited in fig. 3 (a) and (b) cannot be observed visually, both were numerically estimated. |
 |
| Prior to setting decision boundary, framing rules and synthesizing the decision tree, following the feature extraction the window of variation of this statistical attribute corresponding to each class of disturbance were noted. The evaluation to form the basis of feature selection and to identify statistically significant features offering optimum performance, the separability and interclass variability of the same were appreciated in the 3D feature plot. |
III. RESULTS |
| The separability and interclass variability of different classes of disturbances were appreciated in the 3D feature plot. The dots in the feature plot represent different classes of perturbances. The feature plots of PQ disturbances are shown in fig. 4. Fig. 4 (a) shows the feature plot of entropy, skewness and kurtosis. From the plot it is very clear that the disturbance classes have good separability. |
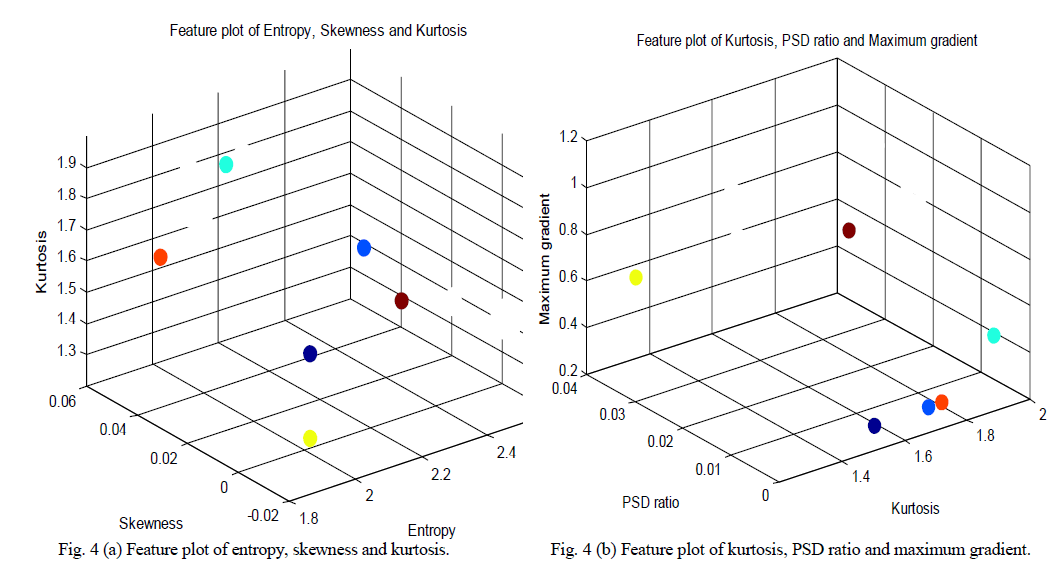 |
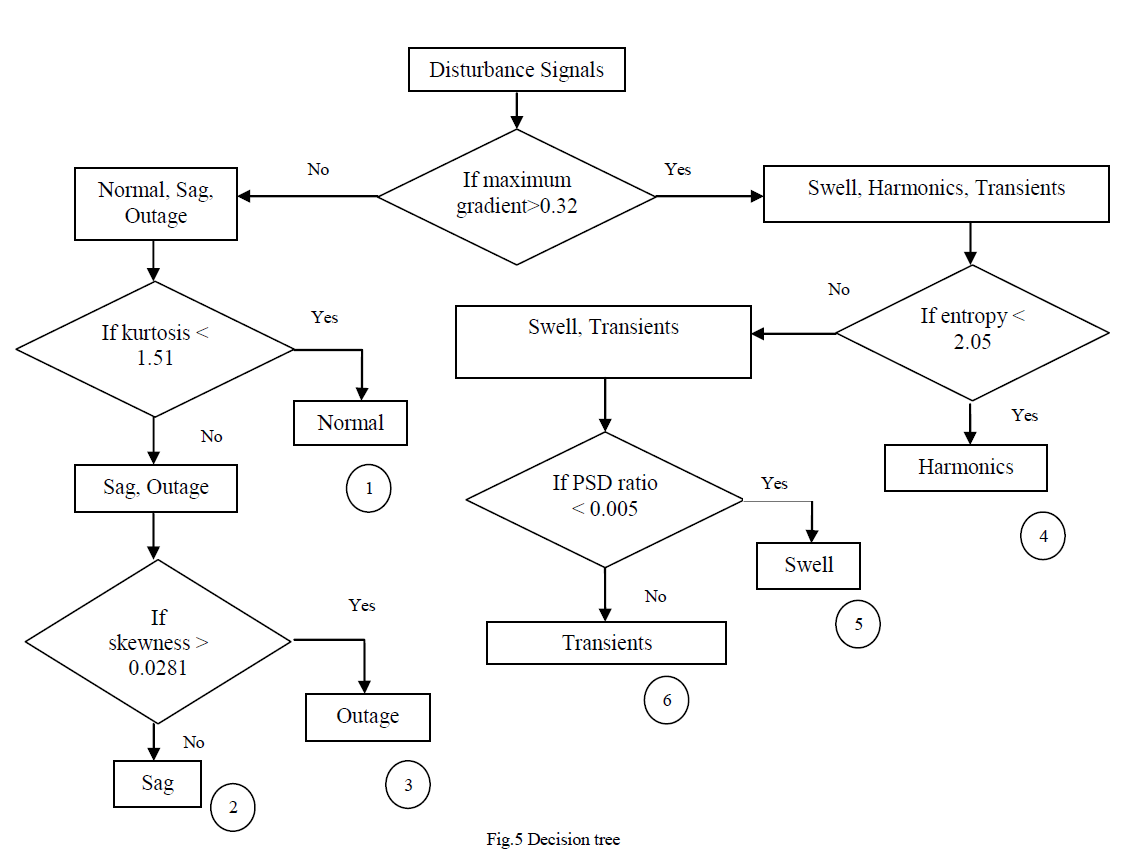
| Fig. 4 (b) shows the feature plot of kurtosis, PSD ratio and maximum gradient. The classes are non-overlapping. The six signals are classified according to the following decision tree in fig. 5. |
| The performance of the proposed classification algorithm can be evaluated comparatively with the results obtained in [4], [5] and [6]. In these papers, the classification is based on mathematically complex wavelet decompositions and fuzzy/neural networks. In [4], the feature vector of classification algorithm is created by using the WT, the energy feature extraction technique and the decision tree. The test accuracy for pure signal was obtained as 90.4%. In [5], the proposed algorithm is consisted of the WT, the energy feature extraction technique and the SOLAR and the SVM classifier. The classification efficiency for pure signal is obtained as 94.93%. In [6], the classification is based on WT and SVM and the efficiency was obtained as 98.63%. |
| On the other hand, in this paper, feature vector is obtained from applying five different feature extraction methods. Thus, the distinctive features having high classification performance are used to synthesize the decision tree and the classification efficiency attained is 100%. |
 |
IV. FUTURE SCOPE |
| The uniqueness of the features to a particular class can be still enhanced by performing the feature extraction over the segmented perturbance rather than processing the signal globally and the sample size of the database can be extended by allowing variation of time interval of the perturbance along with the amplitude. In this scenario, for want of better accuracy higher feature dimension may be required and powerful classification strategies including ANN and fuzzy techniques may also be employed. The parameters like amplitude, duration of disturbance, harmonic frequency etc of the disturbance signals can also be estimated. |
V. CONCLUSION |
| The time/frequency domain features are Shannon entropy, global variance, maximum gradient, High/Low power spectral density ratio, skewness and kurtosis of various PQ disturbances such as sag, swell, transients, outage and harmonics were extracted and evaluated in feature space to investigate the scope of a simple and computationally feasible rule based classification system. The evaluation in 3D feature domain in terms of separability emphasis that Shannon entropy, global variance, High/low power spectral density ratio, skewness and kurtosis are offering exceptional uniqueness and notable interclass variability. The decision boundary is quite linear one making the decision rule at most simple. The classification efficiency is 100%. |
References |
|