Keywords
|
| Inverter, Photovoltaic, Power Quality, Field Measurements, Harmonics |
INTRODUCTION
|
| Grid-connected PV systems utilize DC/AC converters which convert the DC current generated by solar panels into AC, in accordance with the electrical characteristics of the grid to which they are connected. The harmonic distortion induced by PV systems at the Point of Common Coupling (PCC) of a Low Voltage (LV) grid should be sufficiently low in order not to deteriorate the quality of supply to customers connected to the same LV grid. A useful tool to evaluate the harmonic content of a signal (i.e. grid current or voltage) is the Total Harmonic Distortion (THD). To this end, the European standard EN 50160 [1] imposes a limit for the total voltage harmonic distortion equal to 8%, including up to the 40th harmonic. The IEC standard 61727 [2], which addresses the interface requirements between PV systems and the utility, imposes a limit for the total current harmonic distortion equal to 5%. It should be noted here that there are additional IEC standards, such as the IEC 61000-3-2,12, [3, 4], which are applicable to lowvoltage systems, and define maximum limits for individual current harmonics and maximum current THD limits, depending on the short circuit ratio of the grid and the nominal power of the generating unit. |
| Power quality field measurements on PV inverters enable the evaluation of their behaviour under real operating conditions, as well as the validation of simulation-based studies, i.e. [5]. Already in 1995, Vokas et all [6] had studied the harmonic voltages and currents of two pilot PV parks using central inverters on two Greek islands. Schlabbach [7] presented the field measurement results of a 5 kW PV inverter without transformer, whereas Patsalides et al [8] investigated the power quality behaviour of a grid-connected PV site comprising multiple single-phase PV inverters. Haeberlin et al [9,10], presented the results of intensive tests of some inverters (1.5 kW to 20 kW) used in many grid connected PV systems in Switzerland, under continuous computer monitoring. In addition, data obtained from an analytical monitoring project was used to get information about the reliability of older and newer inverter models. During the experiments inverters were tested in real conditions and not in a laboratory environment. |
| Chicco et al [11] provided a multi-faceted view on the characterisation of the waveform distortion in grid-connected photovoltaic (PV) plants from experimental results. The focus was set on the characterisation of the waveform distortion occurring under different operating conditions in field measurements and laboratory test. Korovesis et al [12] studied the effect of non linear loads on the grid power quality when installed in a weak electric network supplied by photovoltaic plants. Cardona and Carretero [13] proposed a method to characterise the current total harmonic distortion for single-phase inverters. An expression to estimate the average value of the total current harmonic distortion for each type of day (clear sky and partially cloudy sky day) is also proposed. However, similar studies applied to 3-phase transformer-less PV inverters still require further investigation, which can be applicable from small domestic installations to large-scale PV stations. |
| In 2003 Enslin [14] investigated the dominating mechanisms of interaction between large populations of PV inverters and the electrical distribution system. More specifically, this study analyses the observed phenomena of harmonic interference and provides some explanation of the resonance between existing network components and the PV inverters. |
| In addition, a procedure for design qualification of inverters including performance characteristics, utility interface protection, electromagnetic compatibility (EMC) and field tests is presented in [15]. |
| However, the literature is lacking in comparative studies of the power quality impact of PV inverters, based on field measurements on installed and operating stations. In this study various measurements from grid connected inverters of small scale PV stations have been carried out during real operating conditions. Then, a comparative study on main electrical characteristics is performed, utilizing the measurement results. |
| The paper is organized as follows: The experimental set-up is presented in Section 2. In Section 3, the harmonic assessment of the PV inverters under study is carried out. Section 4 highlights the main results of the analysis performed in Section 3, and in Section 5 there is a conclusion. |
FIELD MEASUREMENTS METHODOLOGY
|
| A. Measurement Device |
| In order to evaluate the harmonic content of the grid voltage and current at the output of the PV inverter, field tests have been performed under real operating conditions. The power analyzer used for all the tests is a FLUKE 434 type, certified Class A according to international IEC 61000-4-30 standard. Figure 1 shows the general test set up [16]. |
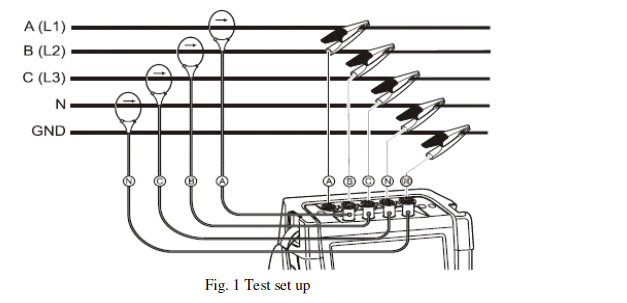 |
| The Power analyzer was connected to the output of the inverter. Four Amp clamps measure the current of each phase and neutral too, while 5 wires were connected to each phase, on neutral and ground in order to measure the voltage. |
| Power Log is the PC Software for FLUKE 434. The software processes data acquired by the instrument. Logged data can be transferred to a PC for graphical and tabular evaluation, where they can be exported to a spread sheet for generating and printing reports |
| Using the Power Log software, it is possible to generate data tables, view, print, and export time plots of all channels, perform harmonic studies, print tables, graphs, and comprehensive, formatted reports and export data to other programmes like Excel. |
| B. Methodology Data Collection |
| The power analyzer outputs are the following: |
| • Harmonics measurements for harmonics up to 40th order. This enables the evaluation of the harmonic content of the measured grid voltage and current waveforms. |
| • Voltage / Current / Frequency measurements. Voltage measurements include both neutral-line and line-line RMS values. |
| • Real Power / Reactive Power / Apparent Power. A Meter screen displays the aforementioned power measurements. There is also a Trend screen which displays the power deviations of each power component over time. |
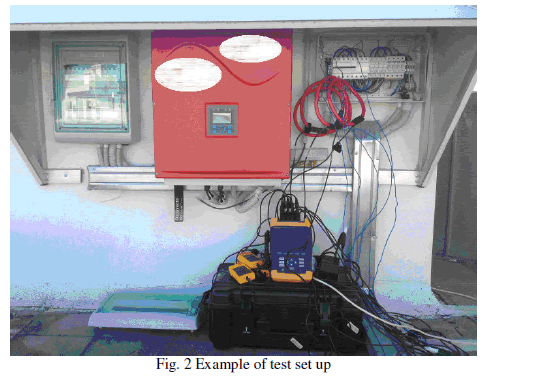
| The recording interval of each measurement was 10 seconds. The Sampling Period was 20msec on each channel. An example of the test set up is shown in Fig. 2. |
 |
| C. Selection of Sites and Systems Descriptions |
| Three-phase transformer-less inverters up to 10kW have been chosen, from different PV manufacturers/suppliers in Greece. The reasons that 3-phase inverters were chosen are: |
| • They are used more than the single phase inverters, which are utilized especially in small-scale PV stations. |
| • Due to their higher rating, lower switching frequencies are selected; therefore higher harmonic distortion is expected at their output. |
| • Limited research effort can be found in this topic. |
 |
MAIN TEST RESULTS
|
| A. Maximum Power |
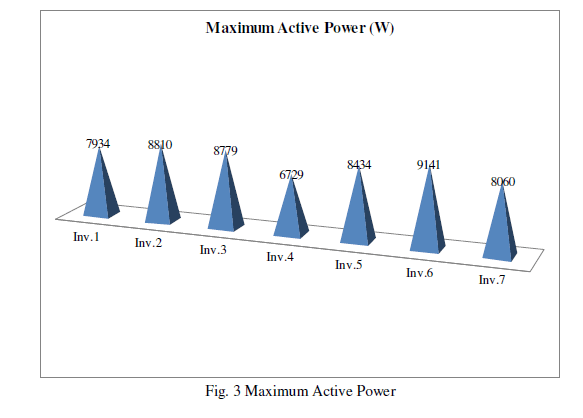
| The accuracy of the findings is strongly related to the records of Power Analyzer instrument. During the field measurements only inverter 1 injected its rated power. This is attributed to the different weather conditions such as the solar irradiance levels, the cell temperature, as well as the orientation of the construction. Also, PV panels were possibly polished. Figure 3 shows the maximum power measured for each inverter during the measurement period. |
 |
| B. Voltage Unbalance |
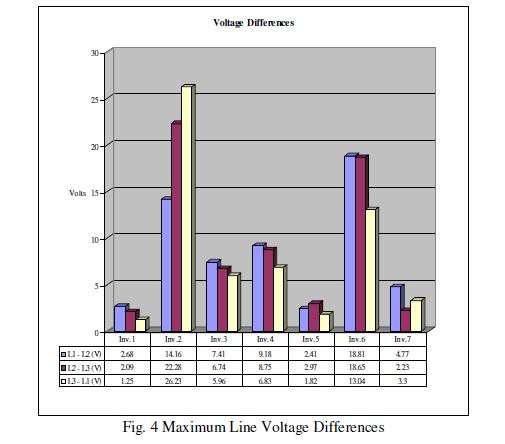
| Different levels of voltage unbalance have been measured at each location. Neutral voltage is practically zero in all cases. This is related both to the grid’s lines voltage and to the output of the inverters. The lowest grid voltage difference was applied on inverter 1, while the highest voltage difference was applied on inverter 2. In Figure 4 the highest differences between three phases for each inverter is shown. This phenomenon depends mainly on the electrical characteristics and operating conditions of the network. |
 |
| C. Analysis of THD and Reactive Power Issues |
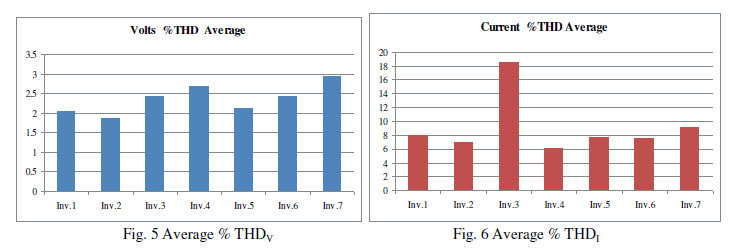
| Regarding voltage Total Harmonic Distortion (THDV), it has to be mentioned that all inverters operated without exceeding the regulation limits. In addition, the technical regulations and inverter type tests refer to operation at the inverters Nominal Power. The THDV value was found to be below the limits of every inverter datasheet, especially during operation close to Pnom. In Figures 5 and 6 the average voltage and current THD values (%) are depicted. As expected, maximum THD values have been measured during operation at low active power, whereas the minimum values have been observed when the PV inverters operated close to their nominal power. |
 |
| In some cases, it was observed that some inverters consumed a small amount of reactive power at the beginning of their operation. Three of them (inv.1, inv.2, inv.4) continued to consume reactive power during the whole time of their operation. As for inverter 5 and inverter 2, a notable increase of the current THD has been observed during the aforementioned reactive power consumption period. Inverters 3, 5, 6, and 7 inject reactive power into the grid constantly. On the other hand, frequent fluctuations of the reactive power of the inverter 4 are noticeable (injection/absorption). |
| By observing the plots of the THD and Reactive Power of each inverter, the following conclusions can be drawn: |
| The Reactive Power consumed by inverter 1 remained practically constant for the whole time of its operation. Small differences are noticeable when active power deviations are present due to cloudy conditions, where a small increase on the consumption of Reactive Power is observed. |
| Regarding the harmonic content of the inverter current, the THDI value decreases approximately linearly with the output active power of the PV inverter. This can be attributed to the fact that the magnitude of each current harmonic remains constant. Also, the current harmonic with the highest value is the 5th. |
 |
| Inverter 2 also consumed Reactive Power. From the beginning of its operation till 9.00 am, when its active power was up to 30% of its nominal (low irradiation), high levels of reactive power consumption are evident, along with high current THD values. However, when the output active power is greater than 60%, the output reactive power is regulated to lower levels with negligible deviations. The same holds true for the current THD as well, which is substantially reduced as the active power increases. In this study case, the most intense current harmonic is the 9th. |
 |
| On the other hand, inverter 3 injects reactive power into the grid constantly. During operation at low solar irradiance levels (low active power), the reactive power is reduced as well, whereas the current THD increases. A similar linear relation between the current THD and the active power is evident, as in the previous case studies. During cloudy conditions, current harmonics are amplified. The current harmonic which had the highest value was the 5th. |
 |
| In Fig. 10 the output reactive power profile of inverter 4, where frequent changes occur, is presented. However, it should be noted that a relatively small amount of reactive power is exchanged between the PV inverter and the grid (the highest absolute value was 300VAr). The 5th harmonic order is again the most intense, while the current THD is strongly dependent on the output active power, as already discussed. |
 |
| At the beginning, inverter 5 consumes reactive power and when the active power is greater than 15% of Pnom, it injects reactive power into the grid. As can be seen from Fig. 11 the reactive power is dependent on the active power of the inverter, which in turn is affected by solar irradiance levels. At 15.40 pm the output active power was decreased due to the presence of a moving cloud. The reactive power is reduced as well, but the current THD is increased. THDI had its highest values while the inverter was consuming reactive power and 5th harmonic order was the most intense. |
 |
| Inverters 6 and 7 demonstrate similar performance as inverters 3 and 5 as far as the THD and the reactive power is concerned. They inject reactive power into the grid constantly, which varies in direct proportion to the active power. As in the previous case studies, during low solar irradiance levels, both the active and reactive power are reduced, while the current THD is increased. Both inverters had high 5th order harmonic in relation to the other orders. Current THD was linearly dependent with both the active power and the irradiation. |
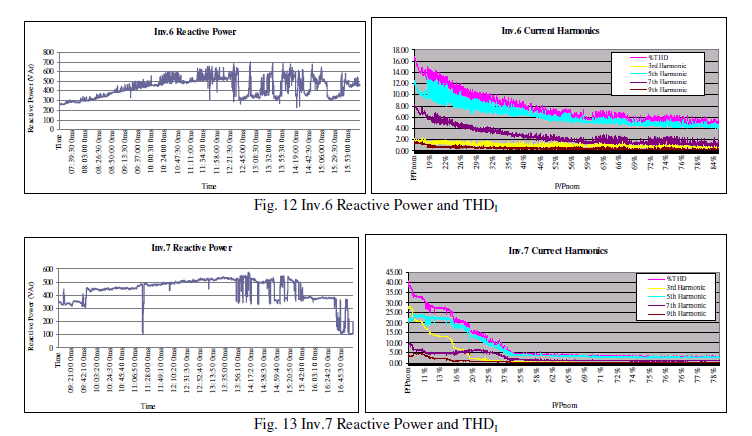 |
| As a conclusion, it can be inferred that based on the results obtained from the power analyser measurements, the current THD value is affected by the output active power of the PV inverter. |
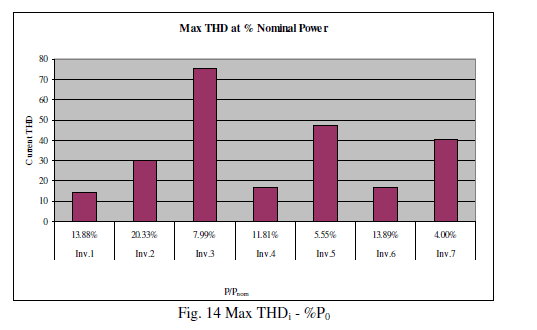
| Unfortunately, only inverter 1 reached its’ Nominal Power so it is almost impossible to estimate the current THD value during operation at nominal Power. Maximum THD values are observed while the PV inverters operate well below their rated power. Consequently, current THD values depend on the inverter output power as well as on the grid characteristics. Figure 14 depicts the active power of each inverter, normalized on its rated value, at which the highest current THD values are measured. |
 |
| D. Harmonics to Iactual |
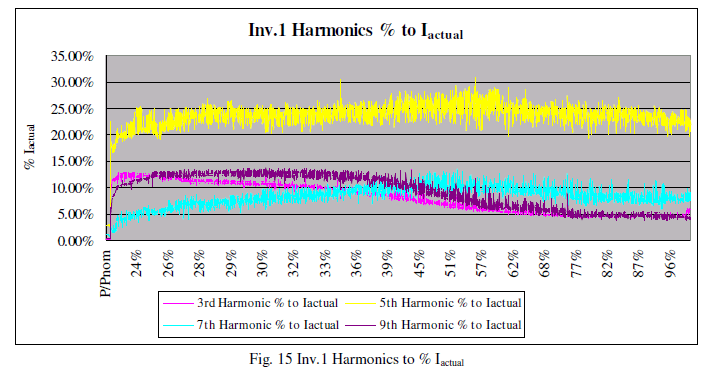
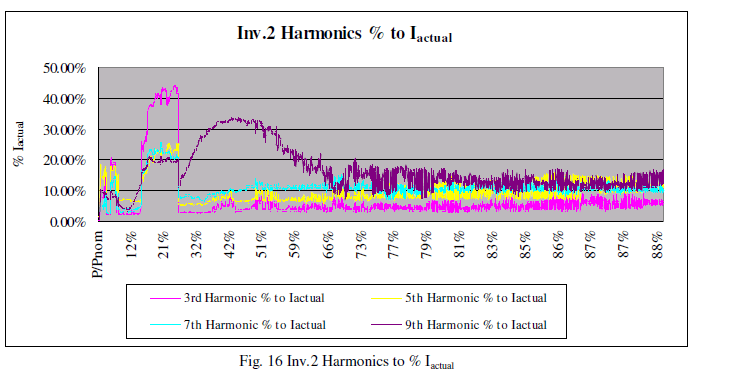
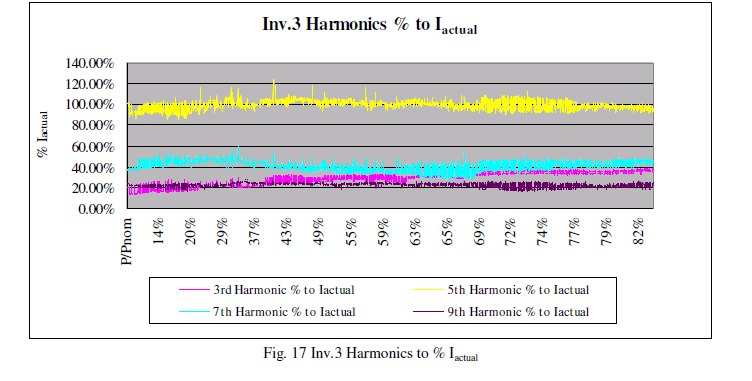
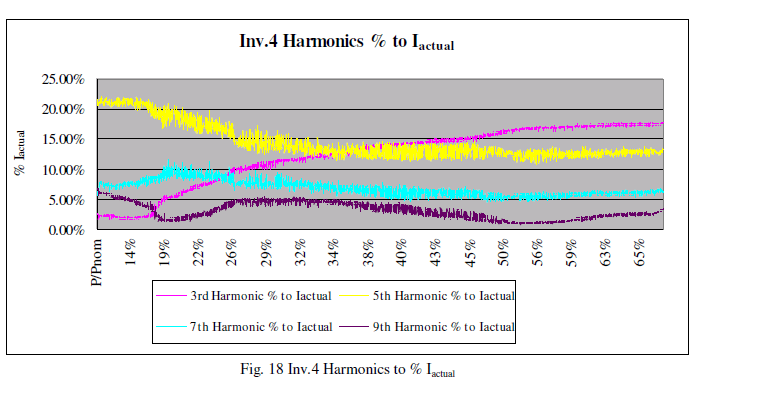
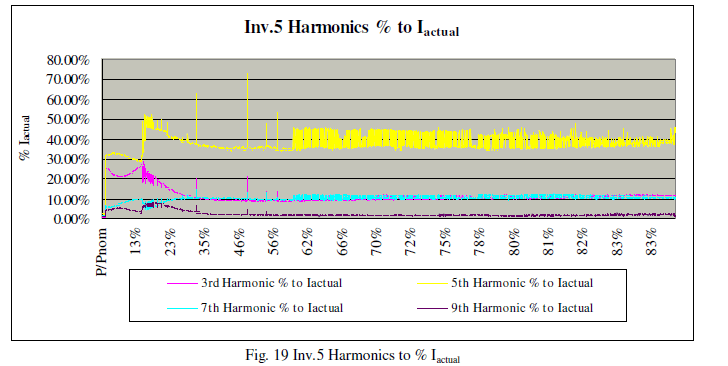
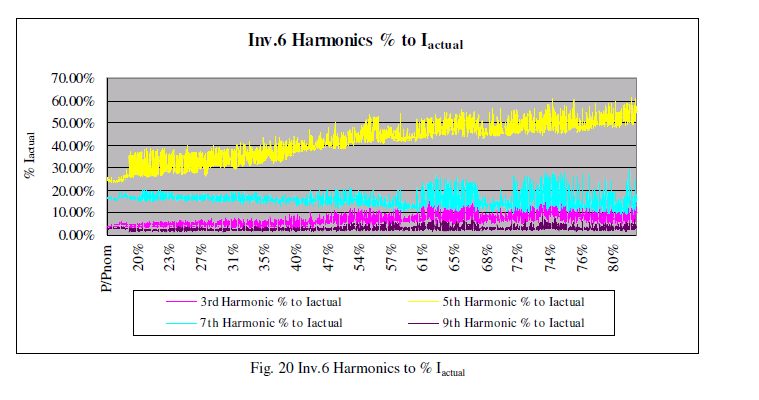
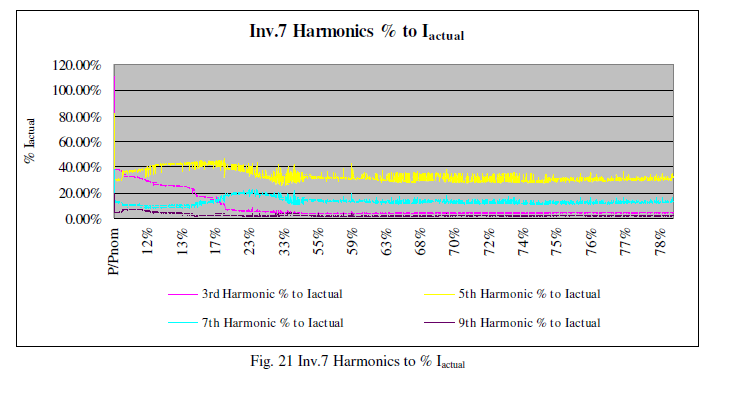
| Power Analyser measurements can be further utilized in order to evaluate the contribution of each harmonic component to the actual waveform. Current harmonics can be expressed as a percentage of the fundamental or as a percentage of all harmonics combined (RMS values). For a better analysis of the results it is preferable to provide diagrams where each current harmonic is expressed as a fraction of the actual current which changes constantly. In that case it will be easier to analyse the contribution of each harmonic order and to understand, if a current harmonic increases, decreases, or remains constant. |
| Thus, it is preferable to use the following equation for each individual harmonic up to 9th order: |
| Contribution of harmonic to Iactual = (k harmonic · Iactual) / 100 |
| So, analysing the percentage of 3rd to 9th harmonic to Iactual, the following conclusions are drawn for each inverter: For inverter 1, the 5th harmonic is almost stable for the whole period of its operation. It varies from 20% to 27%. The 3rd harmonic changes from 12% to 5% till 50% of Pnom, above which it remains practically constant at 5%. The same holds true for 7th and 9th harmonic orders as well. |
 |
| In the case of inverter 2, it can be inferred that during operation at low active power, it is unable to suppress adequately the current harmonics. The large amount of reactive power consumed during the early hours of its operation, while its active power is below 30% of Pnom, influences the current harmonics too. In comparison with the other inverters, the most intense current harmonic is the 9th, indicating that at the beginning of its operation it cannot control the triplen harmonics. Nevertheless, when the reactive power consumption is stabilized, the 3rd, 5th and 7th harmonics, normalized on Iactual, remain constant, while the 9th harmonic seems to become stable when the output active power exceeds 70% of Pnom. |
 |
| On the other hand, it can be inferred that inverter 3 is able to regulate each current harmonic at a fixed percentage of Iactual, irrespective of the active power levels. The measured values are notably higher than those of the other inverters. It is assumed that this is related to the inverter topology and the grid conditions. |
 |
| From Figure 18 it can be deduced that when the active power of inverter 4 is above 30% of Pnom the ratios of the 5th, 7th and 9th harmonics remain practically constant, whereas the percentage of the 3rd harmonic increases at higher active power levels, indicating that this inverter cannot handle some triplen harmonics. |
 |
| Regarding inverter 5, when its active power exceeds 25% of Pnom and it stops consuming reactive power, all the current harmonic ratios remain constant, thus the contribution of each harmonic isn’t affected by the varying operating conditions. |
 |
| Based on Figure 20, the 3rd, 7th and 9th harmonic ratios of inverter 6 remain constant, whereas the ratio of the 5th harmonic over Iactual increases at higher active power levels. |
 |
| For inverter 7, like inverter 6, when its active power exceeds 30% of Pnom, the percentage of each current harmonic remains constant. |
 |
RESULTS AND DISCUSSION
|
| The primary focus of this paper is to identify the main factors affecting the power quality characteristics of PV inverters, which in turn could be taken into account in future research studies. |
| The duration of each test was approximately 8 hours. Consequently, most of the PV inverters examined didn’t inject their rated active power during field measurements; therefore current THD measurements can’t be directly compared with the datasheet values which refer to operation at rated power. |
| Based on the measurement results, all inverters were operating with voltage THD and individual voltage harmonic values within the statutory limits. Current THD and individual current harmonic values comply with the maximum limits imposed by the regulations when the output active power of the PV inverters is close to their rated. 3rd to 9th Current Harmonics have the highest magnitudes, while 11th to 33rd were always below the limits of the regulations. Current harmonic magnitudes are strongly dependent on the active power of the inverter. In the diagrams presented, all inverters under examination demonstrated similar behaviour: minimum current THD values have been measured during operation close to Pnom, whereas current THD increases notably in early morning and late evening, where the inverters active power is low. On the other hand, voltage THD remained sufficiently low during the measurement period. It was not affected by the varying output active power of the PV inverters, as expected. |
| Most of the inverters that were tested, consumed small amounts of reactive power at the beginning of their operation, potentially due to reactive power consumption by their equipment, depending on their technology. Also, all PV inverters under study injected reactive power into the grid. Depending again on the inverter technology, some contribute to voltage control of the network, by regulating their output reactive power. |
| Both the current THD and the output reactive power are related to the output active power levels, which in turn are strongly dependent on solar irradiance levels. During operation at low solar irradiance levels, both the reactive power and the current THD increase, the latter exceeding the datasheet value as well as the maximum limit of 5%. However, this is attributed to the fact that the PV inverters injected active power well below their rated value during the field measurements. Consequently, operation at rated power is obligatory in order to assess whether the current THD value satisfies the imposed limit. |
| Also, in some inverters, the values of harmonic currents remain constant. That means that no matter what the Iactual was, the harmonic current was the same. That happened mainly during operation above 20% of Pnom. This fact explains the linear relation between the current THD and the active power. |
CONCLUSIONS
|
| In this paper, seven 3-phase transformer-less PV inverters, located in different regions of Greece, have been investigated under real operating conditions in terms of power quality. Results obtained from the present analysis indicate several factors affecting the power quality characteristics of the PV inverter output current. Most of the inverters consume or feed reactive power into the network depending on their output active power and their technology. Voltage THD is almost always below the maximum permissible limit imposed by the regulations and it isn’t affected by the active power fluctuations of the inverter. On the other hand, when current THD is expressed in percent of the fundamental current, rather than the inverter rated, THD values almost always exceeded the maximum permissible limit of 5%, as expected, since the THD factor becomes inversely proportional to the output active power of the PV inverters. Nevertheless, THD is notably reduced as the output active power of the PV Inverters increases and reaches its nominal value. |
References
|
- CENELEC (European Committee for ElectrotechnicalStandardisation), 1994.Voltage characteristics of electricity supplied by publicdistribution systems.European Norm EN 50160.
- International Electrotechnical Commission (IEC), 2004. IEC 61727: Photovoltaic (PV) systems – Characteristics of the utility interface.
- International Electrotechnical Commission (IEC), 2000. Electromagnetic compatibility (EMC) Part 3-2: Limits for harmonic current emission(equipment input current < 16 A per phase), IEC 61000-3-2.
- International Electrotechnical Commission (IEC), 2003. Electromagnetic compatibility (EMC) Part 3-12: Limits for harmonic currentsproduced by equipment connected to public low-voltage systems with input current < 75 A per phase, IEC 61000-3-12.
- Papaioannou, I. T., Alexiadis, M. C., Demoulias, C. S., Labridis, D. P., Dokopoulos, P. S., 2011. Modeling and Field Measurements ofPhotovoltaic Units Connected to LV Grid. Study of Penetration Scenarios.IEEE Transactions on Power Delivery 26 (2).
- G.A. Vokas, A.V. Machias, 1995. Harmonic voltages and currents on two Greek islands with Photovoltaic stations: Study and FieldMeasurements, IEEE Trans. on Energy Conversion, Vol. 10, No.2, June 1995.
- Schlabbach, J., 2008. Harmonic current emission of photovoltaic installations under system conditions. Proceedings 5th InternationalConference European Electricity Markets, Lisbon, Portugal, 2008, pp. 1-5.
- Patsalides, M., Evagorou, D., Makrides, G., Achillides, Z., Georghiou, G., Stavrou, A., Efthimiou, V., Zinsser, B., Schmitt, W., Werner, J.,2007.The Effect of Solar Irradiance on the Power Quality Behaviour of Grid Connected Photovoltaic Systems. Proceedings InternationalConference on Renewable Energy and Power Quality, Sevilla, Spain, 2007, pp. 1-7.
- Haeberlin, H.; Kaeser, F.; Liebi, C.; Beutler, C., 1995. Results of recent performance and reliability testes of the most popular inverters for gridconnected PV systems in Switzerland. 13th EU PV conference on photovoltaic solar energy conversion. Nice, France, 1995.
- Haeberlin, H.; Liebi, C.; Beutler, C., 1997. Inverters for grid connected PV systems: test results of some new inverters and latest reliability dataof the most popular inverters in Switzerland. 14th EU photovoltaic solar energy conference. Barcelona, Spain, June-July 1997.
- Chicco, G.; Schlabbach, J.; Spertino, F. 2009.Experimental assessment of the waveform distortion in grid-connected photovoltaic installations.Solar Energy, 83, 1026-1039, February 2009.
- P.N. Korovesis, G.A. Vokas, I.F. Gonos, F.V. Topalis, 2004. Influence of large scale Installation of energy saving lamps on the line voltagedistortion of a weak network supplied by photovoltaic station, IEEE Transactions on Power Delivery, Vol. 19, No4, October 2004.
- Sidrach-de-Cardona, M. &Carretero, J. 2005.Analysis of the current total harmonic distortion for different single-phase inverters for gridconnectedpv-systems.Solar Energy Materials and Solar Cells, 87, 529-540.
- Enslin, J.H.R.; Hulshorst, W.T.J.; Atmadji, A.M.S.; Heskes, P.J.M.; Kotsopoulos, A.; Cobben, J.F.G.; Van der Sluijs, P. 2003. Harmonicinteraction between Large Numbers of Photovoltaic Inverters and the distribution Network.IEEE Power Tech Conference. Bologna, Italy, June2003.
- Rooij, P.M., Heskes, P.J.M. 2004. Design qualification of inverters for grid-connected operation of photovoltaic power generators. DutchGuidelines, ECN-C-04-032, 2nd Edition.
- Fluke Power Analyzer 434, Manual. [online]. Available from: http://assets.fluke.com/manuals/434_435_umeng0300.pdf
|