Research & Reviews: Journal of Pharmaceutical Analysis
e-ISSN: 2320-0812
e-ISSN: 2320-0812
Muhammad Zubair*
Department of Pharmaceutical Analysis, Capital University of Science and Technology, Islamabad, Pakistan
Received: 17-Jun-2022, Manuscript No. JPA-22-70844; Editor assigned: 21-Jun-2022, Pre QC No. JPA-22- 70844 (PQ); Reviewed: 05-Jul-2022, QC No. JPA-22-70844; Revised: 12- Jul-2022, Manuscript No. JPA-22- 70844 (R); Published: 20-Jul-2022, DOI: 10.4172/2320-0812.11.3.003.
Visit for more related articles at Research & Reviews: Journal of Pharmaceutical Analysis
Product Quality Review (PQR) is core function of Pharmaceutical Quality System (PQS). Purpose of this review is to verify the consistency of manufacturing process, verify the appropriateness of specifications for the testing and analysis of both starting materials and finished goods, highlight any adverse quality trends and identify any product and process improvement. As per current guidance the manufacturer has to perform these reviews annually and where small number (statistically invalid) number of batches is manufactured review may be extended up to 2 years. The contents of PQR shall be designed in such a way that these are able to capture product quality events and thoroughly document any potential impact on process or system as a whole that enables to investigate any event i.e. failure or rejection. In order to identify the trends in process an appropriate statistical method shall be used i.e., use of control charts, process capability and other related statistical tools. WHO, USFDA, TGA Australia, EU and PICS have issued specific guidelines regarding PQR and its content. More or less the requirement by all these bodies is same and focus is on continuous improvement of process and product quality throughout the product lifecycle.
Product Quality Review (PQR); Data analysis; Pharmaceutical system; Validation; Organization
This article will give brief overview of regulatory aspects requirements for conducting Product Quality Review of pharmaceutical product, importance of PQR throughout the product lifecycle and practical approach for statistical data analysis. Product quality review is an evaluation conducted at regular periodic or rolling quality reviews of all registered medicinal products, including export only products (products that are only manufactured for export other than of local market). The purpose of this review is to bring assurance in robustness and consistency of manufacturing process of product, to verify the suitability of specifications adopted for the testing of both starting materials, identify the trends if any in order to improve the manufacturing process or related process steps. It is an effective quality improvement tool to enhance the consistency of manufacturing process and overall quality of the product.
It will capture broader review of product data and capturing trends will help determine the defects and possible improvements of the methods and Process. Where no significant changes have been made to the system or manufacturing process, and a quality review confirms that the system or process is consistently producing material meeting its specifications, there is normally no need for revalidation [1-4].
Significance of product quality review
PQR can play a vital role in different aspects of product quality and lifecycle some of which are mentioned as under:
• Serves as a tool for continuous process verification if being conducted on regular basis as it will give the assurance of consistency of manufacturing process of product.
• Manufacturer can easily identify the quality and defects of process along with process improvement.
• Manufacturer can easily identify the losses in process and find a way out to reduce and eliminate the process losses hence PQR can serve as tool of cost reduction.
• Manufacturer can assess the quality of starting materials i.e., both raw and packaging.
• It assures the state of control in process i.e., by trending of data one can easily identify the state of control.
• Serves as a tool of investigation and to identify the actual root cause of problem i.e. If any of the batches is failed, then it is also included in the Product Quality Review to determine reasons for the batch rejection.
Relationship of product quality review with quality management system
PQR is now a day has become a tool for continuous process improvement in QMS. PQR becomes an integral part of QMS as by help of this state of control of process is assured. PQR provides an opportunity to review the performance annually perhaps more important, it provides an opportunity to understand what the figures mean and the significance of any changes.
In short, the PQR in a QMS will provide organization an overview of the produced batches and the products introduced to the market, an overview of the complaints, recalls, etc. (any quality related issues) and other related subjects.
The requirements for data collection and evaluation in PQR are almost same in all the guidance documents i.e. USFDA, WHO, TGA Australia, PICS and EMA etc. Figures 1 and 2 illustrate the major requirements of PQR that are to be taken into account during PQR.

Figure 1: Regulatory requirements and expectations from Annual Product Review (APR)/Product Quality Review (PQR).

Figure 2: Requirements of Product Quality Review.
Normally these are conducted annually on rolling basis, where a small number of batches of products have been manufactured; review can be extended to 2 years or more years.
Aspects of data that is to be gathered and reviewed in PQR as per guidance document
While compiling the data of PQR there is always a question in mind of manufacturer what are the expectations of regulators and how data will be presented and summarized in PQR? So, below table will summarize the most common aspects of PQR that are to be included and presented in Table 1.
| Parameter to be reviewed in PQR | Details to be included in PQR |
|---|---|
| Starting Materials i.e., raw material and packaging material | Out-of-Specification (OOS) and Out-of-Trend (OOT) results |
| Deviation reports | |
| Rejected materials and supplier corrective action requests | |
| Vendor assurance of new suppliers | |
| Critical in-process control and FPP Results | Review of trends for deviations. |
| If there is a trend identified then performs a root cause analysis. | |
| Perform a root cause analysis | |
| All batches that failed to meet acceptance criteria | Review any failed batches that resulted in an OOS, deviation, incident or non-conforming product |
| All significant deviations and non-conformances | The number of unplanned and planned events (deviations and incidents), non-conformances, out-of-specifications out-of-trends and number of batches manufactured or released or rejected (and reason for rejection) |
| Number of repeat events (planned and unplanned). | |
| Evaluate corrective actions and their effectiveness. | |
| All changes carried out to process and analytical method | Change controls to manufacturing processes or analytical methods |
| Validation requirements derived from changes to analytical methods, process validation. | |
| Impact of changes to ongoing stability. | |
| Marketing authorization variations submitted. | Review and evaluate the reason for changes to product entries |
| Review and evaluate the reason for changes to labels | |
| Review internal change control process | |
| Results of the stability monitoring program | Review stability results relating to product or product grouping |
| Review OOS and OOT investigations relating to stability testing | |
| Quality related returns, complaints and recalls | Review the number of returns, complaints and recalls |
| Review significant trends and corrective actions implemented as part of the analysis relating to product quality issues | |
| Previous product process or equipment corrective actions | Review CAPA logs for process and equipment issues |
| Ensure that corrective and preventative actions have not introduced new risks for the products or process | |
| New marketing authorizations and variations to marketing authorizations | Review new marketing authorizations and variations to ensure that each step of manufacture is carried out by a manufacturer licensed to complete that step |
| Qualification status of relevant equipment and utilities. | Review the summary of validation master plan schedules, which will show current status of all equipment in the manufacturing and packaging facilities. |
| Review of any contractual arrangements | Provide a summary table of third-party contractors used and GMP and technical agreement status |
| Review GMP and technical agreements to ensure they are in place and current. Include any changes made since previous PQR |
Table 1. Summarize the most common aspects of PQR.
Statistical interpretation of data
Analysis of data using control charts: Analysis of data for all the parameters i.e., of starting materials and finish product testing is very important aspect of PQR. Most of the times the data analysis is done via using control charts. These charts help to identify the common cause variation and special cause variation in the process and also identify the variability in the process. So during the review of data interpretation of control charts variation is of utmost importance, as on the basis of these variations further CAPA is to be taken. During review following type of variations are observed and these are indicators of special cause of variation or common cause variations.
• One or more point falls out of the control limits.
• When control chart is divided into zones as below any of the following points are true:
• Two points, out of three consecutive points, are on the same side of the average in Zone A or beyond
• Four points, out of five consecutive points, are on the same side of the average in Zone B or beyond.
• Nine consecutive points are on one side of the average.
• There are six consecutive points, increasing or decreasing.
• There are fourteen consecutive points that alternate up and down.
• There are fifteen consecutive points within Zone C (above and below the average).
Use of process capability as tool to identify the inherent variation in process
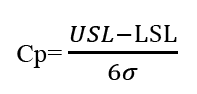
The process Capability (Cp) measures any inherent variation of product turned out by a process and gives information about the corresponding level of defects, assuming that the process average is midway between the specification limit [5,6]. The standard formula of process capability is given below:
The process Capability Index (CpK) measures potential process capability, assuming that the process average is equal to the midpoint of the specification limit and the process is operating under statistical control. The formula for calculating CpK has two elements, Cpu and Cpl, that factor into the upper and lower CpK, respectively. CpK is estimated as
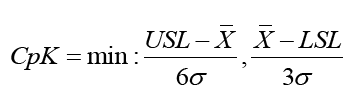
Where;
min=minimum value will be taken
USL=Upper Specification Limit
LSL=Lower Specification Limit
σ=Standard Deviation
The calculated value of Cp and CpK can be used to estimate sigma process capability on the basis of the values given in Table 2.
| Sigma level | Cp | PPM |
|---|---|---|
| 3 | 1.00 | 2700 |
| 4 | 1.33 | 63 |
| 5 | 1.67 | 0.57 |
| 6 | 2.00 | 0.002 |
Table 2. To estimate sigma process capability on the basis of the values.
Measure to assure state of control in process
In order to assure process stays in state of control below are some suggestions that may be implemented as per the nature of root cause identified and problem.
1. The initial action may be to increase inspection levels i.e., a risk analysis approach may be used along with a statistical model e.g., control charts and process capability analysis to ensure that confidence with respect to the quality of output product is increased.
2. Clearly, quality cannot be inspected into a product or process; therefore, the next steps will be to look at how to improve the capability of the process. Remember, this can also include reviewing the product specifications, and look into the solution with help of design space and guidance laid out in ICH Q8.
3. Then looking at the process itself, there will be a need to identify the sources of variation. Is it due to raw materials, human factors, environmental, equipment variation, test method variation? You may need to set-up an SPC control process, perform some form of experimental design, instigate staff retraining, commence a review of operating procedures, review equipment calibration or preventative maintenance programs, etc.
In PQR every year thorough review of all the batches manufactured is done and in case of any failure an instant RCA is done and CAPA is taken to assure that process stays in state of control. PQR is a productive tool for organization as it reduces the chances of results going out of specification and it reduces the chances of reprocessing/reworking and eventually cost reduction and process improvement is attained. PQR is core element of QMS that is performed for all the products that were manufactured in a year to verify the consistency of manufacturing process and appropriateness of specifications. Overall, this article will help readers understand the importance of PQR, how to analyse data statistically with application of tools like SPC and Process Capability and also how handle the variations of process.