Keywords
|
| Artificial Bee Colony Algorithm; Improved Pre-prepared Power Demand table; Nodal Ant Colony optimization; Parallel Artificial Bee Colony Algorithm; Profit Based Unit Commitment and deregulation. |
INTRODUCTION
|
| In 1996, Federal Energy Regulatory Commission (FERC) of the United States of America has implemented the Energy Policy Act of 1992 by issuing Orders No.888 and No.889. Order 888 mandated all public utilities who own transmission to file Open Access non-discriminatory Transmission Tariffs (OATTs) and permitted public utilities and transmitting utilities to seek recovery of stranded costs. In Order No.888, FERC also recommended establishing Independent System Operators (ISOs) to monitor the reliability of the power system and coordinate the supply of electricity in each region. Order No.889 initiated the Open Access Same-Time Information System (OASIS) and standards of Conduct, which requires utilities to open information about their available transmission capacity, price and access to transmission services non-discriminatorily. Additionally, the historical structure of power system whereby a vertically integrated utility that owned generating plants, HV transmission system, and distribution lines as well as provided all electric services was required to be changed [13]. Obligatorily, all vertically utilities into the restructured regions needed to separate their assets and services into generation, and retail sales. Therefore, a distinction can be made between generation companies (GENCOs), transmission companies (TRANSCOs), distribution companies (DISCOs), and load serving entities (LSEs). The power industry became more competitive and more regionalized. Some regions are organized by an Independent System Operator (ISO) or a Regional Transmission Organization (RTO) which was established by FERC in Order No.2000. the main roles of the ISOs and RTOs are to perform transmission planning, ensure wholesale power grid reliability as well as equal access to the grid, and economically balance electricity demand and supply. |
| Unit Commitment is a complex optimization problem of determining the schedule of generating units within a power system subject to all prevailing constraints [2]. In deregulated power system, the unit commitment problem (UCP) has a different objective than that of UCP in a traditional system. Previously, electric utilities had an obligation to serve their customers that all demand and spinning reserve must be completely met. But this is not necessary in the restructured system and generation companies can now consider a schedule that produces less than the predicted load demand and reserve but creates maximum profit. This problem is referred as Profit Based Unit Commitment (PBUC) problem. Under restructured environment, the individual GENCOs run its unit commitment in order to maximize their own profit [16]. In this profit based unit commitment, demand forecasts and expected market prices are important inputs to determine how much power should be offered on market for achieving maximum profit. |
| Mathematically, the PBUC problem is a mixed integer and continuous nonlinear objective optimization problem. Previous efforts for solving PBUC were based on conventional methods such as dynamic programming and LR methods. Recently, GA[4] have been used to solve the PBUC problem. Chandram et al.[5] proposed Muller method and IPPD table to solve PBUC problem. Raglend et al. [17] demonstrated the application of PSO technique to maximize the GENCOs profit. |
| The focus of this paper is to develop an accurate and comprehensive model for the profit-based thermal UC that yield feasible unit ON/OFF status for power generation companies. Improved Pre-prepared Power Demand(IPPD) table is used for UC and Artificial Bee Colony (ABC) algorithm is used for solving ED using MATLAB on a Pentium IV, 3GHZ personal computer with 512-MB RAM. The paper is organized in the following sections. The formulation of PBUC problem is introduced in section II. The description of the algorithm for solving PBUC problem is given in section III .Simulation results of the proposed approach for various generating units are presented in section IV. Conclusions are finally given in the last section. |
PBUC PROBLEM FORMULATION
|
| A. Nomenclature |
| PF : Profit of GENCOs |
| RV : Revenue of GENCOs |
| TC : Total cost of GENCOs |
| F(Pij) : Fuel cost function of jth generating unit at ith hour |
| Xij : ON/OFF status of jth generating unit at ith hour |
| Pij : Output power of jth generating unit at ith hour |
| SPi : Spot price at ith hour |
| ST : Start up cost |
| T : Number of hours |
| N : Number of generating units |
| PDi : Power demand at ith hour |
| Rij : Reserve jth generating unit at ith hour |
| min : Minimum output power of jth generating unit at ith hour |
| Pij max : Maximum output power of jth generating unit at ith hour |
| Tj on : Minimum time that the jth generating unit has been continuously online |
| Tj off : Minimum time that the jth generating unit has been continuously offline. |
| Tj up : Minimum up time of jth generating unit |
| Tj down : Minimum down time of jth generating unit |
| B. Objective function: |
| The objective function of PBUC is to maximize power company’s profit. |
| Max PF = RV-TC …………………..(1) |
 (2) (2) |
 (3) (3) |
| C. Constraints: |
| The objective function is subjected to the following constraints: |
| • Power demand constraint: In the PBUC problem, it is not necessary to allocate generating units to meet power demand. Therefore, the power balance constraint is modified as a power demand constraint. Here, the sum of output powers of allocated generating units is always less than the forecasted power demand. |
 ......(4) ......(4) |
| • Reserve constraint |
 (5) (5) |
| • Real power operating limit |
 (6) (6) |
| • Minimum up/down time constraint |
 (7) (7) |
 (8) (8) |
SOLUTION METHODOLOGY
|
| Solution of the PBUC problem is decomposed into the following steps. The PBUC problem involves an on and off decision for units depending on variations in power demand. |
| A. Formation of the IPPD table |
| A. Formation of the IPPD table |
| Step-1 Determine minimum and maximum values of λ for all generating units at their Pij min and Pij max for each units two λ values are possible. Then arrange these λ values in ascending order and index them as λj (where j= 1,2,…2N). |
| Step-2 Evaluate output powers {Pij = [(λj – bi)/2ci]} for all generators at each value. Incorporate Pij min and Pij max as below. |
| (i) Setting of the minimum output power limit |
 (9) (9) |
 (10) (10) |
| But, for must run generators |
 (11) (11) |
| (ii) Setting of the maximum output power limit |
 (12) (12) |
| Step-3 λ values, output powers and sum of output powers (SOP) at each λ are arranged in the table in ascending order of λ values. This table is known as the Improved Pre-prepared Power Demand (IPPD) table. |
| Salient features of the IPPD table are listed below |
| 1. The generating unit with the least lambda value is in the first row of the IPPD table. Minimum output power of the first generating unit is available and the output powers of the remaining units are zero in the first row. |
| Therefore, the available output power is the minimum output power of that generating unit with the least lambda. |
| 2. From the second row onwards, generating units are added in the IPPD table based on the ascending order of the lambda values of the generating units. |
| 3. On or Off states of the generating units are available in the IPPD table up to the addition of the last generating unit. |
| B. Formation of the RIPPD table |
| Profit is obtained only when the forecasted price at the given hour is greater than the incremental fuel cost of the given unit. Therefore, the forecasted price is taken as the main index to select the Reduced IPPD (RIPPD) table from the IPPD table. |
| There are two options to select the RIPPD table from the IPPD table. |
| Option 1: At the predicted forecasted price, two rows from the IPPD table are selected such the predicted forecast price lies within the lambda limits. Assume here that the corresponding rows are m and m+1. |
| Option 2: At the predicted power demand, two rows from the IPPD table are selected such that the predicted power demand lies within the Sum of Powers (SOP) limits. Assume here that the corresponding rows are n and n+1. |
| Therefore, the Reduced IPPD table is as follows: |
| (i) If m<n, then the RIPPD table is selected based on option1. Here, the power demand is modified as the SOP of m+1 row. In the PBUC problem, the power demand constraint is relaxed and it is not necessary to operate the generating units so as to meet power demand. |
| (ii)If m>n, then the RIPPD table is selected as option 2. |
| Once the RIPPD table is identified, the information about the Reduced Committed Units (RCU) table is generated by simply assigning +1 if the output power of the unit ‘i’ Pi ≠ 0 and 0 if Pi = 0. The RCU table will have binary elements indicating the status of all units. |
| Now, “incorporation of no-load cost”, “de-commitment of units” and “inclusion of minimum up time and minimum down time constraints” in the PBUC problem need to be addressed. |
| C. Incorporation of no load cost |
| Formulation of the IPPD table is based on incremental fuel costs(λ). Therefore, a no-load cost is not considered in the IPPD table. In the fuel cost data, some generating units may have huge no-load costs and less incremental fuel costs. Hence, incorporation of a no-load cost is needed to reduce the total fuel cost. |
| The priority List may not exactly reflect the actual status of the operation cost of medium load units because these units may operate at a lower output power than their maximum output power. This aspect may lead to a higher operational cost for medium units. |
| Step 1: Calculate the cost per MW at its average output-power between minimum and maximum output power limits. The cost per MW is taken as Cost index,i. |
 |
| This index exactly reflects the status of the operational cost of medium units at lower output power than the maximum output power. |
| Step 2: Arrange all units in ascending order of the Cost index,i |
| Step 3: Modify the initial commitment and input data of the units according to the ascending order of the Cost index,i. |
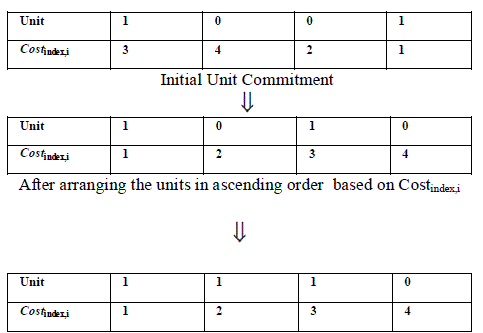
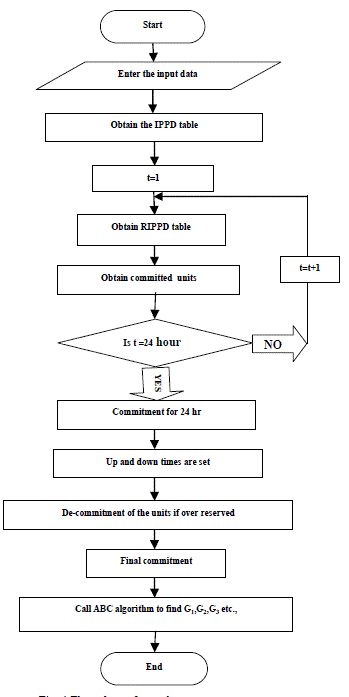
| Step 4: Last on-state unit at each hour is identified. Status of the units is changed as follows: If any unit on the left side of the last on-state unit is in an off state, then it is converted as an off state, then it is converted as an on-state unit. The complete mechanism of incorporating the No-load cost is shown in fig.1. |
| D. De-commitment of units |
| The committed units may have excess spinning reserves due to a greater gap between the selected lambda values in the RIPPD table. Therefore, de-commitment of units is necessary for getting more economical benefits. |
| When there is an excessive spinning reserve in hour‘t’, the following steps are used to De-commit the units. |
| Step-1: Identify the commitment units. |
| Step-2: De-commit the last ‘ON’ state unit in the Unit Commitment after incorporating the No-load Cost and check the spinning reserve. If the spinning reserve constraint is satisfied after de-commitment of the unit, then de-commit that unit. |
| Step-3: Repeated step-2 and de-commit possible units without violating the spinning reserve constraint. |
| E. Inclusion of Minimum up time and Minimum down time constraints |
| Minimum up and minimum down time constraints can be satisfied by adjusting the unit status. |
• Minimum Up time constraint
|
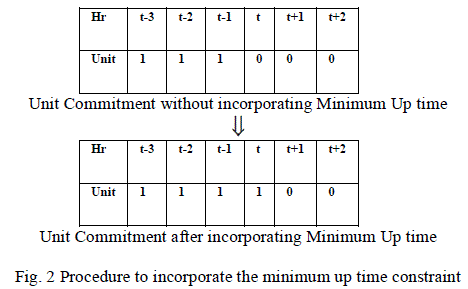
| If the on time of the unit is less than its’ up time, then that unit will be on. Assume that the minimum up time of the unit is 4 hours. Fig 2 depicts the procedure to incorporate the minimum up time constraint. |
• Minimum Down time constraint
|
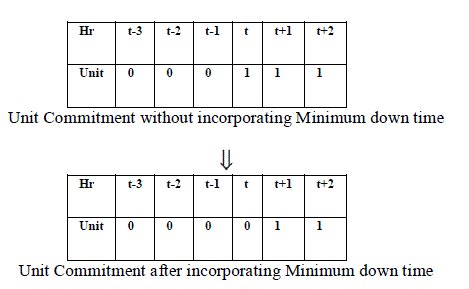
| If the off time of the unit is less than the minimum down time, then the status of that unit will be off in the committed unit table. Fig.3 provides the procedure to incorporate the minimum down time constraint. |
F. Artificial Bee Colony(ABC) for solving Economic Dispatch
|
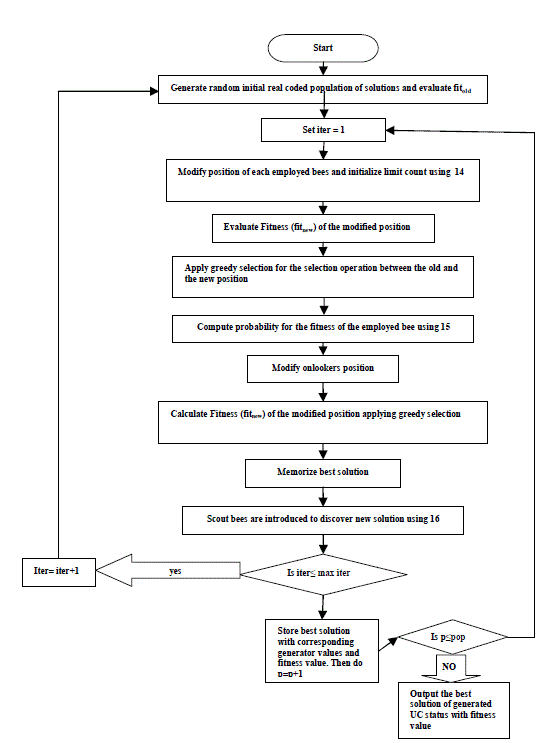
| Artificial Bee Colony(ABC) is one of the most recently defined algorithms by Dervis Karaboga in 2005, motivated by the intelligent behavior of honey bees. It is as simple as PSO and DE algorithms, and uses only common control parameters such as colony size and maximum cycle number. ABC as an optimization tool, provides a population-based search procedure in which individuals called foods positions are modified by the artificial bees with time and the bee’s aim is to discover the places of food sources with the high nectar amount and finally the one with the highest nectar. In ABC system, artificial bees fly around in a multidimensional search space and some (employed and onlooker bees) choose food sources depending on the experience of themselves and their nest mates, and adjust their positions. Some (scouts) fly and choose the food sources randomly without using experience. If the nectar amount of a new position is higher than that of the previous one in their memory, they memorize the new position and forget the previous one. Thus, ABC system combines local search methods, carried out by employed and onlooker bees, with global search methods, managed by onlookers and scouts, attempting to balance exploration and exploitation process. |
| The model consists of three essential components: employed and unemployed foraging bees, and food sources. The first two components, employed and unemployed foraging bees, search for rich food sources, which is the third component, close to their hive. The model also defines two leading modes of behavior which are necessary for selforganizing and collective intelligence: recruitment of foragers to rich food sources resulting in positive feedback and abandonment of poor sources by foragers causing negative feedback. |
| i. Food Sources: In order to select a food source, a forager bee evaluates several properties related with the food source such as its closeness to the hive, richness of the energy, taste of its nectar, and the ease or difficulty of extracting this energy. |
| ii. Employed foragers: An employed forager is employed at a specific food source which she is currently exploiting. She carries information about this specific source and shares it with other bees waiting in the hive. The information includes the distance, the direction and the profitability of the food source. |
| iii. Unemployed foragers: A forager bee that looks for a food source to exploit is called unemployed. It can be either a scout who searches the environment randomly or an onlooker who tries to find a food source by means of the information given by the employed bee. The mean number of scouts is about 5-10%. The main steps of the algorithm are as follows: |
| • Initialization phase |
| • REPEAT |
| • Employed Bees Phase→Place the employed bees on their food sources |
| • Onlooker Bees Phase→ Place the onlooker bees on the food sources depending on their nectar amounts |
| • Scout Bees Phase→ Send the scouts to the search area for discovering food sources |
| • Memorize the best solution achieved so far |
| • UNTIL (Cycle=Maximum Cycle Number or a Maximum CPU time) |
| ïÃÆÃË Pseudo-code of the ABC algorithm |
| 1. Initialize the population of solutions Xi, i= 1,2,….,SN |
| 2. Evaluate the population |
| 3. Cycle = 1 |
| 4. REPEAT |
5. Produce new solutions Vi for the employed bees by using  (14) Where kïÃÆÃŽ{1,2,…….SN} and j ïÃÆÃŽ {1,2,……D} are randomly chosen indexes and (14) Where kïÃÆÃŽ{1,2,…….SN} and j ïÃÆÃŽ {1,2,……D} are randomly chosen indexes and 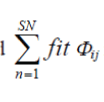 is a random number between [-1,1]. is a random number between [-1,1]. |
| 6. Apply the greedy selection process for the employed bees. |
7. Calculate the probability values  (15) (15) |
| 8. Produce the new solutions Vi for the onlookers from the solutions Xi selected depending on pi and evaluate them. |
| 9. Apply the greedy selection process |
| 10. Determine the abandoned solution for the scout, if exists, and replace it with a new randomly produced solution Xi |
 (16) (16) |
| 11. Memorize the best solution achieved so far. |
| 12. Cycle = Cycle + 1 |
| 13. UNTIL cycle = MCN |
TEST CASES AND SIMULATION RESULTS
|
| The proposed approach has been implemented in MATLAB and executed on a Pentium IV (3 GHz) personal computer with 512MB RAM. The proposed method has been tested on 10 generating unit system to solve profit based unit commitment problem. Simulation results of the proposed algorithm were compared in terms of profit with traditional unit commitment method and heuristic methods such as TS-IRP algorithm. |
| Example: Here, a 10 generating unit system is considered. The fuel cost data of this system was obtained from [1] and given in Table 1. |
| Initially lambda values(λ) are calculated at their minimum and maximum output powers of the generating units, then lambda values at minimum output powers of the units are arranged in ascending order and finally the fuel cost functions of generating units are rearranged based on the ascending order of the lambda values at minimum output powers. All lambda values, the output powers are evaluated and IPPD table is formulated and given in table 4. The dimension of IPPD table is 20 X 12. |
| Assume forecasted price of 22$/MW and power demand of 750MW. At predicted power demand, two rows from the IPPD table are selected such that the predicted forecasted demand lies within the SOP limits. This table is called RIPPD table and is given in Table 4. |
| First row of RIPPD gives the initial information of committed units. Further the commitment of units can be modified as follows: If the predicted forecasted price is less than the lambda at maximum output power of the generating unit, then that corresponding unit will be off. After getting the information of committed units, ED problem is solved using Artificial Bee Colony algorithm. The final solution is given in table 5. |
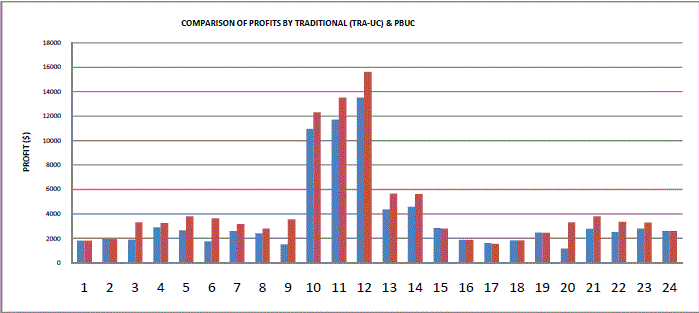
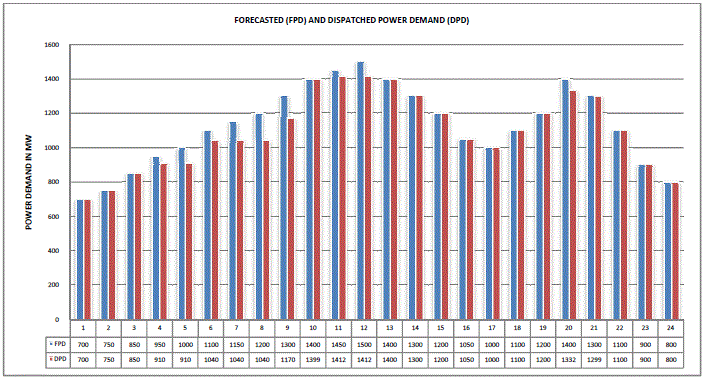
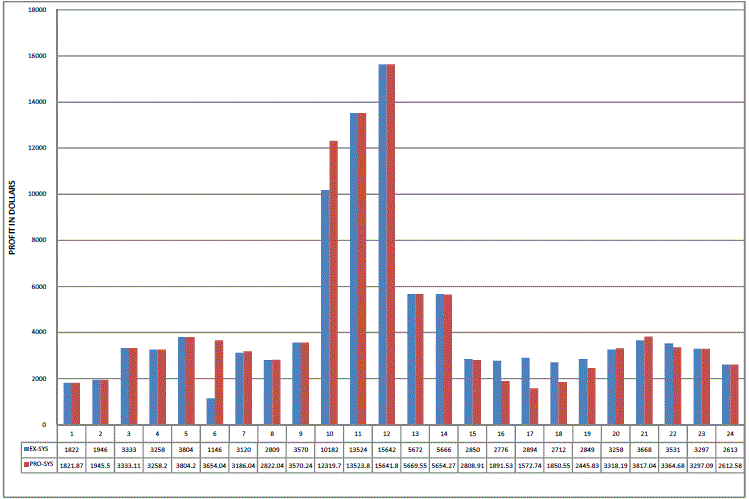
| The profits obtained by PBUC are compared with Traditional UC and shown in fig.6. Forecasted and dispatched power demands are compared in fig.7.Profits obtained using proposed and existing methods are compared in fig.8. |
| From fig.6, it is clear that PBUC provides more profit for GENCOs compared to Traditional UC. |
| From fig.7, it is clear that the forecasted and dispatched power demand were not equal thus satisfying PBUC constraint. |
| From fig.8, it is clear that the profit obtained using IPPD table and Artificial Bee Colony (ABC)[proposed system] is more than that obtained using NACO and PABC (existing system) algorithm. |
CONCLUSION
|
| A new approach using IPPD table and Artificial Bee Colony (ABC) has been proposed in this paper for solving Profit Based Unit Commitment (PBUC). While solving the PBUC problem, the information of forecasted price is known. The PBUC problem is solved in two stages in the proposed approach. Initially, information regarding the committed units is obtained by framing IPPD table and finally Artificial Bee Colony (ABC) is used to find the non-linear programming sub-problem of Economic Dispatch. Simulation results for the proposed method have been compared with existing methods and also with traditional unit commitment. It is observed from the simulation results that the proposed algorithm provides maximum profit compared with existing methods and is thus amenable for the real-time operation required in a deregulated environment. |
ACKNOWLEDGMENT
|
| The authors would like to thank the reviewers for their constructive suggestions which have helped to enhance the quality of this manuscript. |
Tables at a glance
|
 |
 |
 |
 |
 |
| Table 1 |
Table 2 |
Table 3 |
Table 4 |
Table 5 |
|
Figures at a glance
|
 |
 |
 |
 |
| Figure 1 |
Figure 2 |
Figure 3 |
Figure 4 |
 |
 |
 |
 |
| Figure 5 |
Figure 6 |
Figure 7 |
Figure 8 |
|
References
|
- C. Christopher Columbus, Sishaj P. Simon, “ Profit based unit commitment for GENCOs using parallel NACO in a distributed cluster”,Swarm and Evolutionary Computation, vol. 10,p. 41-58, 2013.
- Narayana Prasad Padhy, “Unit Commitment-A Bibliographical Survey”, IEEE Transactions on Power Systems, vol. 19, No. 2, May 2004.
- PathomAttaviriyanupap, Hiroyuki Kita, Eiichi Tanka and Hasegawa, “A hybrid LR-EP for solving new profit based UC problem undercompetitive environment”, IEEE Transactions on Power Systems, vol, 18. No. 1, p. 229-237, 2003.
- Charles W. Richter, Gerald B. Sheble, “A Profit based unit commitment GA for competitive environment”, IEEE Transactions on PowerSystems, vol. 15, No. 2, p. 715-721, 2000.
- K. Chandram, N. Subrahmanyam, M. Sydulu, “Improved Pre-prepared power demand table and Muller’s method to solve the profit based unitcommitment problem”, Journal of Electrical Engineering and Technology, vol. 4 No. 2, p. 159-167, 2009.
- C.Christopher Columbus, Sishaj P. Simon, “ A profit based unit commitment: a parallel ABC approach using a workstation cluster”,Computers and Electrical Engineering, vol. 38, No. 3 p. 724-745, 2012.
- C. Christopher Columbus, K. Chandrasekaran, Sishaj P. Simon, “ Nodal ant colony optimization for solving profit based unit commitmentproblem for GENCOs”, Applied Soft Computing, vol. 12, No. 1, p. 145-160, 2012.
- Shahidehpour M., HatimYamin and Zuyi Li, “Market Operations in Electric Power Systems: Forecasting, Scheduling, and RiskManagement”, The Institute of Electrical and Electronics Engineers, Inc., New York.
- A.J. Wood, B.F. Wollenberg, “Power Generation Operation and control”, 2nd ed., New York: John Wiley & Sons, Inc., 1996.
- M. Shahidehpour and M. Marwali, “Maintenance Scheduling in Restructured Power Systems”, Kluwer Academic Publishers, NorwellMassachunetts, 2000.
- E.H. Allen and M.D. Ilic, “Reserve Markets for Power Systems Reliability”, IEEE Trans., on Power Systems, vol. 15, No. 1, p. 228-233,2000.
- DervisKaraboga, BahriyeAkay, “ A comparative study of Artificial Bee Colony algorithm”, Applied Mathematics and Computation, p. 108-132, 2009.
- K. Bhattacharya, M.H.J. Bollen and J.E. Daalder, “ Operation of Restructured Power Systems”, Kluwer Academic Publishers.
- D. Karaboga, B. Basturk, “ Artificial Bee Colony Optimization algorithm for solving constrained optimization problems”,IFSA ’07proceedings of the 12th International fuzzy systems association world congress on foundations of fuzzy logic and soft computing, p. 789-798,2007.
- P. Shivsankari and VikasDubey, “ A practical approach for profit based unit commitment in deregulated electricity market”, InternationalJournal of Advanced Research in Computer Science and Software Engineering”, vol. 3, No. 5, p. 347-352, 2013.
- M. Bavafa, N. Navidi, H. Monsef, “ A new approach for profit based unit commitment using Lagrangian relaxation combined with ant colonysearch algorithm”, In proceedings of IEEE UPEC 2008, p. 1196-1205.
- C. Jacob Reglend, G. Raghuveer, RakeshAvinash, N.P. Padhy, D.P. Kothari, “ Solution to PBUC using particle swarm optimization”, Appl.Softcomput., p. 4687-4699, 2010.
|