Keywords
|
| Computer vision; Quality; Image processing; Oryza sativa L; ISEF edge detection; Combined measurements. |
INTRODUCTION
|
| In this hi-tech uprising, an agricultural industry has become more intellectual and automatic machinery has replaced the human efforts [1]. In India to overcome the need of ever-increasing population it is necessary to make advancement in agricultural industry. Due to automation need of high quality and safety standards achieved with accurate, fast and cost effective quality determination of agricultural products[15]. Quality control is of major importance in the food industry because after harvesting, based on quality parameter a food product has been sorted and graded in different grades. Traditionally quality of food product is defined from its physical and chemical properties by human sensory panel which is time consuming, may be varying results and costly[14]. |
| Machine vision is one of the important advanced technological field where significant developments have been made[6,10].Machine vision attempts to impersonate sensory perception of human beings viz. vision, touch, smell, taste, hearing etc [1]. Efforts are being geared towards the replacement of traditional human sensory panel with automated systems, as human operations are inconsistent and less efficient [8]. Scientists have successfully endowed computers with machine vision by digital cameras and machines.[4] Extreme research is in progress all over the country on application of electronic eye and nose in food, beverage and agricultural industry [20].Many industries have come up with the same but its quite costly. |
| Oryza Sativa L(Rice) is a vital worldwide agriculture product. It is one of the leading food crops of the world as more than half of the world’s population relies on rice as the major daily source of calories and protein[8]. Rice (Oryza sativa L) is cultivated in several countries such as India, China, Indonesia, Bangladesh and Thailand which are considered as the major producers. India is the world’s 2nd largest producer and consumer country of rice for a very long time. |
| This paper presents a solution to the problem faced by Indian Rice industry. Section 2 discusses the Particular problem of quality evaluation of Masoori Rice seed (Oryza sativa L). Section 3 talks about the materials and methods proposed for calculating parameters for the quality of rice seeds (Oryza sativa L).The proposed system and proposed algorithm for computing Rice seed (Oryza sativa L)with long seed as well as small seed being present in the sample is also discussed in the same section. Section 4 discusses the quantification for the quality of rice seeds based on image processing and analysis. Section 5 discusses results based on quality analysis. Section 6 provides the conclusion of the proposed process. |
PROBLEM DEFINITION
|
| In agricultural industry quality assessment of product is main problem. Nowadays, the quality of grain seed has been determined manually through a visual inspection by experienced technicians. So it requires high degree of accuracy to satisfy customer need of high level of quality as well as correctness for a non-destructive quality evaluation method which is proposed based on image processing [4,12]. |
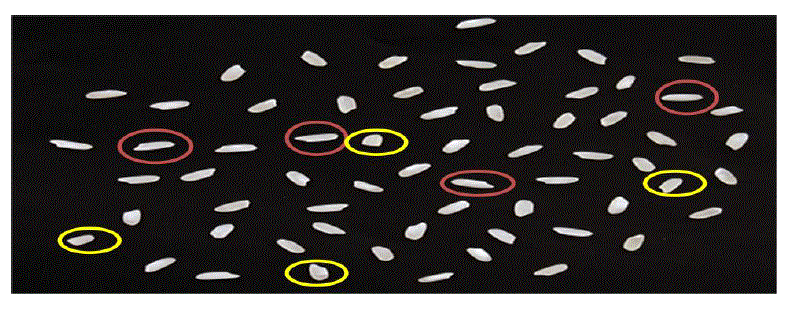
| Masoori rice(Oryza sativa L) seed contains foreign elements in terms of long as well as small seed. As shown in Figure 1 the red colored circles are long and yellow colored ones are too small.These seeds are having very much importance in quantifying quality. At the time of processing these seeds are removed. Proper removal of this seed is necessary if it is not so then it creates degradation in quality of rice seed. This paper proposes a new method for counting the number of Masoori rice (Oryza sativa L) seeds with these foreign elements using computer vision non destructive technique based on combined measurement techniques to quantify the quality of Masoori rice(Oryza sativa L) seeds. |
MATERIALS AND METHODS
|
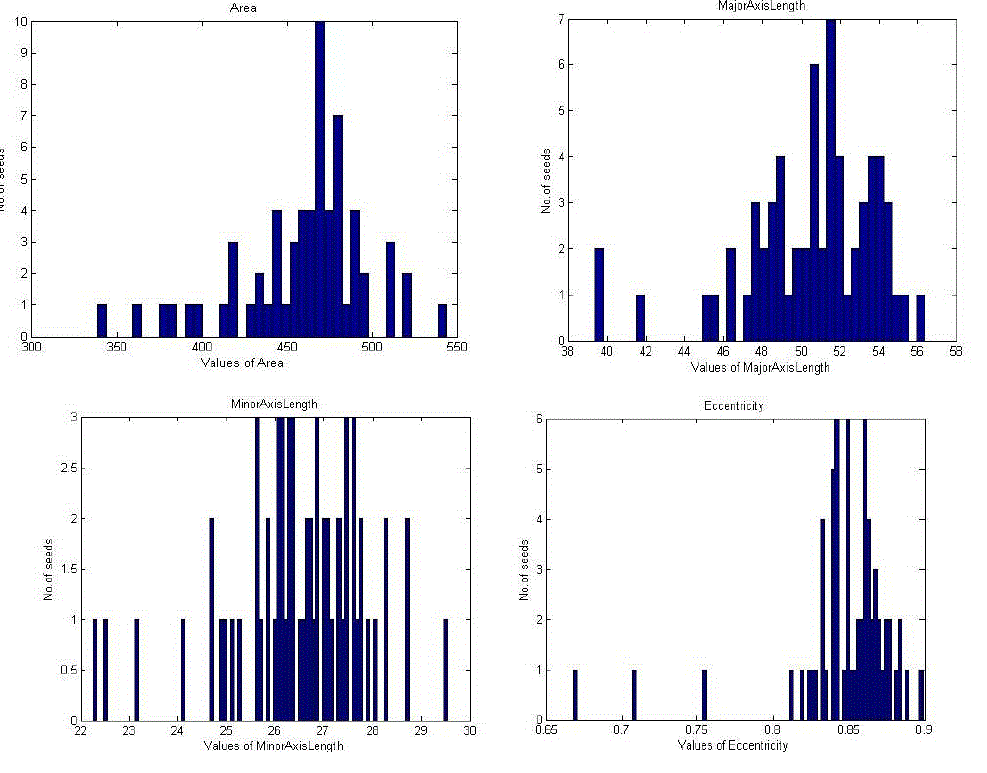
| In this section we discuss the proposed algorithms. Here we have used different varietal samples of Masoori rice. we define quality based on the combined measurement technique. we use area, major axis length, minor axis length and eccentricity of rice seed for counting the number of Masoori rice (Oryza sativa L) seeds with long seeds, normal seeds as well as small seeds. |
System Description and Operating Procedure
|
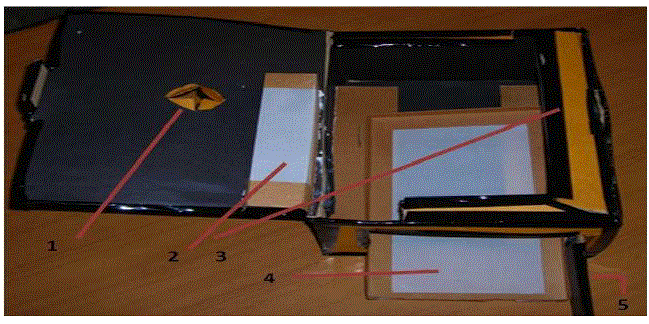
| A schematic diagram of the proposed system is in Figure 2.In our proposed system there is a camera which is mounted on the top of the box at point 1. The camera is having 12 mega pixels quality with 8X optical zoom. After capturing images of rice seed by camera is stored for further processing. To evade problem of illuminance and for good quality of image, we used two lights at point 2 and 3. We can also use butter paper for uniform distribution of light on the tray. In our system box contains opening which can be seen at point 4. At point 5 which is a tray in which rice seeds will be inserted for capturing an image[16]. |
| The simplicity of operation of system can be concluded from the operating procedure detailed in Table 1. |
Proposed algorithm to detect rice seeds with long and small seeds:
|
| According to our proposed algorithm as in Table 2, first capture image of sample spread on the black or butter paper using camera. This image is color image so we convert it in to gray scale image as the color information is not of importance. The identification of objects within an image is a very difficult task. One way to make straightforward the problem is to use optimal edge detector, ISEF, for extracting edges of gray scale image. This phase identifies individual object boundaries and marks the centre of each object for further processing. Thresholding is used to convert the segmented image to a binary image. The output binary image has values of 1 (White areas) for all pixels and 0 (black) for all other pixels. |
ISEF Edge Detection
|
| The edge can be detected by any of template based edge detector but Shen-Castan Infinite symmetric exponential filter based edge detector is an optimal edge detector like canny edge detector which gives optimal filtered image[18]. First the whole image will be filtered by the recursive ISEF filter in X direction and in Y direction. Then the Laplacian image can be approximated by subtracting the filtered image from the original image. For thinning purpose apply non maxima suppression as it is used in canny for false zero crossing. The gradient at the edge pixel is either a maximum or a minimum. Now gradient applied image has been thinned, and the problem of Streaking can be eliminated by thresholding with Hysteresis. Finally thinning is applied to make edge of single pixel. The ISEF algorithm is given inTable3. |
| In Figure 3(a) normal rice seed of good quality is shown, while Figure 3(b) and Figure 3(c) contains an image of a long seed and small seed. After applying the Edge detection operation, we get images of Figures 4(a) ,(b) and (c) respectively. |
Parameter Calculation
|
| Here we are extracting four parameters area, major axis ,minor axis length and eccentricity for differentiating normal rice seed from long seed as well as small seed. |
| “The area (A) of any object in an image is defined by the total number of pixels enclosed by the boundary of the object.” |
| “The major axis length ( N) of an image is defined as the length (in pixels) of the major axis of the ellipse that has the same normalized second central moments as the region.” |
| “ The minor axis length (M) of an image is defined as the length (in pixels) of the minor axis of the ellipse that has the same normalized second central moments as the region.” |
| “The eccentricity is the ratio of the distance between the foci of the ellipse and its major axis length. The value is between 0 and 1.” |
| For Area calculation, we define area of a normal seed is A, area of long seed is B and area of small seed is C. Area A is having a normally less value then area B and area C is having a less value than area A. Use of Vernier caliper for quality evaluation by human inspector can be replaced by Major axis, Minor axis calculation. For eccentricity calculation a long seed is having bigger value than the normal seed and small seed. |
| Diagram for histogram for area, Major axis length ,Minor axis length and Eccentricity calculation computed from sample is shown in Figure 5 (a) -to-(d). |
RESULT ANALYSIS
|
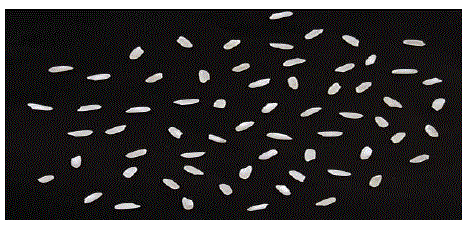
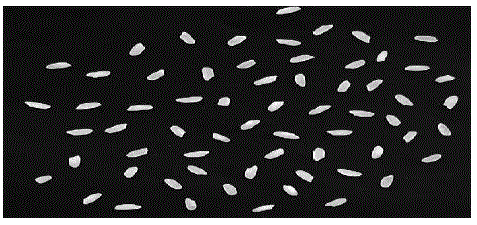
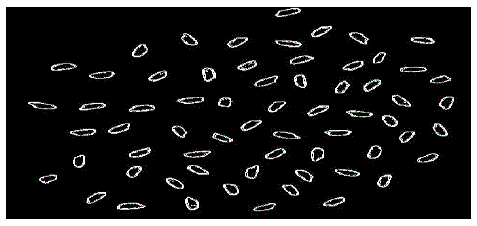
| Classification of Rice Seeds can be done based on assessment of parameters like Area, Major axis, Minor axis and eccentricity. The original image is shown in figure 6 and gray scale image is shown in figure7.Image after performing edge detection operation is in Figure 8. |
| Table 4 shows intended parameters value for twenty seeds of one of the sample of Masoori Rice out of ten samples based on histogram for normal seeds, ling seeds and small seeds respectively. Table 5 and Table 6 shows calculated parameters value and percentagewise calculated parameters value based on histograms. |
| We compare the results with ground truth data. Table 7 shows values calculated based on Human Sensory Evaluation Panel for normal seeds, Long seeds and Small seeds of various sample. Table 8 shows the percentagewise calculated value based on Human Sensory Evaluation Panel for the same. |
CLASSIFICATION OF RICE SEED
|
| For finding out the number of normal rice seeds, long rice seeds and small rice seeds we compute thresholds values using the histograms of Figure 5 (a) -to-(d) for area, minor axis length, major-axis length and eccentricity as mention in Table 7. |
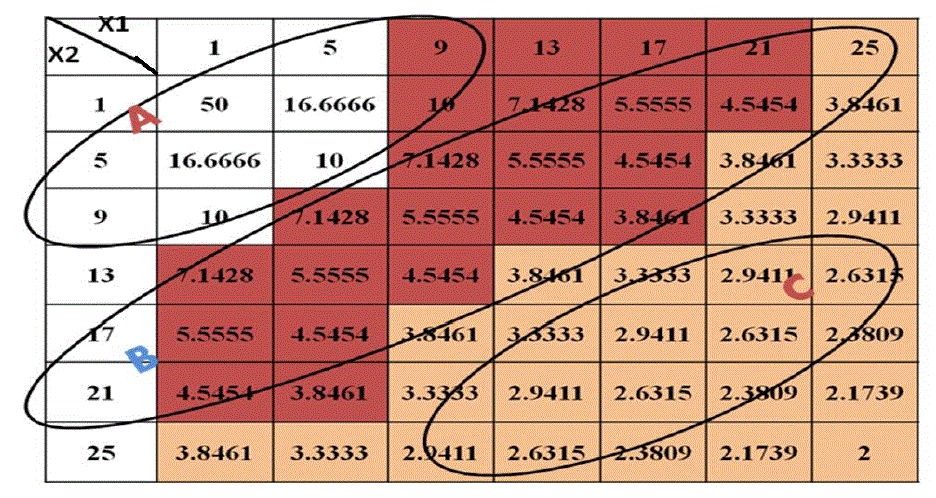
| The quality Q, of Rice seeds is not having any particular formula for quantification and assessment. The quality factor Q depends on foreign materials. If these parameters increase percentage wise in the bulk of Rice seeds then as a result the quality Q would decrease. Hence the quality factor Q is inversely proportional to Rice seed with foreign materials. So the Q factor can be defined as |
 |
| Assuming C to be 100, Q Table can be prepared defining various Q values on the basis of two parameters x1 and x2. For instance if one consider x1 to be 11% and x2 to be 1% the quality factor Q would be 9.09. This particular instance predicts the grade of Rice seeds to be ”A” as seen from the Figure 8. The top most ellipse represents Grade A normal seeds, the red color filled area represents grade B which comprise of higher percentage of long seeds .The bottom most encircled area is grade C for small seeds. |
CONCLUSION AND FUTURE WORK
|
| This paper presents a quality analysis of Masoori rice seeds via image analysis. We are calculating area, major axis length, minor axis length and eccentricity for counting normal seed and foreign element in terms of long as well as small seed for a given sample. This paper illustrates new method which is non-destructive for quality analysis. Traditionally quality evaluation and assessment is done by human sensory panel which is time consuming, may be variation in results and costly. For quality analysis more parameters can be calculated to make more accurate results. |
ACKNOWLEDGEMENT
|
| The author expresses their gratitude to Mr.H.N.Shah the owner of Shri Krishna Rice and Pulse Mill, Borsad for the system model as per the requirements desired by the image processing group. |
| |
Tables at a glance
|
 |
 |
 |
 |
 |
| Table 1 |
Table 2 |
Table 3 |
Table 4 |
Table 5 |
 |
 |
 |
 |
| Table 6 |
Table 7 |
Table 8 |
Table 9 |
|
| |
Figures at a glance
|
 |
 |
 |
 |
 |
| Figure 1 |
Figure 2 |
Figure 3 |
Figure 4 |
Figure 5 |
 |
 |
 |
 |
| Figure 6 |
Figure 7 |
Figure 8 |
Figure 9 |
|
| |
References
|
- Abdullah MZ, Fathinul-Syahir AS, Mohd-Azemi BMN, “Automated inspection system for color and shape grading of star fruit (Averrhoa carambola L.) using machine vision sensor,” Transactions of the Institute of Measurement and Control, 27 (2), 65-87,2005.
- Abutaleb AS, “Automatic thresholding of grey-level pictures using two-dimensional entropies.” Pattern Recognition, 47 (1), 22-32 ,1989.
- Bahar Gumus, Murat O.Balaban, Mustafa Unlusayin, “Machine Vision Applications to Aquatic Foods: A Review,”Turkish Journal of Fisheries and Aquatic Sciences 11: P171-181,2011.
- Ballard D. A., & Brown, C.M.“ Computervision.”,Englewood Cliffs, NJ, USA: Prentice-Hall ,1982.
- Batchelor BG, “Lighting and viewing techniques In Automated Visual Inspection,”Bachelor BG, Hill DA, Hodgson DC, eds) Bedford: IFS Publication Ltd, pp.103-179,1985.
- Blasco J, Aleixos N, Molt E, “Machine vision system for automatic quality grading of fruit,” Biosystems Engineering, 85 (4), 415-423,2003.
- Canny J, “ A computational approach to edge detection.” IEEETransactions on Pattern Analysis and Machine Intelligence, 8 (6), 679-698,1986.
- Chetna Maheshwari, Kavindra Jain, Chintan Modi, “Novel approach for Oryza sativa L.(Rice) based on machine vision technology,” PEPCCI, National Conference,ISBN No.-978-93-81286-06-7,2012.
- Du CJ, Sun D-W, “Recent development in the applications of image processing techniques for food quality evaluation.” Trends in Food Science and Technology, 15,230-249,2004.
- Du C-J, Sun D-W, “Learning techniques used in computer vision for food quality evaluation: a review,.” Journal of Food Engineering, 72(1), 39-55,2006.
- Gan TH, Pallav P, Hutchins DA , “Non-contact ultrasonic quality measurements of food products.” Journal of Food Engineering, 77 (2),239-247,2005.
- Gunasekaran Sundaram,Kexiang Ding, “Computer vision technology for food quality assurance,”. Trends in Food Science and Technology, 7, 245-256,1996.
- Jain AK,”Fundamentals of Digital Image Processing,” Englewood Cliffs :Prentice-Hall 1989.
- Kavindra Jain, Chintan K. Modi, Kunal Pithadiya, “Non Destructive quality evaluation in spice industry with specific reference to Cuminum Cyminum L (Cumin) seeds,” International Conference on Innovations & Industrial Applications, Malaysia, (IEEE) 2009.
- M. Kurita and N. Kondo, “Agricultural product grading method by image processing (part 1)- effectiveness of direct lighting method,”J.SHITA 18(1): 9-17,2006.
- Rohit R. Parmar, Kavindra R.Jain, Dr.Chintan K.Modi, “Image Morphological operation based quality analysis of coriander seed (Coriandrumsatavum L.),” ETNCC (International Conference on Emerging Trends in Network and Computer Communications),2011.
- Siriluk Sansomboonsuk and Nitin Afzulpurkar, “Machine vision for Rice Quality Evaluation,” Technology and Innovation for Sustainable Development Conference (TISD) pp: 343-346, 2008.
- Shen Castan, Sian Zhao,”A Comparitive study of Performance of Noisy roof edge detection ”5th International conference on Computer analysis of Images and Patterns, volu.179,pp 170-174
- Tadhg Brosnan, Da-Wen Sun, “Improving quality inspection of food products by computer vision-a review,” Journal of Food Engineering 61,pp. 3–16,2004.
- Xiaopei Hu, ParmeshwaraK.M.,DavidV. “Development Of Non Destructive Methods To Evaluate Oyster Quality By Electronic Nose Technology”. Springer Science Business Media, LLC,2008.
|