ISSN ONLINE(2278-8875) PRINT (2320-3765)
ISSN ONLINE(2278-8875) PRINT (2320-3765)
| H. K.Sarma Associate Professor, Deptt. Of physics, B.B.K.college, Nagaon, Barpeta, Assam, Pin- 781311, India |
| Related article at Pubmed, Scholar Google |
Visit for more related articles at International Journal of Advanced Research in Electrical, Electronics and Instrumentation Engineering
Radon exhalation rate from soil is one of the most important factors for evaluation of the environmental radon level. Solid State Nuclear Track Detectors (SSNTD ) has been widely used for the study of different aspects of radon emission from soil and others. In this paper, we are presenting the results of radon concentration, its exhalation rate and radium content in soil samples collected from different locations of refinery area belonging to Noonmati, Guwahati, Assam (India). The radon concentration varies from 380.95 to 457.14 Bq/ m3.The radon exhalation rates in terms of area and in terms of mass varies from 117.48 to 140.97 mBqm-2hr-1 and 3.32 to 3.99 mBqkg-1hr-1. The radium content varies from 5.34 to 6.40 Bq/ Kg. A good correlation is observed between radium content and radon exhalation rates in soil samples.
Keywords |
| Radon, Radium, Soil, SSNTD |
INTRODUCTION |
| Over the past few decades, there has been a large scientific interest in the study of environmental radon. One of the main reasons is its associated health hazard; another is its widespread use as an environmental tracer [1]. Uranium is present in rocks and soil. The most abundant isotope is 238 U that decaying generates 222 Rn. Radon is a noble gas and thus does not undergo chemical reactions which could preclude its free movement within the soil. Soil is a source of radon. The infiltration of radon gas (222 Rn) from soil has been identified as one of the main mechanisms influencing indoor radon levels in many buildings [2]. It was reported that a world wide average of 60.4% of indoor radon comes from the ground and surrounding soil of buildings [3].Information on the spatial variability of radon exhalation rate would be useful for identifying areas with a risk of high radon exposure. On the other hand, the well understood chemical behavior (inert gas) of radon 222 Rn and its convenient half life (3.82 d) make radon to be a useful tracer in studies of air mass transportation. For example, it is often used in validating global atmospheric transport models [4, 5]. Once radon is free to move, when it has left its original matrix through the emanation process; it can give rise to different mechanisms of migration, until it arrives at the soil surface and exhalates to the atmosphere. The first mechanism of migration is diffusion. The second one is convection, which can occur when a sufficient thermal gradient is available within the soil depending on many local parameters such as viscosity, porosity, permeability. The third one is transport by means of gas carrier [6]. |
| Henshaw et al, 1990, [7] claimed that the radon exposure is associated with the risk of leukemia and certain other cancers, such as melanoma and cancer of kidney and prostate |
AREA UNDER INVESTIGATION |
| In the present investigation, estimation of radium ( 226 Ra ) and radon ( 222 Rn ) has been carried out in the environment of some areas near to Gauhati refinery located at Noonmati of Guwahati, Assam, India. Geographical location of the area is 26º13/N latitude and 91º52/E longitude. The height of the ground level is 64 meter from the mean sea level. |
EXPERIMENTAL METHOD |
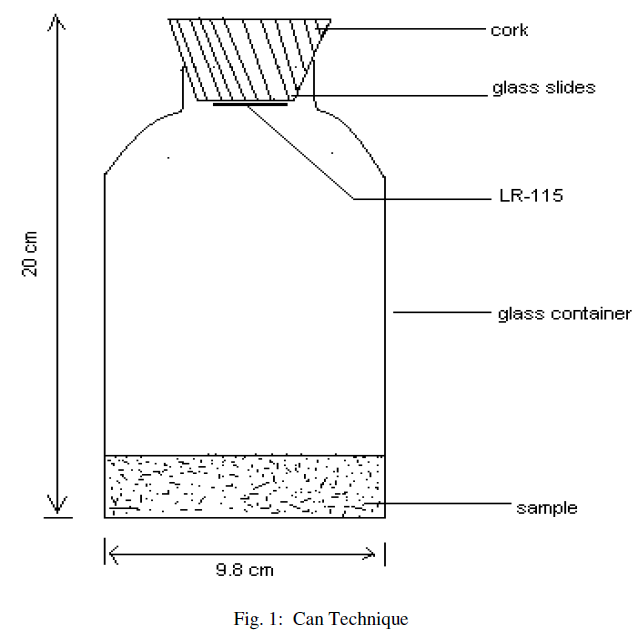
| The “Can technique’ [8, 9, 10, 11] is used for the measurement of radium and radon exhalation rate in some soil samples collected from different locations of the area. The dried samples collected from different locations are finely powdered and sieved through a 200 mesh sieve. The fine powder (250gm) of samples from each site is placed in different glass bottles and sealed with thin polyethylene sheets for 30 days so as to attain the equilibrium. After one month, LR-115 (type II) plastic detectors are fixed on the lower side of cork lids, which are then gently pressed against the polyethylene sheets on the glass bottles (acting as emanation chambers, as shown in Fig. 1), so that the equilibrium is not disturbed or there is minimum possible disturbance, if any. The bottles are then sealed and left as such for 90 days so that the detectors can record α-particles produced by the decay of radon. The exposed detectors are etched in 2.5N, NaOH solution at (60±1)0C for 90 minutes using a constant temperature bath. The tracks are counted using an (OLYMPUS) optical microscope at 400X magnification. |
| The “Can technique” (fig.1), is used to calculate the radium concentration in soil samples and is calculated using the following relation [12], |
| Where CRA is the effective radium content of the given sample (Bq kg-1), ρ is the track density (track cm-2 ). M is the mass of the sample (250gm), A is the area of cross section of the bottle (7.085×10⁻³m2), h is the distance between the detector and the top of the sample (0.135 m), K is the sensitivity factor, which is equal to 0.0245 tracks cm-2d-1 per Bqm- 3 [13] in the present case and Te is the effective exposure time (in days). Te is related to the actual exposure time T and decay constant λ for 222Rn by the relation: |
| The radon exhalation rate in terms of area is calculated from the equation below (9, 11) |
| Where EA is the radon exhalation rate in terms of area (Bq.m-2h-1); C is the integrated radon exposure as measured by LR-115 plastic detector (Bq.m-3h); V is the effective volume of the can (m3); λ (=7.5×10⁻³h-1) is the decay constant for radon; A is the area of the can (m2). This formula is also modified to calculate the radon exhalation rate in terms of mass (Bq.Kg-1h-1). |
| The radon exhalation rate in terms of mass is calculated from the expression: |
| Where EM is the radon exhalation rate in terms of mass and M is the mass of the sample (250 gm). The value of λ can be calculated with the help of the formula: |
| T = 0.693 / λ |
| Where T = half life of radon = 3.82 days |
| The integrated Radon concentration can be calculated with the help of the formula, |
| Where TR is the number of tracks cm-2, d is the time of exposure, K is the calibration factor (sensitivity factor) = 0.0245 Tracks cm-2 d-1/Bq.m-3. |
RESULTS AND DISCUSSIONS |
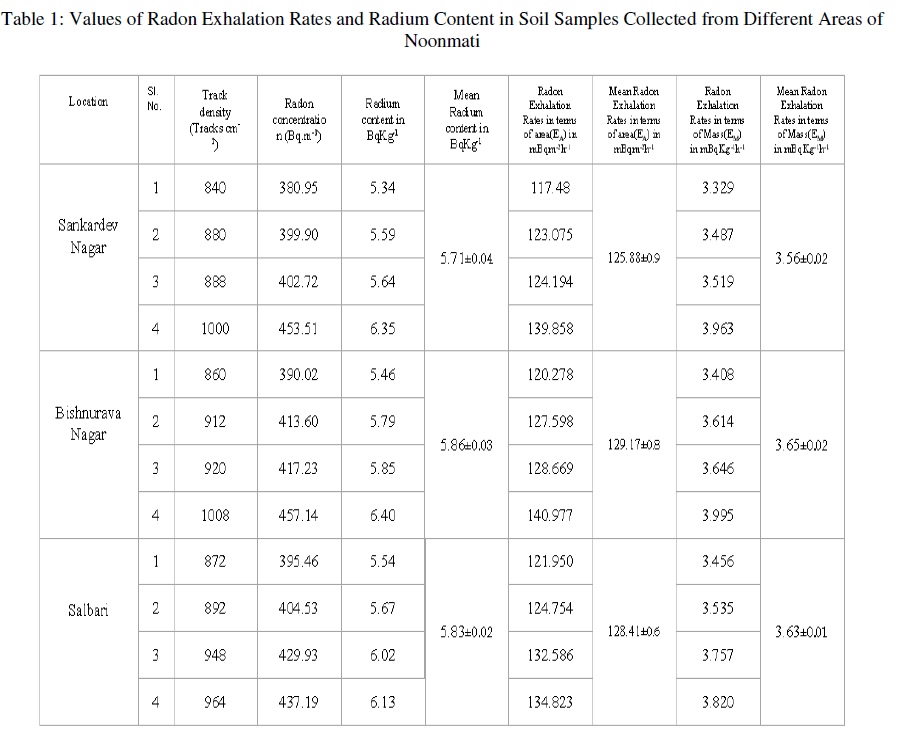
| We have collected the soil samples from different locations of Noonmati area, viz,Sankardev Nagar, Bishnurava Nagar and Salbari. The values of radon exhalation rates from soil samples and radium content in soil samples collected from these locations are given in table 1. It is evident from the table that the radon exhalation rate in terms of area varies from 117.48 to 139.858 mBqm-2h-1 with an average of 125.88 mBqm-2h-1 in soil samples collected from Sankardev Nagar. The radon exhalation rates in terms of area for Bishnuravanagar, and Salbari vary from 120.278 to 140.977 mBqm-2h-1, and 121.950 to 134.823 mBqm-2h-1 with the average of 129.17 mBqm-2h-1, and 128.41 mBqm-2h-1 respectively. |
| For Sankardev Nagar, radon exhalation rates in terms of mass varies from 3.329 to 3.963 mBqKg-1h-1 with an average of 3.56 mBqKg-1h-1. The radon exhalation rates in terms of mass for Bishnurava Nagar and Salbari vary from, 3.408 to 3.995 mBqKg-1h-1 and 3.456 to 3.820 mBqKg-1h-1 with the average of 3.65 mBqKg-1h-1, 3.63 mBqKg-1h-1 respectively. |
| The variation of the radium content in soil samples collected from different areas are also shown in Table 1. The radium content in soil varies from 5.34 to 6.35 BqKg-1 with an average of 5.71 BqKg-1 in soil samples collected from Sankardev Nagar and these vary from 5.46 to 6.40 BqKg-1 and 5.54 to 6.13 BqKg-1 and with the average of 5.86 BqKg-1 and 5.83 BqKg-1 for Bishnurava Nagar and Salbari respectively. |
| It can be seen from the table 1 that the radon exhalation rate varies appreciably from one place to another. This variation may be due to the differences in radium content [14] and porosity of the soil [15]. In the present study we observe that the radium content in soil samples also varies appreciably from one place to another. |
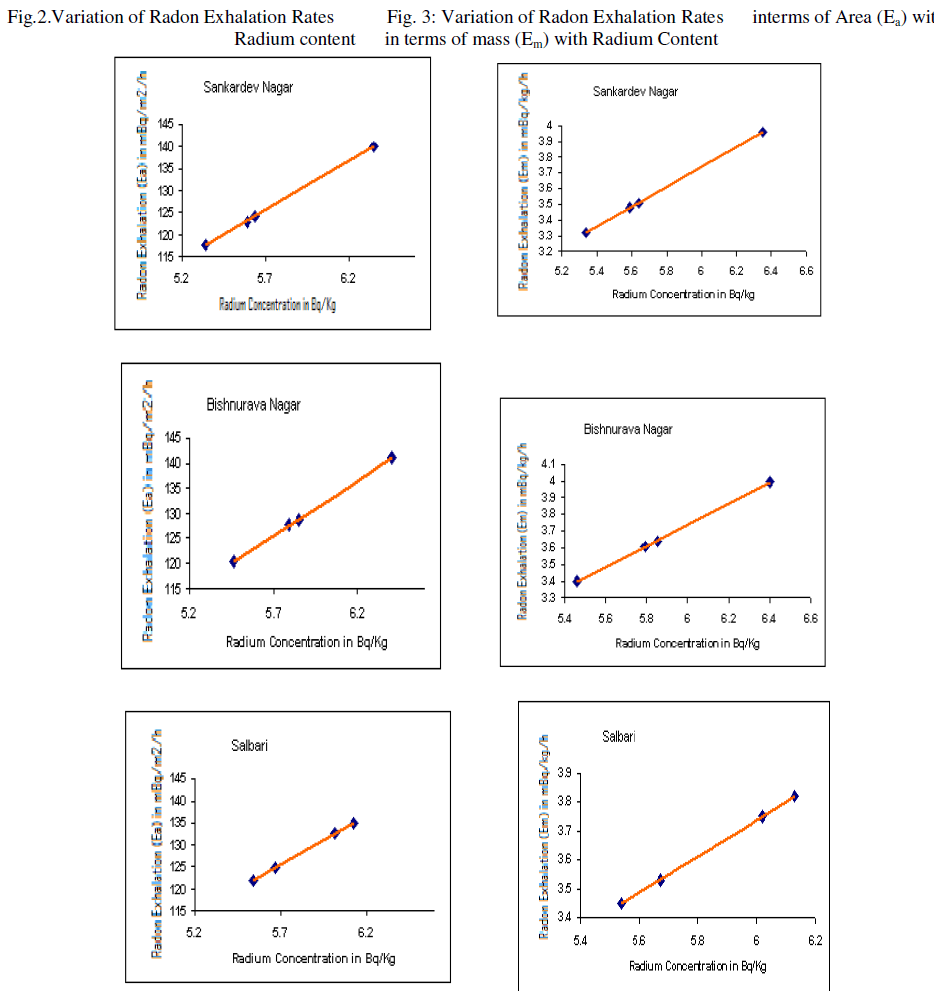
| The variation of radon exhalation rates in terms of area with radium content is shown in fig. 2 and the variation of radon exhalation rates in terms of mass with radium content is shown in fig: 3. |
| The maximum acceptable value of radium activity in soil and rocks (building materials) must be less than 370 Bq.Kg-1 for safe use [16]. |
CONCLUSION |
| 1) The observed values of radium activity in soil samples in the present study are less than the maximum permissible value and much lower than the global value 30 BqKg-1 [17]. |
| 2) We have observed a positive co-relation between radium content in soil and radon exhalation rates from soil as expected. |
| 3) The results reveal that the area is safe as for as the health hazard effects of radium is concerned. |
 |
 |
 |
References |
|