Keywords
|
| Performance metric, Taguchi’s loss function, AOMDV, analysis of variance (ANOVA). |
INTRODUCTION
|
| A mobile ad hoc network is an autonomous communication system of mobile nodes having radio transmitters and receivers. The device is free to move in any direction independently and links among these devices changed normally. Ad hoc is a Latin word and it standing for “for this purpose”. Mobile ad hoc network could be a wireless network that transmits from pc to pc. In ad-hoc networks, some pairs of terminals might not be able to communicate directly with one another and relaying of some messages is needed, in order that they are delivered to their destinations. Such networks square measure usually remarked as multi-hop or store-and-forward networks. Mobile hosts and wireless working hardware have become wide out there and in depth work has been done recently in group action these parts into ancient networks like the web. Usually events square measure used as means that of communications between simulation entities. MANET is a form of independent dynamic structured network, where each node treats like router and freely move in the environment so that dynamic behavior arises the problem for measuring quality of service dependent parameter. These problems motivate the work for identification of quality of service dependent parameter using Taguchi loss function and provide solution for that problem. |
RELATED WORK
|
| In this section the previous work that has done in this field is discussed. Azure Mohamed, Muhammad Hisyam Lee, Shaharuddin Salleh, Bahrom Sanugi and Mazalan Sarahintu [1] “Ad-Hoc Network Design with Multiple Metrics Using Taguchi’s Loss Function” in this title we presents an approach for tackling multiple metrics and various network parameters simultaneously to investigate the performance of wireless ad-hoc network routing protocols. The study uses Taguchi’s loss function to determine the best condition in yielding maximum throughput and minimum packet drop and routing overhead simultaneously for dynamic source routing (DSR) protocol. Studying the parameters one at a time or by trial and error until a first feasible design is found seems to be a common approach to design optimization. In this title, the impact of ad-hoc network parameters such as terrain, network size, number of sources, packet transmitted rates, node speed and pause time on a multiple signal to noise ratio are investigated simultaneously. |
| Pushpraj Pate, Vijay Prakash [2] “Review of Dependent Parameters Using Taguchi Loss Function of AOMDV Routing Protocol in MANET Environment” In this title we presents a method for handling multiple metrics and different network parameters simultaneously to analyze the loss factor of routing protocols in mobile ad hoc network(MANET) environments. We have used Taguchi’ loss function to determine the best parameters giving maximum throughput, packet delivery ratio (PDR), average delay, DROP and routing over head simultaneously for AOMDV protocol. In this title we have consider various different mobile ad hoc network parameters such as Terrain size, No of Nodes, No of source nodes, Packet transmission rate, Node speed, Pause time, Transmission range, Queue size, Antenna height and receiving power on a multiple signal to noise ratio (MNSR), performance and contribution level of parameters have been analyzed by analysis of variance (ANOVA). |
| Hazura Mohamed, Muhammad Hisyam, Bahrom Sanugi, [3] “Taguchi Approach for Performance Evaluation of Routing Protocols in Mobile Ad Hoc Networks” In this title we evaluate the performance of Dynamic Source Routing (DSR) protocol in mobile ad hoc network for single-performance metric and multi-performance metrics. Using Taguchi design of experiment, we quantify the main effects of six influential factors (terrain, network size, node speed, pause time, number of sources and transmission rates) on two performance metrics (throughput and end-to-end delay). The analysis of means (ANOM) and analysis of variance (ANOVA) on single and multi-response signal to noise ratio are employed to determine the best conditions required and to identify the level of importance of factors in order to obtain the best performance of DSR protocol. |
| Raghuraman S, Thiruppathi K,Panneerselvam T Santosh S [4] “Optimization Of Edm Parameters Using Taguchi Method And Grey Relational Analysis for Mild Steel Is 2026” This title aims to investigate the optimal set of process parameters such as current, pulse ON and OFF time in Electrical Discharge Machining (EDM) process to identify the variations in three performance characteristics such as rate of material removal, wear rate on tool, and surface roughness value on the work material for machining Mild Steel IS 2026 using copper electrode. Based on the experiments conducted on L9 orthogonal array, analysis has been carried out using Grey Relational Analysis, a Taguchi method. Response tables and graphs were used to find the optimal levels of parameters in EDM process. The confirmation experiments were carried out to validate the optimal results. |
| S. Kamaruddin, Zahid A. Khan and S. H. Foong [5] “Application of Taguchi Method in the Optimization of Injection Moulding Parameters for Manufacturing Products from Plastic Blend” This title we presents a study in which an attempt has been made to improve the quality characteristic (shrinkage) of an injection molding product (plastic tray) made from blends plastic (75% polypropylene (PP) and 25% low density polyethylene (LDPE)) by optimizing the injection molding parameters using the Taguchi method. The performance of the plastic trays is evaluated in terms of its shrinkage behavior. An orthogonal array (OA), main effect, signal-to-noise (S/N) ratio and analysis of variance (ANOVA) are employed to analyze the effect of injection molding parameters on the shrinkage behavior of the product. |
| U?ur E?me [6] “Application of Taguchi Method for the Optimization of Resistance Spot Welding Process” This title reports on an investigation of the effect and optimization of welding parameters on the tensile shear strength in the resistance spot welding (RSW) process. The experimental studies were conducted under varying electrode forces, welding currents, electrode diameters, and welding times. The settings of welding parameters were determined by using the Taguchi experimental design method. The level of importance of the welding parameters on the tensile shear strength is determined by using analysis of variance (ANOVA). The optimum welding parameter combination was obtained by using the analysis of signal-to-noise (S/N) ratio. The confirmation tests indicated that it is possible to increase tensile shear strength significantly by using the Taguchi method. |
| Mr. Vinod Mahor, Prof. Sandeep Raghuwanshi [7] “Taguchi’s Loss Function Based Measurement of Mobile Ad-Hoc Network Parameters under AODV Routing Protocol” This title presents the application of Taguchi’s loss function approach, a multi-response optimization method, for achieving better performance during routing process of ad-hoc on demand distance vector (AODV) routing protocol. Seven parameters namely terrain size, network size, number of sources, transmitted packet rates, pause-time, node speed, and transmission range are optimized with considerations of multiple performance metrics including maximum packet delivery ratio and minimum routing overhead, packet drop and end-to-end delay. Based on multiple signal-to noise ratio (MNSR), optimum levels of parameters have been identified and significant contribution of parameters is determined by analysis of variance (ANOVA). |
PROPOSED ALGORITHM
|
| Mobile Ad-hoc network is depends on different service and parameter, such the service is routing independent decision, movement aware, energy information etc. and parameter is antenna type, height of antenna, receiving power, queue length, terrain size, number of node, source node’s, speed and data size etc. so all the characteristic are form of dynamicity of communication network than our proposed research is to identifies the maximum depended parameter to increase and decrease the performance of the network and on the bases of performance we state the equation for ideal network condition in various circumstances. |
| In our approach we create scenario in two level namely level1 and level2with 10 routing parameter and 5 Metrics like throughput, packet delivery ratio (PDR), average delay, DROP and routing over head according to that we can create 210 design points but here we create only 10 design points and analyze the result and apply Taguchi loss function equation to measure the maximum loss dependent parameter. |
| The following metrics are define by the equation |
| Throughput: Per unit time number of packet received by the receiver, is generally represented by- |
 (1) (1) |
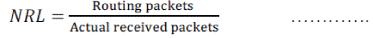
| Packet delivery ratio: Packet delivery ratio is a percentage of data receiving by the genuine receiver. It is formalized by- |
 (2) (2) |
| Routing over head: Normalized routing load provide the over head arises in the network and its calculation is |
 (3) (3) |
| DROP data: Data drop is measure in packet base and that calculation is formulized by- |
| DROP data = Total no of packets sent – Total no of packets received (4) |
| Average End to End delay: The average end to end delay is a summation of per packet delay. |
 (5) (5) |
| Where, |
| Eli= End to End delay of ith packet |
| n= Number of packets |
| In Taguchi loss function we calculate various network dependent parameters base MANET behavior and calculate the maximum and minimum dependent factor, |
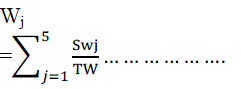
 (6) (6) |
| Where Ni: ith design point SwJ: summated weight of jth parameter |
 (7) (7) |
| Where, |
| TW= Total weight |
| RLi= Routing load of ith design point PDRi= Routing load of ith design point DROPi= Packet drop of ith design point DLi= Time delay of ith design point THi= Throughput of ith design point |
 (8) (8) |
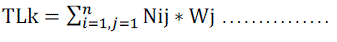 (9) (9) |
| Where, TLk= Total loss of kth design point Nij= ith design point jth parameter Wj= Jth parameter weight P= {RL, PDR, DROP, DL, TH} |
| After that we calculate MSNRi= -10Log(TLk) ………….. (x) MSNR= Mean Signal Noise Ratio |
Ordering
|
| i = 1; j = 10; |
| If (MSNRi > MSNR(j-i)) |
| { |
| O[i]; // range from 10 to 1 |
| i + 1 |
| } |
| Where i : 1 to 10 |
| After ordering we calculate dependencies of parameter in level1 and level 2 and where deviation is maximum that means maximum dependencies |
PROPOSED ALGORITHM AND STEP
|
| Step 1: Parameter: NoM- Mobile nodes |
| NoS- Sender node |
| R- Receiver node |
| Proto- AODV |
| Step 2: Dependent Parameter: |
| Ts: Terrain size |
| Qs: Queue size |
| Ant: Antenna height |
| Rxp: Receiving power |
| Rr: Routing request packets |
| Step 3: NoS_broadcast(S, R, Proto) |
| { |
| If(Node forward pkt to R node) |
| {Route exit |
| } |
| Else |
| {Search available Ts or Receiver out of range |
| } |
| Step 4: Send data pkt to R node. |
| Step 5: Generate output trace file. |
| Step 6: Apply above step in 10 design points |
| Step 7: Calculate the result on the basis of RL, PDR, DROP, E-E Delay, Throughput etc. |
| Step 8: Calculate Total weight by the formula- |
| Step 9: Calculate Total loss by using formula- |
| Step 10: Calculate MSNR for measuring quality of service dependent parameter identification. |
| Step11: Identify minimum and maximum dependent parameters. |
| Step 12: Stop. |
PROPOSED ARCHITECTURE
|
| In our proposed architecture apply Taguchi loss function and analyze the dependent network parameter and its behavior, for that analysis we create simulation network and initialized all required parameter after that we generate event file and measure the performance and calculate weight of each parameter that is use full to calculation of total loss as well as MSNR ratio analysis. That MSNR value base we assign its order and calculate two level parameter dependencies. If level1 and level2 difference is grater, that means our network maximum dependents on that parameter. |
SIMULATION RESULTS ANALYSIS
|
| The AODV routing protocol under various conditions was evaluated at random for five samples in terms of five performance metrics, routing load, delivery packet ratio, packet drop, end-to-end delay and throughput. In our simulation structure we used 10 numbers of loss dependent parameters and retrieve maximum as well as minimum dependent parameters. For that purpose here we define two level of simulation as follows. |
| In our simulation experiment we generate ten design point, and each design point apply different parameter level value and that is use full to measure loss factor, in this table column represent level of factor and row represent design point. |
Response Table for the MSNR
|
| The response table on the basis of level 1 and level 2 are mention in table 3. Here the parameters from A to J are considered on the basis of different reasons on which the performance of MANET is dependent like speed, queue length and so on. The levels are used to represents the number of different scenarios likes level 1 pause time and level 2 pause time. The different levels have different values of same parameters. |
Terrain Size Analysis
|
| The simulation area in network is the limited area in which the mobile nodes are moves. The terrain size with different levels shows the MSNR performance proposed is higher in Level 1 but in Level 2 the MSNR response in lower in network and old case that is opposite. The analysis illustrated that the size of network also affected the performance of network. The Taguchi’s loss function has measure the factors that affected the performance of network in all conditions the terrain size is one of them. |
Nodes Analysis
|
| The nodes density is actually the number of nodes quantity in network that is participating in communication. The large quantity of nodes means that the nodes density in network. The higher number of nodes in network produces the better MNSR performance in proposed as compare to existing MSNR in level 1 but in level 2 the MNSR value is degrades in network because the network density is improves in network that affect MNSR value. The nodes density enhancement is not necessary to enhance the network performance. |
Source Nodes Analysis
|
| The source nodes have sending the data in network for receiver. If the number of sources is enhanced then more communication is experience and also required to handle more number of packets. Taguchi’s loss function measured the performance of nodes that are sources in network in level 1 show higher MSNR in case of proposed, value in network but the performance in level 2 is degrades in network in term of MNSR value in network. The number of sources improvement is shows the lower MNSR value. Existing case that MSNR performance is lower in both level |
Data Rate Analysis
|
| The data rate is the number of data deliver in network in 1 second like bits/sec, packets/ seconds etc. The higher data rate in network always required to deliver the data quickly in network. The data rate availability depends on the bandwidth capacity and in MANET not possible to expand bandwidth. The data rate in level 1 is shows the better MNSR value in network performance. The data rate performance in level 2 shows the lesser MNSR, that shows the affect in performance due to unavailability of bandwidth capacity. The existing MSNR value is lower as compare to proposed work in the term of data rate. |
Nodes Speed Analysis
|
| The node speed in MANET is the major issue to maintaining the connection in network. The fast mobility of nodes easily leave the established connection by that the communication between the nodes are breaks. The higher speed in network shows the more MNSR value at proposed scheme level 1 but the higher speed in network shows the lower MNSR in level 2. The speed has creating the problem in communication among the nodes. |
Pause Time Analysis
|
| The pause time is the time at which the performance is measured in different simulation time in MANET. The network performance w.r.t. time improves in network that shows the better network performance. The level 1 MNSR value is small in network but in level 2 the pause time is higher that shows the higher MNSR in network. The pause time shows the better MNSR in level 2. |
Queue Size Analysis
|
| The queue size is the capacity of packets that is the store and forwarding capacity of mobile nodes in network. The higher queue size is showing the better performance in network. The queue size in level 1 is lower by that the MNSR value is also less.The queue length variation is improves the capacity of data packets handling that reduces the packet drop so that, in level 2 the queue size is higher that shows the more MNSR value in network. |
Transmission Range Analysis
|
| The transmission range in MANET is the range in which nodes are listening to neighbors or sense the neighbor for established the connection in network. The higher transmission range is improves the performance because the nodes are communicated in longer range. The MNSR at level 1 is less but the MNSR in terms of transmission range at level 2 is more that shows the better network performance. |
Antenna Height Analysis
|
| The antenna height analysis in term of MNSR value is represents in this graph. The antenna height is adjusted to catch the proper signals by that the proper communication is possible in network. Every node in network is work as a station that is communicates through antenna. The MNSR value at level 1 is less because the highest of antenna is low but at level 2 the MNSR is more, shows the higher height of antenna and better communication in network. |
Receiving Power Analysis
|
| The battery power consumption is the critical issue in MANET because of lack of battery replacement and charging facility in network. The less power consumption is shows the better utilization of power but that power is also sufficient for communication. In this graph the MNSR is low at level 1 but at level 2 the MNSR value is high that shows the better performance of network and power utilization for communication. |
CONCLUSION AND FUTURE WORK
|
| The Routing protocols of MANET are playing the important role in communication of nodes in network. The routing performance in dynamic network is maintained properly is depend on the many factors like number of sources, node density, simulation area, queue length, node speed transmission power and so on. In this research, the Taguchi’s loss function is the function that measures the performance of network on the basis of above mentioned factors that affected the network performance. The level 1 is the first performance w.r.t multiple signal to noise ratio (MNSR) value. The higher MNSR value always shows better performance. The level 2 is the enhanced or enlarged part of parameters that are considered for performance evaluation and through Taguchi’s loss function the performance of that parameter is degrades or improves network performance. |
| In future we also measure the effect of different attacks like Vampire attack in MANET. This kind of attacks is exploits the network resources like bandwidth, energy and routing performance. The Taguchi’s loss function is applied to observe the loss in performance of different factors that are considered here. |
| |
Figures at a glance
|
 |
 |
 |
 |
| Figure 1 |
Figure 2 |
Figure 3 |
Figure 4 |
 |
 |
 |
 |
| Figure 5 |
Figure 6 |
Figure 7 |
Figure 8 |
 |
 |
 |
| Figure 9 |
Figure 10 |
Figure 11 |
|
| |
References
|
- Hazura Mohamed, Muhammad Hisyam Lee, Shaharuddin Salleh, Bahrom Sanugi and Mazalan Sarahintu“Ad-Hoc Network Design with Multiple Metrics Using Taguchi’s Loss Function” 2011 International Conference on Electrical Engineering and Informatics 17-19 July 2011, Bandung, Indonesia.Y. Hu and A. Perrig, “A Survey of Secure Wireless Ad Hoc Routing,” IEEE Security & Privacy, 2004, pp. 28-39.
- Pushpraj Pate, Vijay Prakash “Review of Dependent Parameters Using Taguchi Loss Function of AOMDV Routing Protocol in MANET Environment” International Journal of Innovative Research In Technology & Science | Volume 2, Number3 ISSN: 2321-1156.P. Michiardi and R. Molva, “CORE: A Collaborative Reputation Mechanism to Enforce Node Cooperation in Mobile Ad Hoc Networks,” Proc. IFIP TC6/TC11 Sixth Joint Working Conf. Comm.and Multimedia Security, 2002.
- Hazura Mohamed, Muhammad Hisyam, Bahrom Sanugi, “Taguchi Approach for Performance Evaluation of Routing Protocols in Mobile Ad Hoc Networks” Journal of Statistical Modeling and Analytics Vol. 1 No. 2, 10-18, 2010.S. Buchegger and J. Boudec, “A Robust Reputation System for P2P and Mobile Ad-Hoc Networks,” Proc. Workshop Economics of Peer- to-Peer Systems (P2PEcon), 2004.
- Raghuraman S, Thiruppathi K,Panneerselvam T Santosh S “optimization of edm parameters using taguchi method and grey relational analysis for mild steel is 2026” International Journal of Innovative Research in Science, Engineering and Technology Vol. 2, Issue 7, July 2013.
- S. Kamaruddin, Zahid A. Khan and S. H. Foong “Application of Taguchi Method in the Optimization of Injection Moulding Parameters for Manufacturing Products from Plastic Blend” IACSIT International Journal of Engineering and Technology, Vol.2, No.6, December 2010 ISSN: 1793-8236.
- Ugur Esme “Application of Taguchi Method for the Optimization of Resistance Spot Welding Process” The Arabian Journal for Science and Engineering, Volume 34, Number 2B 519.
- Mr.Vinod Mahor, Sandeep Raghuwanshi, “Taguchi’s Loss Function Based Measurement of Mobile Ad-Hoc Network Parameters under AODV Routing Protocol” IEEE 4th ICCCNT – 2013 July 4-6, 2013, Tiruchengode, India.
- Anuj K. Gupta, Harsh Sadawarti, & Anil k. Verma, (2011) “Review of various Routing Protocols for MANETs,” International Journal of Information and Electrical Engineering, ISSN: 1109-2742, Vol. 1 No. 3, pp. – 251-259.
- Anuj K. Gupta, Harsh Sadawarti, and Anil K. Verma “A Review of Routing Protocols for Mobile Ad hoc Networks” ACM Journal on WSEAS Transactions on Communications, ISSN: 1109-2742, Volume 10 Issue11, pp. 331-340, 2011, November 2011.
- Charles Perkins and Elizabeth Royer. Ad hoc on-demand distance vector routing. In Proceedings of the 2nd IEEE Workshop on Mobile Computing Systems and Applications, pages 90–100, Feb 1999.
|