A.Adedayo Adepoju*, Grace O. Adenuga, Tayo P. Ogundunmade
Department of Statistics, University of Ibadan, Ibadan, Nigeria
Received: 01-Mar-2022, Manuscript No. JSMS-22-54328; Editor assigned: 03-Mar-2022, Pre QC No. JSMS-22-54328; Reviewed: 17-Mar-2022, QC No. JSMS-22-54328; Revised: 29-Apr-2022, Manuscript No. JSMS-22-54328 (R); Published: 09-May-2022, DOI: 10.4172/JSMS.8.5.006.
Visit for more related articles at Research & Reviews: Journal of Statistics and Mathematical Sciences
Drought is a key abiotic stress affecting maize yield and production in Sub Saharan Africa contributing between 44% to 58% grain yield decline in West and Central Africa. For the detection, classification, and control of drought conditions, drought indices are used. This paper presents the application of a multiple linear regression model and spatial distribution to assess the performance of drought indices on maize production in the Northern part of Nigeria. In this research, observed annual data of drought indices, RDI and the palmer drought indices which includes SCPDSI, SCPHDI and SCWLPM, maize yield (measured in tonnes) in Northern states of Nigeria were obtained from 1993 to 2018. The multiple linear regression was carried out at different training sets: 70%, 80% and 90%. Results from the multiple linear regression showed that in the North-Central states, FCT has the lowest MSE (0.7788234) at 90% training level. In North-Eastern states, Borno state has the lowest MSE (0.7240276) at 80% training sets. In North-Western states, Kebbi state has the lowest MSE (0.8029484) at 70% training set. Results from the spatial distribution revealed that Yobe state has the lowest maize yield in the Northern states.
Spatial distribution; Drought indices; Maize yield; Regression analysis; Mean square error
Drought is complex to describe and comprehend due to its undesirable features. Variations in hydro-meteorological variables, socio-economic issues and high-water requirement have led to several characterizations [1]. Drought is viewed as an ecological incidence, its consequences increase steadily over a lengthened period, and it is also recognized to be scarce rainfall that results in lack of water which is stimulated by climatic factors like temperature, precipitation and dampness [2]. It is the nonexistence of precipitation in a particular place over a prolonged period, which might be weeks, months, years or decades [3]. Drought is observed as one of the destructive ecological disasters which affect more people than any other ecological ruins across the universe. It is a short-range anomaly; it varies from dryness which is limited to low rainfall regions and is a perpetual characteristic of climate.
Maize is the main frequently planted cereal crop in Nigeria and a substantial food crop cultivated for human intake with an approximated 20 million, livestock forage, and industrialized resources [4,5]. As a result of the significance of maize in Nigeria, its produce has greatly escalated from 0.66 M tons in 1978, to about 11.3 M tons in 2013, substituting homegrown cereals such as sorghum and pearl millet [6,7].
Drought indices are numerical values that demonstrate drought levels by obtaining data from one or more rates (pointers) such as precipitation and evapotranspiration into a specific arithmetic value. Such an index is more quickly justifiable than rudimentary indicator data [8]. The nature of drought indices specify varied occurrences and happenings; they can unveil the weather aridity anomalies or close to impeded farming and water impacts such as soil moisture deficit or reduced reservoir levels. The advancement of the indices' development is focused on getting an estimate without dimension to reveal the gravity of the drought [9]. Some of the drought indices are specifically centred on farming matters, while others are engaged with the delivery and ease of access to water in an area. Palmer incorporated regional water stability and created the Palmer Drought Severity Index (PDSI) for the discovery of agricultural and meteorological drought incidents. After that, more indices were created based on the context of the latest drought recognition. For instance, a multivariate standardized drought index was presented by Hao et al (2013) which focused on the copula notion. The index merges a standardized soil moisture index and Standardized Precipitation Index (SPI) to illustrate drought statistically.
There has been noteworthy progress in the past years in terms of modelling droughts by using data-driven or general circulation models. Among empirical models, Multiple Linear Regression (MLR) models are majorly used for investigating weather and soil prerequisites and their influence on crop yield [10]. Multiple Linear Regression (MLR) analysis was principally created to assess the association between more than one predictor variable and a predicted variable. In MLR, the variable is explained using other variables. The recognition of MLR is based on clear-cut execution, full statistical theory, obtainability of problem-solving devices to improve the assessment and availability of standard deviations for the approximated variables. Linear regression paradigms in combination with climatic variables, such as air pressure, air surface temperatures, wind velocities and precipitation data, have been beneficial for the hydrological extreme forecast. Instances of applications of MLR include using regression models to test the relationship between the normalized difference vegetation index and SPI. The prior index was considered a right and proper tool to evaluate the aftermath of vegetation to moisture in drought situations. MLR has also been effectually used to forecast drought, barley yield in drought situations and daily flood flow [11]. SPI and MLR had been used in Greece to carry out a spatio-temporal study on drought and exemplify the corresponding reoccurrence periods [12,13].
The crisis of drought in this region of Nigeria is a great distress to the people but the reasons for the problem is not well identified by the policy-makers. At the moment, there is rare comprehensive research probing the extent to which the most commonly used drought indices can ascertain drought effects on vulnerable systems. Furthermore [14] noted that there is a need for the right and proper methods to be utilized to investigate drought occurrence to minimize its impact on the natural world. This task is essential to have genuine and factual measures for choosing a drought index to be utilized for specified tasks. This study seeks to examine the effect and spatial distribution of drought indices on maize production in the Northern part of Nigeria. The other sections of the paper are structured as follows: section 2 presents the material and methods while sections 3 and 4, the results and conclusion respectively.
Study area and data
Nigeria, situated in the Western part of Africa is the biggest nation in Africa. It is separated into six geopolitical zones. Nigeria has different ethnic groups and beliefs across the country. Declining precipitation in already desolate districts in Northern Nigeria is causing desertification. The Northern part of Nigeria is endowed with a substantial extent of arable land that has over time offered a key channel for agriculture and other business activities, but the Sahara Desert is advancing Southward at the rate of 0.6 km yearly [15]. Due to this, Nigeria displaces about 350,000 hectares of land every year to desert encroachment. This has led to demographic moves in areas across 11 states in the North. It is presumed that Nigeria loses about $5 billion every year due to rapid desert encroachment and drought [16]. Over 5 million farm animals are being threatened by desertification (Figure 1).

Figure 1:Map of Nigeria showing the 36 states.
Observed annual data of drought indices, RDI and the Palmer drought indices which includes SCPDSI, SCPHDI and SCWLPM, maize yield (measured in tonnes) in Northern states of Nigeria were obtained. The obtained data covered a period of 25 years from 1993 to 2018. SCPDSI stands for Self-calibrated Palmer drought severity index. SCPHDI stands for Self-Calibrated Palmer Hydrological Drought Index. SCWLPM Stands for Modified/Weighted Palmer drought severity index and RDI stands for Reconnaissance Drought Index [17-19].
Spatial analysis
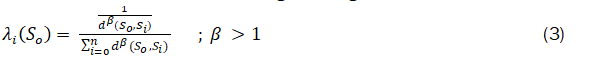
The Inverse Distance Weighted (IDW) interpolation is a process that is largely an illustration of Waldo Tobler’s first law in geography which states that "everything is related to everything else, but near things are more related than distant things". The IDW is a mapping method that is a detailed, convex interpolation method that fits the constant model of spatial variation. The IDW gets the value of a variable at some recent set using values obtained from acknowledged settings [20,21]. This is illustrated mathematically in the equations given below:

The clear-cut method for describing the weights is to utilize the inverse distance from all points to the new points.
The Inverse Distance Weighted (IDW) method is used for the formation of drought risk maps for diverse seasons. This method is focused on the assumption that the interpolating surface is easily affected mostly by near points and less by the more distant points. The system can function even when all points lie in a low-dimensional subspace[22].
Mapping is constructed on the drought indices and the maize yield from 1993 to 2018 with the map legend. This is gotten by subjecting the analysis to ArcGIS 10.5 environment [23,24].
Multiple linear regression analysis
The study involved the use of linear regression analysis. The regression equation is;

Where ![]() dependent variable
dependent variable
β0= intercept
β1,β2,β3,β4 = regression coefficients representing the change in y relative to a one unit change of X1,X2,X3,X4 respectively

where; Yı – Maize yield
β0= intercept
Xı - RDI
X2- SCWLPM
X3 - SCPHDI
X4 - SCPDSI
ϵ - error
Model performance measures
In this study, to assess the performances of all the regression models, the goodness of fit measure namely Mean Square Error (MSE) is utilized.

Xoi= actual/observed value
Xci = predicted/calculated value
MSE is used to calculate the mean regression model prediction error to reveal how close the predicted values are to the observed. Lesser Figureures of the index imply optimum prediction precision[25].
This presents the analysis of the drought indices and maize yield data obtained from the Nigeria Metrological Agency (NIMET). The data spanned from 1993 to 2018. The variables considered are SCPHDI, SCWLPM, SCPDSI, RDI and maize yield (Figures 2-18 and Tables 1-3).
Spatial distribution of drought indices on maize yield in the north-central states

Figure 2:Spatial distribution of drought indices on maize yield in Nasarrawa state.

Figure 3:Spatial distribution of drought indices on maize yield in Kogi state.

Figure 4:Spatial distribution of drought indices on maize yield in Kwara state.

Figure 5:Spatial distribution of drought indices on maize yield in Niger state.

Figure 6:Spatial distribution of drought indices on maize yield in Plateau state.

Figure 7:Spatial distribution of drought indices on maize yield in FCT.

Figure 8:Spatial distribution of drought indices on maize yield in Benue state.

Figure 9:Spatial distribution of drought indices on maize yield in Adamawa state.

Figure 10:Spatial distribution of drought indices on maize yield in Bauchi state.

Figure 11:Spatial distribution of drought indices on maize yield in Bauchi state.

Figure 12:Spatial distribution of drought indices on maize yield in Gombe state.

Figure 13:Spatial distribution of drought indices on maize yield in Yobe state.
Spatial distribution of north-western states

Figure 14:Spatial distribution of drought indices on maize yield in Katsina state.

Figure 15:Spatial distribution of drought indices on maize yield in Kano state.

Figure 16:Spatial distribution of drought indices on maize yield in Kebbi state.

Figure 17:Spatial distribution of drought indices on maize yield in Sokoto state.

Figure 18:Spatial distribution of drought indices on maize yield in Zamfara state.
Assessment of the performance of multiple linear regression using mean square error (mse)
| North central states | Training set: 70%; Testing set: 30% | Training set: 80%; Testing set:20% | Training set: 90%; Testing set:10% |
|---|---|---|---|
| Nassarawa state | 1.016926 | 1.799777 | 3.554443 |
| Kogi state | 1.882205 | 2.179394 | 3.388812 |
| Kwara state | 1.567001 | 1.16950 | 0.9148886 |
| Niger state | 4.044566 | 2.611859 | 3.920181 |
| Plateau state | 5.17662 | 7.306939 | 11.73354 |
| FCT | 1.000446 | 1.218108 | 0.7788234 |
| Benue state | 7.330676 | 5.089114 | 7.169859 |
Table 1. Table showing the assessment of the performance of multiple linear regression using Mean Square Error (MSE) at the North central states.
| North east states | Training set: 70%; Testing set: 30% | Training set: 80%; Testing set:20% | Training set: 90%; Testing set:10% |
|---|---|---|---|
| Adamawa state | 1.053172 | 1.807424 | 3.220234 |
| Bauchi state | 4.093473 | 2.319546 | 2.103173 |
| Borno state | 1.051093 | 0.7240276 | 0.7472332 |
| Gombe state | 4.024758 | 2.003283 | 2.344587 |
| Yobe state | 1.180481 | 1.397354 | 2.541029 |
Table 2. Table showing the assessment of the performance of multiple linear regression using Mean Square Error (MSE) at the North east states.
| North west states | Training set: 70%; Testing set: 30% | Training set: 80%; Testing set:20% | Training set: 90%; Testing set:10% |
|---|---|---|---|
| Katsina state | 1.248222 | 1.350208 | 2.061909 |
| Kano state | 3.106663 | 2.53982 | 1.994035 |
| Kebbi state | 0.8029484 | 1.304079 | 0.9078957 |
| Sokoto state | 2.514661 | 3.621858 | 3.392074 |
| Zamfara state | 3.382533 | 2.696641 | 3.342596 |
Table 3.Table showing the assessment of the performance of multiple linear regression using Mean Square Error (MSE) at the North west states.
For North-central states, Nasarawa state showed that RDI, SCPDSI, SCPHDI and SCWLPM has means of -0.1433, -0.3534, -0.2636 and -0.2150 respectively with a maize yield of 1.9042 tonnes in 25 years. Kogi state produced RDI, SCPDSI, SCPHDI and SCWLPM with mean of 0.3814, -0.006, 0.1693 and 0.1121 respectively with a maize yield of 1.612 tonnes in 25 years. Kwara state produced the means of RDI, SCPDSI, SCPHDI and SCWLPM to be 0.4789, 0.7724, 1.0025 and 0.6967 respectively with a maize yield of 1.448 tonnes in 25 years. In Niger state, the means of RDI, SCPDSI, SCPHDI and SCWLPM are 0.4859, 0.1381, 0.3399 and 0.1329 respectively with a maize yield of 1.4868 tonnes in 25 years [26-28].
Plateau state displayed the means of RDI, SCPDSI, SCPHDI and SCWLPM to be 0.3753, 0.2800, -0.028 and 0.1048 respectively with a maize yield of 2.2516 tonnes in 25 years. In FCT, the means of RDI, SCPDSI, SCPHDI and SCWLPM are 0.3939, 0.3203, 0.078 and 0.0424 respectively with a maize yield of 1.4532 tonnes in 25 years. Lastly, Benue state produced the means of RDI, SCPDSI, SCPHDI and SCWLPM as 0.2958, 0.2621, 0.7129 and 0.9665 respectively with a maize yield of 1.7148 tonnes in 25 years. In the Northcentral states, Kwara state has the lowest maize yield of 1.448 tonnes [29-31].
For the North-eastern states, Adamawa state produced the means of RDI, SCPDSI, SCPHDI and SCWLPM are -0.1822, -0.6753, -0.7071 and -0.6030 respectively with a maize yield of 1.488 tonnes in 25 years. In Bauchi state, the means of RDI, SCPDSI,SCPHDI and SCWLPM are 0.5030, 0.5214, 0.5682 and 0.5313 respectively with a maize yield of 1.7224 tonnes in 25 years. InBorno state, the means of RDI, SCPDSI, SCPHDI and SCWLPM are 0.2958, 0.9200, 1.1953 and 0.6787 respectively with a maize yield of 1.6252 tonnes in 25 years. In Gombe state, the means of RDI, SCPDSI, SCPHDI and SCWLPM are 0.1125, -0.5643, -0.6986 and -0.6497 respectively with a maize yield of 1.59 tonnes in 25 years. In Yobe state, the means of RDI, SCPDSI, SCPHDI and SCWLPM are -0.0285, -0.8787, -0.6166 and -0.5505 respectively with a maize yield of 1.0656 tonnes in 25 years. In the Northeast states, Yobe state has the lowest maize yield of 1.0656 tonnes [32,33].
For the North-western States, Katsina state produced the means of RDI, SCPDSI, SCPHDI and SCWLPM are 0.2963, 0.6943, 0.8639 and 0.8193 respectively with a maize yield of 1.2352 tonnes in 25 years. In Kano state, the means of RDI, SCPDSI, SCPHDI and SCWLPM are 0.5647, -0.3953, -0.2979 and -0.3391 respectively with a maize yield of 1.9668 tonnes in 25 years. In Kebbi state, the means of RDI, SCPDSI, SCPHDI and SCWLPM are 0.3944, 0.3709, 0.7714 and 0.6071 respectively with a maize yield of 1.3068 tonnes in 25 years. In Sokoto state, the means of RDI, SCPDSI, SCPHDI and SCWLPM are 0.3051, 0.8918, 1.6335 and 1.166 respectively with a maize yield of 1.166 tonnes in 25 years. In Zamfara state, the means of RDI, SCPDSI, SCPHDI and SCWLPM are 0.2051, 0.3003, 1.026 and 0.5327 respectively with a maize yield of 1.2644 tonnes in 25 years. In the Northwest states, Sokoto state has the lowest maize yield of 1.166 tonnes.
For the assessment of the performance of multiple linear regression using the mean square error, in North Central states, FCT has the lowest MSE (0.7788234) at 90% training level. For North-Eastern states, Borno state has the lowest MSE (0.7240276) at 80% training set and in North-Western states, Kebbi state has the lowest MSE (0.8029484) at 70% training set.
Drought evaluation has been a demanding task among drought researchers and professionals. In this study, an examination of the performance of four DIs namely; RDI, SCWLPM, SCPHDI and SCPDSI was carried out and OLS was utilized to assess the performance of drought indices on maize production in Northern Nigeria. Based on the findings from the multiple linear regression, In North Central states, FCT has the lowest MSE (0.7788234) at 90% training level. In North-Eastern states, Borno state has the lowest MSE (0.7240276) at 80% training sets. In North-Western states, Kebbi state has the lowest MSE (0.8029484) at 70% training set. From the spatial distribution, Kwara state has the lowest maize yield among the North central states. Yobe state has the lowest maize yield among the Northeast states. And Sokoto state has the lowest maize yield among the Northwest states. Overall, Yobe state has the lowest maize yield in the Northern states.