Research & Reviews: Journal of Material Sciences
ISSN:2321-6212
ISSN:2321-6212
Weiyan Xu*
Department of Metallurgical and Material Science Engineering, Yunnan Normal University, Yunnan Province, China
Received: 09-May-2022, Manuscript No. JOMS-22-63148; Editor assigned: 12-May-2022, PreQC No. JOMS -22-63148(PQ); Reviewed: 26-May-2022, QC No. JOMS -22-63148; Revised: 02-Jun-2022, Manuscript No. JOMS -22-63148(R); Published: 09-Jun-2022, DOI: 10.4172/2321-6212.10.6.001.
Visit for more related articles at Research & Reviews: Journal of Material Sciences
This paper is based on the research of Electric Vehicle Energy Storage, which is stable, random, adjustable, good robust, combined with pumping energy storage, applied to the intelligent system of wind-solar complementary and serves for carbon reduction, the objectives are: (1) to promote wind and photovoltaic energy dissipation, (2) to take into account wind and photovoltaic power fluctuations and cluster energy storage systems of Electric Vehicles (EVS), using multiple EVS clusters to coordinate and reduce power fluctuations. The model includes: (1) Load Monitoring Terminal; (2) Server for storing, processing and mapping all collected power data; (3) a set of user-centered visualization and forecasting services for power management; (4) a photovoltaic water pump system for water supply in poor areas, a pumped storage system and an electric vehicle for energy storage. The results show that photovoltaic and wind power have great fluctuation, and the investment and operation cost of energy storage system is high at present. The large-scale deployment of energy storage system will seriously affect the economy of grid-connected photovoltaic and wind power. Only involving thermal power, the total operating cost of the system is 15.103 million yuan, plus scenery water and electric vehicle energy storage combined system after the total operating cost of the system is 876 million yuan. The integration of scenery and water storage improves the economy and stability of the system. Reducing carbon dioxide emissions will have a positive and far-reaching impact on China’s sustainable development.
Carbon neutral; Complementary landscape; Robustness; Intelligence; Environmental pollution
Combining photovoltaic power generation systems with various electrical and thermal energy storage technologies is very beneficial to photovoltaic producers and consumers, but it is affected by various external factors, such as electricity prices, solar conditions, and policies for photovoltaic producers and consumers [1]. Long-term Power Generation Expansion Planning (GEP) issues determine the best energy technology type, scale, location and time construction of new power plants, while minimizing the total cost and subject to a series of constraints within the long-term planning. Due to its complexity, its effective implementation needs to consider a wide range of aspects, including economic, environmental, regulatory, technical, operational, social, and potential interdependence with other complementary sectors [2]. Different types of home energy management algorithms are suitable for houses composed of solar photovoltaics, battery storage units, electric vehicles with different driving characteristics, and critical and non-critical loads. The main goal of the proposed method is to reduce the overall electricity purchased from public utilities [3]. Literature 4A three-stage multi-timescale framework for online dispatch in a microgrid with EVs and renewable energy [4]. Literature 5 introduces predictive home energy management system with photovoltaic array, heat pump, and plug-in electric vehicle [5]. Pumped water storage is considered to be a promising energy storage method. Due to its low cost, high conversion rate and good safety, it can be widely used in energy storage systems to achieve the effect of peak shaving and valley filling and increase customer demand response [3-5]. Electric vehicles can be used for energy storage to reduce energy waste due to their low night use rate [6-8]. Generally, pumped energy storage has a larger capacity and a higher conversion rate [6,7,9,10]. During the period, electric vehicles have better energy conversion rate, easy to control and low cost [11]. Because of its good stability and conversion rate, people have explored many methods to complement wind and water [12-14], using Grey neural network forecasting algorithm is one of these methods. Single-target forecasting can plan energy use in advance and improve energy utilization. But multi-objective optimization can improve the structure and function and optimization of the entire system [15,16]. Although the conversion rate of chemical batteries is high. It can meet the rapid response, but its cost is relatively expensive, and it will cause chemical pollution. Pumped water storage is a relatively simple, low cost, high conversion rate. With the energy storage of electric vehicles, it not only saves costs, but also quickly responds to the demand for electric loads. It is an economical, affordable and efficient energy storage method. Electric vehicles only use electricity during the travel phase and are usually idle. Therefore, during the low electricity consumption period, electric vehicles can be used to store a large amount of excess load, which greatly improves the response efficiency of the system [17]. Most researches only focus on the energy storage capacity of chemical batteries [18]. As shown in Table 1, many traditional methods only focus on the single-objective optimization of the system, which makes the system easy to fall into single-objective optimization. This paper proposes a multi-objective optimization that decomposes the problem into a certain number of single-objective optimization sub-problems, and optimize at the same time to obtain the Pareto frontier of the system, obtain the optimization plan of the system according to actual needs, and finally formulate the control and management strategy of the distributed controllable power supply in the wind and solar hybrid system to improve the efficiency and economy of system operation; pumped water storage greatly reduces the manufacturing cost of chemical batteries and increases the service life. However, its rapid response ability is weaker than chemical batteries. In the future, a large number of electric vehicles will be put into use. The electric energy can just be stored in the battery of an electric vehicle, which improves the rapid response capability of the system and reduces the cost. We should encourage large-scale implementation of pumped water and energy storage, which is environmentally friendly and economical. It can also meet the energy storage requirements. Electric vehicle energy storage and pumped energy storage perfectly solve the energy storage problem as shown in Figure 1. In order to improve the utilization ratio of the scenery, it is necessary to judge whether the scenery output can meet all the demands of the load, and then judge the charged state of the energy storage device when the scenery water storage system is connected to the network, if the energy storage device is higher than the minimum charge but lower than the maximum charge, the battery will work in the charging state, otherwise, the battery charge is in the highest state, no action, to maintain the current state; If the scenery cannot meet all the current load demand, at this point, you need to determine whether the battery discharge price and the current time-sharing price is high or low, if the battery discharge price is high, if the current price is high, the current charge of the battery will be judged. If the current charge is greater than the minimum state of charge, a battery needs to be discharged to make up for the lack of wind power. If the battery is not fully charged, the grid is used.
| SOCmin | SOCmax | ηch | ηdis | EB(0)/( kW·h) | Pch,max /( kW) | Pdis,max /(kW) | Cop/(π/ kW·h) |
|---|---|---|---|---|---|---|---|
| 0.1 | 0.9 | 0.95 | 0.95 | 5 | 2.5 | 2.5 | 0.15 |
Table1. Parameters of energy storage system.

Figure 1: Flow Chart of energy optimal dispatching of scenery water storage system under grid-connected operation.
System architecture
The energy management system proposed in this paper is a layered and distributed intelligent system, which aims to optimize energy utilization by making power generation plan, electricity consumption plan, water consumption plan and energy storage plan in advance according to local weather forecast. To provide the residents in poor areas with intuitive power planning, integration of these data to foster a more scientific way of power consumption. To achieve these goals, the system is divided into three tiers, as shown in Figure 2.

Figure 2: Complementary systems of wind, solar and water power.
First, because of the intermittent and fluctuating nature of photovoltaic power generation and the huge impact of climate, photovoltaic power generation is difficult to ensure stable power generation, and solar and wind energy has a natural complementarity. The wind-solar complementary power generation system can effectively improve the permeability of new energy, the controllability of output power and the reliability of grid-connected power generation.
The energy management system is responsible for collecting all electrical energy data and local meteorological data, making predictions and utilization, and making rational electricity consumption plans for local residents. In order to guarantee the robustness of the system, the scenery complementary robust optimal scheduling model based on Copula theory is used. The problem of water use for human beings, livestock and crops in poverty-stricken areas was solved. Based on the data of historical electricity consumption and power generation, weather forecast, water consumption and electric vehicle travel, the paper makes accurate prediction and makes reasonable electricity consumption and power generation plan. The energy storage system can control the active power output through wind power generation. This energy storage system can not only be used for peak load regulation, smooth the output power of wind farm, and make wind turbine run as dispatch unit, but also have the ability of frequency control of power system. Ancillary services such as rapid power response, fully considering the mobile energy storage characteristics of electric vehicles, the use of electric vehicles with built-in battery supercapacitors, combined with pumped storage technology, can not only provide high-quality electricity for the power grid, it can also improve the efficiency of wind and photovoltaic power generation in the energy market by increasing wind and photovoltaic power generation.
Photovoltaic and wind power have natural complementarities and weak linear independence. It is difficult to determine the relationship between them with the traditional probability theory. The introduction of Copula theory provides a new method to solve this problem. In practice, the output of wind farm and photovoltaic power station in the same area are complementary. Therefore, Frank Copula function of negative correlation structure is chosen as the connection function between wind farm and joint distributed photovoltaic power station. The distribution and density functions of Frank Copula functions are:
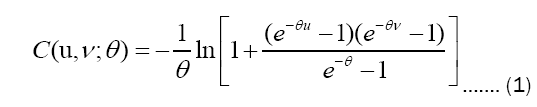
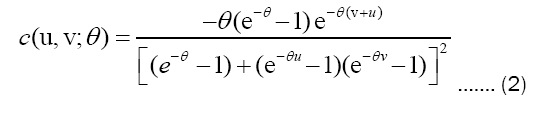
In the formula, u, v, he output of wind farm and photovoltaic power station is respectively represented, θwhich is a relevant parameter. At that time θ ≠0,θ>0,u,vit represents the output and shows a positive correlation; At that time θ →, u , v it means output and tends to be independent; at that time θ <;0,u, v, it means output and negative correlation.
Economic cost of wind farm: As the representative of new energy, wind power generation has the characteristics of no pollution and no coal consumption, but the intermittency of wind farm will seriously affect the security and reliability of power grid. The grid-connected wind power generation increases the rotating reserve capacity, which makes up for the uncertainty of wind power generation. The excessive penetration of wind power often leads to the abandonment of wind farms, resulting in the waste of resources and the reduction of wind power utilization. Therefore, this paper introduces the concept of the cost of abandonment penalty. Most wind farms are in the construction phase, so the relatively small operating costs are ignored here. The penalty cost of the spinning reserve capacity of a wind farm is:
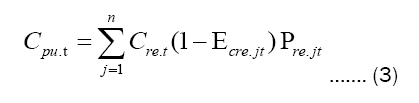
Where j respectively n number of wind farmsïüÃâºCpu.t indicates the cost of spinning reserve capacity per unit time of wind farmsïüÃâºCre.t for wind farms in t the price of spare capacity during the time period, Ecre.jt wind farm j exist reliability over time, Pre.jt wind farm j exist forecast output over time.
The penalty cost of wind farm abandonment is:
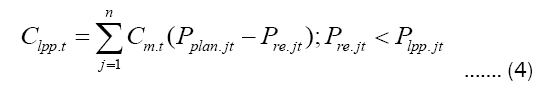
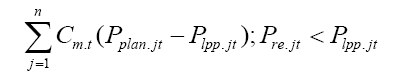
Where j respectively n number of wind farms, Cmt wind farm j exist t unit penalty cost during the time period, Pplan.jt wind farm j exist t planning and dispatching output within the time period, Plpp.jt wind farm j exist t limit penetration power in time period,Cpp.lt indicates the penalty cost of abandoning wind per unit time of the wind farm. Economic cost of wind farm:
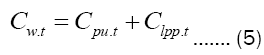
Where Cw.t wind farm t the total cost during the time period.
Economic cost of photovoltaic power station: Photovoltaic power generation is greatly affected by the weather and environment, large scale photovoltaic grid connection requires thermal power units to increase rotating reserve capacity to compensate for power fluctuation caused by output change, in this paper, the intermittent change of light intensity is transformed into the penalty cost of photovoltaic power generation. Because the operation and maintenance cost is relatively low and most of the costs are in the construction stage, this paper only considers the penalty cost of rotating reserve capacity, the economic cost of photovoltaic power station.
Where k indicates the number of photovoltaic power station, Pvka represents the planned power generation of the photovoltaic power plant, Cpv (Pvia) represents the economic output cost of photovoltaic power station in unit time, Nrp represents the penalty cost coefficient of rotating reserve capacity of photovoltaic power station, Cm it represents the economic output cost function of thermal power unit with the highest unit output cost at the maximum efficiency, Pvk represents the actual output power of the photovoltaic power station.
On the basis of considering environmental pollution and fuel loss, combined with the formula (5)ïýÞ(11). The objective function of minimizing the total power generation cost per unit cycle is proposed.
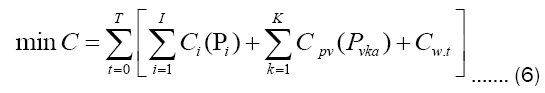
Where T indicates the number of cycles per unit, I, K respectively indicate the number of thermal power plants and photovoltaic power plants in the system within a period. The family energy management system is shown in Figure 3.

Figure 3: Schematic diagram of energy management system structure.
The output combination of wind farm and photovoltaic power station with wind-solar complementary independent operation configuration takes advantage of the natural characteristics of wind-solar complementary to a certain extent, and the fluctuations of the power into the network will be improved when the grid is connected. The reliability and security of the grid should be ensured, and the fluctuations of the power into the network should be small [9]. In this paper, the wind-solar complementarity characteristics are fully considered, and the reliability optimization strategy of wind-solar complementarity is adopted to configure the output power and rotary reserve capacity of photovoltaic power stations and wind farms under the condition that the economic cost of the objective function is small.
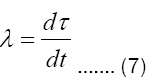
Wind power generation and photovoltaic power generation are greatly affected by the environment. In order to measure the correlation degree of wind-solar complementarity, the correlation change rate of wind-solar complementarity is defined in this paper λ.
In this paper, the credibility of wind-solar complementarity is defined by fuzzy opportunity constraint, and the credibility measure of wind-solar complementarity can be solved by possibility measure. For the possibility space, the credibility of the event is expressed as [10-12]:
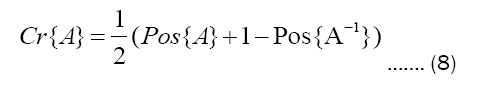
Where  show event A credibilityïüÃÅ
 show event A show event A-1 show event A opposing events.
In order to define the power fluctuation of the wind-solar hybrid grid-connected system, this paper introduces the credibility into the wind-solar hybrid system and defines the confidence level ,δ expressed asïüÃÅ¡
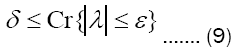
Where ε indicates the minimum acceptable change rate of wind output.
According to formula (22), Figure 1 can be obtained, it can be seen from Figure 1 with the Kendall rank correlation coefficient τ With the increase of the negative correlation of the wind and solar hybrid system, the confidence level of the wind and solar hybrid system continues to increase; as the number of power stations M increases, the confidence level of the wind and solar hybrid system also shows a weak increase.
Figure 1 relationship between τ, M and δ of Kendall rank correlation coefficient, according to the definition of the robust optimal scheduling model, the expression of the wind-solar complementary robust optimal scheduling model in this paper. It can be seen that the robust optimal scheduling model in this paper is a classic nonlinear quadratic programming problem, and this paper uses optimization dual internal point generation to solve it.
Analysis of calculation examples: In order to verify the application of the system in actual scenarios, a simplified power system of 2 wind farms and 2 photovoltaic power plants was used as an example to conduct optimization dispatch analysis and confidence level analysis of wind-solar hybrid power generation system. Use 80MW photovoltaic power plant and 80 MW wind farm. Considering the actual local situation, this paper chooses the study period from 8:00 to 18:00, and the power output forecast is shown in Table 1. Considering the actual local situation, this paper chooses the study period from 8:00 to 18:00, and the power output forecast is shown in Table 1. The robust optimization theory is used to deal with the uncertain variables in the wind-solar hybrid system, which enhances the robustness of the system.
Figure 4 shows the relationship between the number of power stations and confidence level in the wind solar complementary system. It can be seen that with the increase of the number of power stations, the confidence level increases accordingly, indicating that the number of power stations plays a supporting role in the safety and reliability of the whole power grid and plays a vital role in the robustness of the whole power grid. Figures 5 and 6 shows the output comparison diagram of wind solar complementary system under different confidence levels. It can be seen that with the improvement of confidence level, the power output of wind solar complementary system is more stable. This is because the greater the negative correlation of wind solar complementary system, the more significant the output power of wind power generation and photovoltaic power generation has the characteristics of mutual compensation. Robust optimal scheduling also takes into account the randomness and intermittence of photovoltaic output and wind farm output, making the scheduling results more robust. The effect diagram of different confidence intervals is shown in Figure 5.

Figure 4: Curve diagram of PV forecast output.

Figure 5: Relationship between M and δ, the results show that the proposed algorithm is robust when δ =0.9. Note:
Because when the change rate of the total output of the photovoltaic power plant and the wind farm fluctuates greatly, the robust optimal scheduling introduces the confidence level into the decision strategy under the condition of considering the correlation, intermittence and uncertainty of the wind farm and the photovoltaic power plant, which makes the decision strategy more robust. When the confidence level is 0.1, it shows that the scheduling strategy does not consider the uncertainty of the output of each electric field, the output of each photovoltaic power station and wind farm is the expected output, the output of each power station is regarded as a fixed value, and no scheduling strategy is made. The robust optimal scheduling under the power grid confidence level is the traditional economic scheduling without considering the output uncertainty. With the improvement of confidence level, the consideration of uncertainty of photovoltaic power plant and wind farm will gradually increase. When the confidence level is 0.9, the scheduling strategy will fully consider the intermittency and complementarity.
Intelligent optimal dispatching of electricity load in rural households
Through load-side management, household energy efficiency is improved and electricity costs are saved. Establish an equivalent model for the temperature control load in the family, and dispatch it with the goal of demand response optimal dispatch. In view of the characteristics of new energy output forecast accuracy, random optimization and robust optimization are combined to give play to the advantages of both to promote the consumption of new energy in the grid. At present, there are few literatures on the application of this hybrid method in the optimal scheduling strategy of household smart electricity consumption while considering the uncertainty of users' electricity consumption behavior.
Next, we combine the optimal dispatch of rural household electricity load to study. According to the operating characteristics of the household electricity load and its controllability for the household energy management system, the article divides the household electricity load into the following four categories: basic load, Unschedulable flexible load, schedulable uninterruptible load, temperature control load. The household energy management system needs to consider the uncertainty of users' electricity consumption behavior in the decision-making process. The model is shown in formula (9):
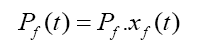
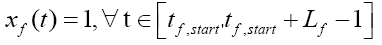
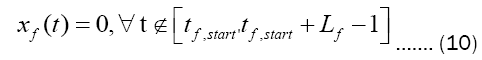
Where Pf (t) for t unschedulable flexible load power consumption in a time period; Pf The power consumed when the load is running; xf(t) for t The operating status of the load during the time period; tf,start and Lf It is the initial running time and rated running time of a task for this load.
Washing machines, dryers, dishwashers, etc. are schedulable and uninterruptible loads with fixed working cycles and a certain degree of flexibility in running time. They can be scheduled by the home energy management system. After startup, they must run continuously until the task is completed. The model is not schedulable. The form of the flexible load model is the same. Scheduling this type of load will not significantly restrict users' daily life behaviors.
Generally speaking, as the distance from the operating point increases, the prediction accuracy of photovoltaic power generation output gradually decreases. The short-term forecast of photovoltaic power output (0~72 h) has an error of 5%~25%, mostly concentrated in 10%~20%, while the error of ultra-short-term forecast (0~4 h) can be less than 1% [19-21]. Unlike wind power, the photovoltaic power generation system only generates electricity during the day and the output power at night is 0. Therefore, when HEMS formulated the scheduling strategy for the second day the night before, the forecast of the output of the distributed home grid-connected photovoltaic system on the second day was obtained. The value has a large uncertainty, and the photovoltaic power output of the time period closer to the operating point (such as the early morning period of the next day) is a certain value of 0. In order to ensure the flexibility and freedom and comfort of users, promote the local consumption of photovoltaic and wind power while minimizing the operating cost of the system. In the time period close to the time point of formulating the scheduling strategy, the output of photovoltaic power generation is a certain value of 0, and the prediction accuracy of the user's electricity consumption behavior is relatively high. The PSO training diagram is shown in Figures 6 and 7[22-25].

Figure 6: PSO training Gaussian function graph, the green dot is the optimal position.
The predicted expected value and fluctuation range of photovoltaic power generation output on the next day and outdoor temperature are shown in Figures 1 and 2 respectively. The sunrise time of the next day is 06:00 and the sunset time is 19:30, so the scheduling strategy uses 06:00 as the switching point between random optimization and adjustable robust optimization. Among the parameters of the air conditioning system, R, C, Q, Tset, and σ are respectively 12.8°C/kW, 0.36 kW.h/°C, 1.5 kW, 26°C, and 2°C, and the initial indoor temperature is 26°C. In the calculation example, the price of electricity sold by the user to the grid is 0.34 yuan/kW.h, and the price of electricity purchased from the grid is the peak-to-valley price, and the peak-hour (10:00-15:00, 18:00-22:00) price is 0.9 Yuan/(kW.h), the electricity price during valley hours (00:00-07:00) is 0.3 yuan/(kW.h), the rest of the time is normal, the electricity price is 0.5 yuan/(Kw.h).

Figure 7: Training scatter plots of different algebras.
The system scheduling period in the article is T=24 h, which is equally divided into N=96 time periods, and each time period is Δt=15 min. In the example system, the distributed power supply includes a distributed photovoltaic power generation system with a total capacity of 2.5 kW and an energy storage system with a total capacity of 10 kW•h. The remaining parameters of the energy storage system are shown in Table 1.
The random optimization stage is from 00:00-06:00 the next day. In this stage, the photovoltaic output is 0, the load is lighting fixtures and hot water boilers, and the power is 0.25 kW and 1.8 kW, respectively. Cut it into three scenes, the probabilities are 0.3, 0.5, 0.2. The decision variables at this stage are the charge/discharge power of the energy storage system, the on-off state of the air-conditioning system, and the power supply state of the fan. The constraint range of EB(tsw) at the end of random optimization is further reduced, and k is 0.1 in formula (26).
In this paper, the CPLEX solver is called to solve the MILP problem through the YALMIP toolbox in MATLAB.
If an adjustable robust optimization method is used to formulate a scheduling strategy for the entire scheduling cycle (ie 0-24h), the total operating cost of the system is 3.481 yuan, of which the total cost for the 00:00-06:00 time period is 0.1578 yuan, and the electricity purchase The cost is 0.6337 yuan, the battery life loss cost is 0.4261 yuan, and the electricity sales income is 0.902 yuan. Compared with the random and adjustable robust optimization hybrid scheduling proposed in the article, the one-stage optimization method that uses pure robust optimization for the entire scheduling cycle takes into account the use of users with a small probability of occurrence during the 00:00-06:00 time period. In extreme cases of electrical behavior, the random and adjustable robust optimization proposed in the article is aimed at the characteristics of less uncertainty in the 00:00-06:00 time period, and adopts a scenario-based random optimization method, which effectively reduces the operating cost of the system. Improve the economic efficiency of household electricity.
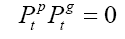
Pumped energy storage unit model and constraints: The power generation of a pumped energy storage power station in operation is not only related to the number of generating units and each output, but also needs to be less than the reservoir energy storage (in MW.h) that the power station can provide, as shown in equation (11). The pumping mode unit runs at rated power PpN, and the total pumping power needs to be less than the wind power during this period and the energy storage corresponding to the remaining water storage space of the pumped energy storage power station, as shown in equation (12). The unit cannot be in the state of pumping water and generating electricity at the same time, and the design constraints are shown in equation (13). In addition, the total number of pumped generator sets N remains unchanged, and the number of start and stop units can be calculated according to the number of units N0t in shutdown conditions at each time period, as shown in equations (14), (15) and (16).
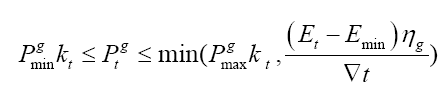
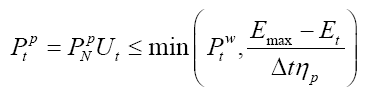

In the formula,  are the power generation and pumping power of the pumped-storage unit in period t, respectively; is the power generated by the wind turbine in period t,
  are the minimum and maximum power generation of a single unit, respectively, in MW;
  are the number of units in power generation and pumping conditions during the t period, respectively; is the energy storage of the upper reservoir at the beginning of the t period, MW·h; ηp and ηg are the pumping and power generation efficiency of the unit respectively;
  , Respectively the number of units starting and stopping during t period;
  are the minimum and maximum energy storage available in the pumped storage power station reservoir, MW·h. With the goal of minimizing the cost of the combined operation of wind power and pumped energy storage, considering the start-up and shutdown costs of the generator set in the pumped energy storage power station, the objective function is:
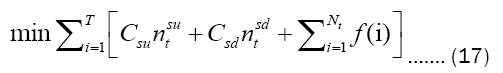
In the formula,  are the number of units starting and stopping; f(i) is the fuel cost of a conventional unit. The constraints are as follows:
System power balance constraints.
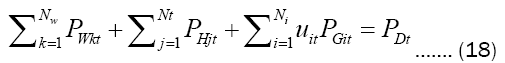
In the formula, NW is the total number of wind farms;PWkt is the total output of all units in the wind farm k during period t; PDtis the load value during period t; Nt is the number of pumped energy storage units;PHjt is the total number of pumped energy storage units j for all units during period t The total output; Ni is the total number of thermal power units; PGit is the output power of the thermal power unit i in the period t. This article does not consider the network loss and network restrictions, and believes that the system is capable of accepting a certain percentage of wind power into the grid in full. System standby constraints.

In the formula, PGmax, i is the maximum output power of thermal power unit i; PHmax, j is the maximum output power of hydropower station j; kd and kw are the coincidence fluctuation coefficient and the wind power fluctuation coefficient, respectively, taking 10% and 15%. The system requires the reserve capacity to meet the random fluctuations of wind power and load.
Electric vehicle cluster energy storage unit model and constraints: According to the owner's travel and electric vehicle SOC, three control modes are formulated: travel mode, regulation mode, and standby mode.
(1) Travel mode: electric vehicles are charged when the state of charge is lower than 90% SOC, and participate in grid regulation or wait when the state of charge is higher than 90% SOC;
(2) Regulation mode: The electric vehicle is charged when the state of charge is lower than the preset SOC, and participates in grid regulation or waiting when the state of charge is higher than the preset SOC, as shown in Figure 2.
(3) Standby mode: The user has no travel demand in the near future, and the electric vehicle fully participates in the regulation of the grid, and the electric vehicle is charged when the state of charge of the electric vehicle is lower than the preset SOC lower than 25%. Stop charging when it is higher than 90%, and between 25% and 90%, electric vehicles participate in regulation or wait.
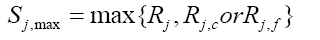
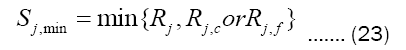
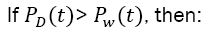
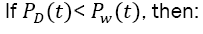
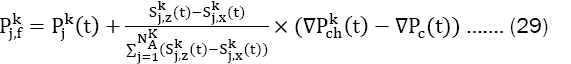
Electric vehicles in cities are mainly buses, taxis and private cars. Among them, the number of private cars accounted for most of the total number of electric vehicles. The urban private car mileage and the initial state of charge of electric vehicles are linearly inversely correlated, and logarithmically distributed. Figure 3 shows the initial state of charge of electric vehicles during working days. The probability density, calculated from Figure 3, shows that 92.4% of users have a state of charge higher than 0.6, and users higher than 0.8 account for 78.6%. During the network access period (sjmin,sjmax) is the range of SOC that electric vehicles can output, Sj, x is the SOC value required by the car owner to travel. Modeling the energy storage capacity of single electric vehicles, the real-time SOC of electric vehicle batteries and supercapacitors are as follows:
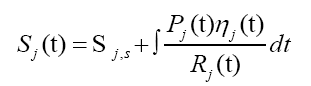
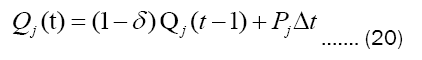
Where σj is the supercapacitor self-discharge rate;Pj(t) is the charge and discharge power at time t, Qj(t-1)is the remaining capacity of the supercapacitor at time ,t-1 and Δt is the difference between time tn-1and time tntime interval. The mathematical model of the relationship between the remaining capacity of the charging and discharging power of the electric vehicle battery equipment and its SOC during the working period.
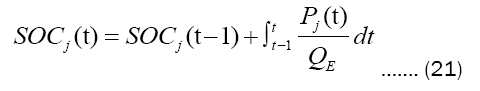
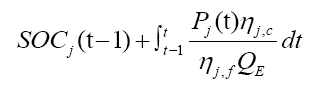
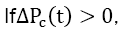
In the formula, SOCj(t-1) is the SOC of the battery at t-1, QE is the capacity of the battery, nif and njc are the discharge and charging efficiency of the battery, Pj(t) Is the real-time output power of the battery at time t,Pj (t)>0 means charging, and (t)<0 means discharging. Taking into account the travel demand of single electric vehicles, the energy storage capacity of single electric vehicles is modeled, as shown in equation (3):
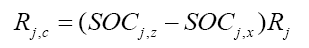
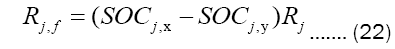
Where Rj,c is the chargeable storage capacity of electric vehicles,Rj,f is the dischargeable energy storage capacity of electric vehicles, and Rjis the total capacity of electric vehicles. Under constraints:
The cluster energy storage system of electric vehicles is based on the energy storage capacity model of single electric vehicles. From the number of network access NA clusters at time t, the system calculates the overall energy storage capacity of electric vehicles to form a cluster energy storage system. The definition set NA={1,..,j-1,j,j+1,...,na(t)} is the k set of electric vehicles, and the energy storage capacity and SOC of the electric vehicle cluster are as follows:
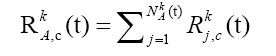
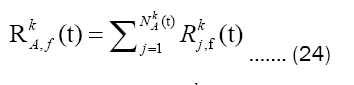
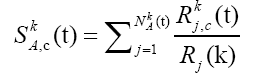
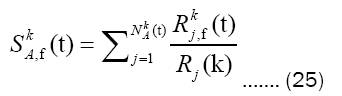
Where RA is the equivalent battery energy storage capacity of the electric vehicle cluster; SA is the equivalent battery SOC value of the cluster. In order to make full use of the energy storage capacity of electric vehicles and reduce the impact of tie-line power fluctuations on the grid, a power adaptive allocation algorithm is proposed Stabilization control strategy; the realization of coordinated control is mainly divided into the following three steps.
Determine the total output power of multiple electric vehicle clusters, that is, the tie line power leveling target value.


Determine the target change value of the total output of the electric vehicle cluster  According to the different cluster energy storage capabilities of different electric vehicles, use the following procedures (a)~(d) to determine the target change value of the cluster output power.
If 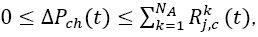 clusters with larger energy storage capacity are allocated to provide more smoothing tasks.
If 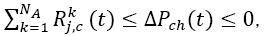 assign clusters with smaller energy storage capacity to provide more smoothing tasks.
 the cluster energy storage can only complete part of the smoothing, and the remaining tasks are completed by the back energy storage equipment.
 cluster energy storage can only complete part of the smoothing, and the remaining tasks are completed by the back energy storage equipment, city total load curve under different penetration rates is shown in Figure 8.

Figure 8: City total load curve under different penetration rates. .....best)
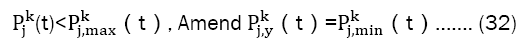
Make full use of the cluster energy storage capacity of electric vehicles, smooth power fluctuations, consider the upper and lower limits of electric vehicle output power and SOC constraints, and determine the output power of electric vehicles 
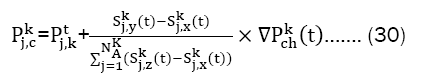
 considering the high cost of discharging electric vehicles, electric vehicles take less discharge tasks during the control process. At this time, the power adaptive allocation algorithm is used to preferentially call the backup energy storage to supplement the discharge capacity. Electric vehicles with higher SOC provide more power distribution as follows:
 electric vehicles with lower SOC provide more power allocation as follows:
 electric vehicles with lower SOC provide more power allocation as follows:

Therefore, the total output power of electric vehicle cluster energy storage is:  cluster energy storage system The energy management coordination control strategy is mainly divided into three modes to allocate energy,
Large-scale disorderly electric vehicles entering the grid not only did not play a good role in shaving the peak and filling valleys of the original load, but aggravated the fluctuation of the load to a certain extent. After the electric vehicles entered the grid, the overall electricity load of the urban distribution network was increased. It poses higher challenges to the reliability, economy, and safety of the distribution network.
Therefore, in this article, the power fluctuation of the tie line is the research object, aiming at the fluctuation of wind power output, and reducing the load pressure of the distribution network, using electric vehicle groups in various regions to stabilize the power fluctuation of the tie line to provide energy for the city. The article mainly focuses on the functional energy. Scheduling the use of stabilization control strategies and the use of electric vehicle cluster energy storage to effectively smooth the power fluctuations of the tie-line, effectively reduce the power fluctuations of wind power access, smooth wind power grid connection to improve wind power consumption, and reduce the impact of large-scale electric vehicles randomly accessing the grid on electric vehicles. Accurate modeling of single electric vehicles, combined with network access characteristics, and taking into account the travel needs of vehicle owners, assessing the cluster energy storage capacity of electric vehicles, equipped with adaptive power allocation algorithms, and enhancing the ability to adjust the output power of electric vehicles. The use of electric vehicle clusters to build a cluster energy storage system, so that the fixed energy storage equipment system is only used as a backup resource, which effectively reduces the requirements for the capacity of the energy storage system for wind power access to the grid. City total load curve under different scenarios is shown in Figure 9.

Figure 9: City total load curve under different scenarios.
Photovoltaic water pump
The basic structure of the photovoltaic water pump system. The photovoltaic water pump system is a system that integrates "light, machine, electricity, materials" and other multidisciplinary high-tech systems. It is not only applied to traditional technologies such as photovoltaic materials, solar energy harvesting, power electronic conversion, and motor drive control. The results will be applied to super management systems such as the Internet of Things and cloud platforms in the near future. Photovoltaic water pump systems have high practical value in domestic water, seawater desalination, desert management, agricultural irrigation, grassland animal husbandry, scenic fountains, sewage treatment, etc. The core technology of photovoltaic water pump system lies in two parts: AC and DC power conversion and water pump motor drive control.
According to the working characteristics of the photovoltaic water pump, by adjusting the rotation speed of the load of the water pump, the working point of the photovoltaic array can be controlled, so that the system can output the maximum power stably. For an asynchronous motor, the rotation speed can be adjusted by changing the voltage and frequency. From the above-mentioned T-type equivalent circuit of the asynchronous motor, the voltage of each phase of the stator of the three-phase asynchronous motor can be obtained. As long as U1 and f1 are controlled, the magnetic flux can be controlled. Three-phase asynchronous motor variable voltage frequency conversion speed regulation has the following characteristics: (1) Speed regulation from the base frequency downwards, keeping the magnetic flux constant, which is a constant torque speed regulation method; from the fundamental frequency upwards, the magnetic flux and The frequency decreases in inverse proportion, which is approximately a constant power speed regulation mode; (2) The motor frequency f can be continuously adjusted. The three-phase asynchronous motor is a non-linear, multi-variable, strong coupling, multi-parameter system, which is difficult to accurately control by simple external control signals.
When the temperature is constant, the maximum output power of the photovoltaic array increases with the increase of the light intensity. Since the power of the water pump in the photovoltaic water pump system is approximately proportional to the cube of the speed, and the speed is proportional to the frequency, adjusting the output frequency of the inverter power supply is equivalent to adjusting the power of the load motor. The controller adopts an optimized sliding mode control strategy, a fixed duty cycle control in the steady state of MPPT, and an optimized sliding mode control in the tracking state. This control strategy can effectively reduce power chattering. The power chattering curve of the optimized sliding mode control method is smoother than that in the literature, and the chattering is smaller. Through the simulation data, we can know that the optimized sliding mode control MPPT technology can quickly track the maximum power point. When the external light intensity changes suddenly, it not only has a faster dynamic response speed, but also has a smaller chattering.
After the bus voltage setting value is compared with the DC voltage measured by the photovoltaic array feedback, the deviation value is passed through the PI regulator to obtain the frequency control signal. The frequency signal is converted into the motor stator reference phase voltage through the voltage-frequency ratio curve, and then pulses are generated by the SVPWM generator Signal to control the duty cycle D of the power switch tube of the IPM module to adjust the output voltage and frequency of the inverter. The algorithm mainly includes the following steps:
Step-1: Determine the sector where the composite vector is located.
Step-2: Calculate the action time of two adjacent vectors in real time.
Step-3: Determine the conduction time of each bridge arm.
Step-4: Obtain the PWM duty cycle D of each phase.
Step-5: Update the corresponding register value.
The commonly used water pumps in photovoltaic water pumping systems mainly include positive displacement pumps and centrifugal pumps. The working principle of positive displacement pumps is to pump water through periodic changes in the internal volume of the pump; centrifugal pumps use the centrifugal force generated by the high-speed rotation of the impeller to form a vacuum at the impeller inlet, Press the water into the pipeline to complete the pumping under the action of atmospheric pressure. Simply put, positive displacement pumps work by volume conversion, and centrifugal pumps work by centrifugal force. The user determines the type and power level of the pump according to the actual use conditions, mainly according to the different requirements of flow, head, and efficiency. Using the methods we have researched can greatly improve the utilization of wind and solar energy, reduce dependence on fossil energy, and reduce carbon emissions. The later research plan will combine sensor technology to automatically detect soil moisture, nutrient elements, and light conditions. Watering plants and supplementing light is like installing a brain for plants that can manage their own growth environment.
The relationship between energy transition and carbon dioxide
The impact of the system on carbon dioxide emissions: The use of fossil energy such as coal and petroleum provides basic impetus for economic and social development, but also produces pollutants such as sulfides, nitrides, inhalable particulate matter and CO2, causing environmental pollution and global climate change, thus promoting energy Transformation has always been a hot and frontier issue in the international community. Since 2006, my country has become the world’s largest energy consumption and CO2 emitter. In 2019, coal consumption accounted for 51.7% of the world’s total and CO2 emissions accounted for 28.8% of the world’s total. The coal-based energy structure is facing domestic requirements to improve the environment, International pressure to reduce CO2 emissions. In addition, my country has a high degree of dependence on foreign oil and natural gas, and energy security is facing potential threats. Therefore, promoting my country's energy transition and optimizing the energy structure are issues that urgently need to be resolved in the sustainable and coordinated development of energy, economy, and environment. The internal mechanism of the energy revolution promoting the rise of high quality in Central China is shown in Figure 10.

Figure 10: The internal mechanism of the energy revolution promoting the rise of high quality in Central China.
Scenario design of energy revolution boosting energy structure transformation: The core of the energy revolution is the development of clean and low-carbon energy, which is manifested in changes in energy structure in terms of energy consumption. The energy consumption structure of the five central provinces is dominated by coal, and coal consumption accounts for a relatively high proportion of total energy. In recent years, driven by technological innovation, the proportion of direct coal consumption has shown a downward trend, and the clean conversion rate of coal has been greatly improved; various provinces have vigorously developed renewable energy such as wind energy, solar energy, hydropower, and biomass energy. Form a multi-energy system such as wind-solar complementation, water-light complementation, etc. In regional energy cooperation, "West-East Gas Transmission", "West-East Electricity Transmission", "North Coal-South Transportation", UHV smart grids, etc., have provided energy structure transformation in the central region. Facilitating conditions; accordingly, a scenario where the energy revolution promotes the transformation of the energy structure in the central region has been constructed (see Table 2).
| province | Time/year | Baseline development scenario/% | Energy revolution scenario/% | ||||||
|---|---|---|---|---|---|---|---|---|---|
| coal | oil | natural gas | Renewable Energy | coal | oil | natural gas | Renewable Energy | ||
| Henan province | 2020 | 68.3 | 15.9 | 6.8 | 9 | 68 | 15.9 | 6.8 | 9.3 |
| 2025 | 57.7 | 19.5 | 8.5 | 14.2 | 57.4 | 19.5 | 8.5 | 14.5 | |
| 2030 | 48.7 | 20.7 | 10.6 | 20 | 48.4 | 20.7 | 10.6 | 20.3 | |
| 2035 | 41.4 | 21.3 | 13.4 | 23.9 | 40.9 | 21.3 | 13.4 | 24.4 | |
| Anhui province | 2020 | 70.5 | 18 | 5.2 | 6.3 | 70 | 18 | 5.2 | 6.8 |
| 2025 | 66.4 | 18.2 | 8.1 | 7.3 | 63.8 | 18.2 | 8.1 | 9.9 | |
| 2030 | 61.5 | 18.4 | 9.3 | 11 | 58 | 18.4 | 9.3 | 14.3 | |
| 2035 | 56 | 18.6 | 10.1 | 15.3 | 53.3 | 18.6 | 10.1 | 18 | |
| Hubei province | 2020 | 47.3 | 21.7 | 5.4 | 25.6 | 47 | 21.7 | 5.4 | 25.9 |
| 2025 | 43.4 | 21.9 | 8.8 | 25.9 | 43.1 | 21.9 | 8.8 | 26.2 | |
| 2030 | 37.4 | 22.2 | 14.2 | 26.2 | 37.1 | 22.2 | 14.2 | 26.5 | |
| 2035 | 32.5 | 22.5 | 18.5 | 26.5 | 32.5 | 22.5 | 18.5 | 26.8 | |
| Hunan province | 2020 | 63.7 | 16.4 | 3 | 16.9 | 63.4 | 16.4 | 3 | 17.2 |
| 2025 | 60.3 | 16.6 | 4.8 | 18.3 | 60 | 16.6 | 4.8 | 18.6 | |
| 2030 | 55.6 | 16.9 | 7.8 | 19.7 | 55.3 | 16.9 | 7.8 | 20 | |
| 2035 | 51.8 | 17.1 | 10.1 | 21 | 51.5 | 17.1 | 10.1 | 21.3 | |
| Jiangxi province | 2020 | 68.8 | 18.2 | 4.1 | 8.8 | 68.5 | 18.2 | 4.1 | 9.1 |
| 2025 | 63.1 | 18.5 | 6.7 | 11.7 | 62.8 | 18.5 | 6.7 | 12 | |
| 2030 | 53.4 | 18.7 | 10.8 | 17.1 | 53.1 | 18.7 | 10.8 | 17.4 | |
| 2035 | 44.6 | 19 | 14 | 22.4 | 44.3 | 19 | 14 | 22.7 | |
Table 2. Energy structure scenarios of the five central provinces.
Path choice for the energy revolution to boost the rise of the central region
Energy demand of different paths in the rise of the central region: Integrate various macro overall factors in the process of the rise of the central region, such as economic growth, industrial development, new urbanization, energy efficiency, per capita income, and living energy, into different options for development paths, and obtain different options through policy guidance and implementation. Development path and corresponding effects. According to different scenarios, the energy demand of the five central provinces under different paths from 2020 to 2035 can be obtained.
Take the scenario of high economic growth as an example (see Figure 2). By 2035, the rising energy demand in the central region will show an increasing trend without an inflection point, and the energy demand will be about 8.45 × 10⁸~1.0 × 10⁹ tce. For example, if the energy revolution is adopted to promote industrial structure optimization and energy efficiency improvement (SE11 path), the energy demand in 2035 will be approximately 9.12 × 10⁸ tce; if the energy revolution cannot promote industrial structure optimization and energy efficiency improvement, the urbanization process will accelerate (SE14 path) ), the energy demand is about 1.0 × 10⁹ tce; if you choose one of the two to promote the upgrading of industrial structure and improve energy efficiency, it is the SE12 or SE13 route, but the energy demand of the SE13 route is 4.55 × 10⁷ lower than that of the SE12 route tce, this shows that the improvement effect of energy technology efficiency is higher than that of industrial structure optimization. Future carbon dioxide emissions under different scenarios (Figure 11) energy demand under high economic growth scenarios.

Figure 11: Future carbon dioxide emissions under different scenarios Figure 2 Energy demand under high economic growth scenarios. 
In the context of benchmark economic growth, by 2035, the energy demand of the five central provinces will be approximately 9.01 × 10⁸~9.74 × 10⁸ tce. In the case of industrial structure upgrade and energy efficiency improvement (SE24 path), the energy demand in the central region is about 9.01 × 10⁸ tce; if the energy revolution cannot promote the upgrading of the industrial structure and improve energy efficiency, the energy demand is about 9.74 × 10⁸ tce; other situations are somewhere in between. In the energy revolution, if the industrial structure is adjusted and energy efficiency is synchronized (SE22 path), the energy demand is about 9.11 × 10⁸ tce; if only the industrial structure upgrade is promoted without improving energy efficiency (SE23 path), the energy demand is about 9.60 × 10⁸ tce; in the context of accelerating urbanization, the industrial structure and energy efficiency remain unchanged (SE25 path), and the energy demand is about 9.58 × 10⁸ tce. Under the background of low economic growth, by 2035, energy demand is divided into four situations: the baseline scenario (SE31 path), the energy demand is about 9.11 × 10⁸ tce; the baseline scenario and the energy revolution improves energy efficiency (SE32 path), energy The demand is about 8.57 × 10⁸ tce; the additional energy revolution of the SE32 path accelerates the optimization and upgrading of the industrial structure (the SE33 path), and the energy demand is about 8.99 × 10⁸ tce; the additional energy revolution of the SE33 path not only promotes the optimization of the industrial structure but also improves energy efficiency. The demand is about 8.45 × 10⁸ tce.
It can be seen that the combination of the energy revolution strategy and the central region's rise strategy will help promote the high-quality development of the central region. The energy revolution promotes the transformation and upgrading of the industrial structure in the central region by transforming the energy structure and improving energy efficiency, and plays a positive role in the development of new urbanization in the region and the improvement of residents' living standards. Under the conditions of comprehensive consideration of economic growth, industrial development, urbanization, and existing energy-saving policies, the energy demand in the central region will continue to rise along with the advancement of industrialization and urbanization. There will be no turning point before 2035, but energy efficiency will increase. The optimization of industrial structure will help reduce energy demand; the energy revolution scenario with the goal of building a diversified and complementary energy system will help the central region to reach the peak time of carbon as soon as possible, and promote the coordinated development of the economy, society, and environment in the central region. In response to the background of the rise of the central region, the following development suggestions are put forward for the regional energy revolution.
(1) Focus on the development of energy-saving and clean technologies to improve energy efficiency and clean and low-carbon energy supply. Energy consumption in the central region is dominated by coal, and the dominant position of coal in primary energy is difficult to change in the short term. Since thermal power is the main method of coal conversion in my country, the development of thermal power technology innovation is an important aspect of the development of related clean technologies. The clean use of coal is the focus of the future energy revolution, and energy saving and efficiency improvement is the first of my country's energy strategy; on the one hand, it will increase the upgrading of thermal power units and the elimination of small-scale units in the central region, and improve the energy input and output efficiency of various industries in the region. Carry out regulation and continuously improve the efficiency of energy utilization; on the other hand, plan and implement the development of renewable energy such as hydropower, wind power, photovoltaic, and biomass energy.
(2) Intensify the adjustment of industrial structure and transform to green, low-carbon and ecologicalïüÃÅThe energy revolution promotes the rise of the central region, which is not only a problem of the energy industry structure itself, but also a problem of advanced and ecological development of the entire industrial structure in the region. Under the new concept of ecological priority and green development, the central region should change the traditional extensive development method that relies on resources, focus on industrial transformation and upgrading, promote industrial restructuring according to local conditions, and develop towards low-carbon ecological development. It is recommended to incorporate the construction of ecological civilization into the process of industrial transformation and upgrading, develop new industrialization to adjust and optimize the industrial structure; change the industrialc model of "resources-products-waste discharge" of industrial civilization, and gradually shift to the development mode of ecological civilization and harmonious coexistence of man and nature; adopt advanced Technological transformation and upgrading of traditional industries, implementation of traditional technological transformation and upgrading, and the use of information technology and new energy technology to promote the ecological development of industries.
(3) Promote the reform of the energy system and build a multi-competitive market systemïüÃÅThe development and growth of new energy is inseparable from market breakthroughs. my country’s current "coal-electricity joint operation" and "coal-electricity integration" operating system has actually formed the monopoly of coal power on the grid, and new energy sources such as wind and photovoltaics are basically available in price. Conditions to compete with traditional thermal power. It is recommended to make use of the decentralized characteristics of new energy, combine with the construction of "beautiful villages" and "safe communities", adopt a development path from rural to urban, from life to production, design a competitive market, and better play the decisive role of the market in resource allocation . In view of the regional differences in the distribution of wind and solar energy, it is recommended that the provinces in the central region establish a consultation mechanism, break administrative divisions, and fully strengthen regional cooperation in the use of new energy; promote energy system reform, break institutional constraints and break regional gaps, and advocate renewable energy Prioritize the development and utilization of the environment, and better implement the concept of ecological priority development.
This research was supported by National Natural Science Foundation of China, 51367019.
Weiyan Xu*: supervision, funding acquisition, hardware, software, conceptualization, investigation, resources, writing–original draft, writing–review & editing. The authors declare no competing interests.
[Crossref][Google scholar] [EBSCO]