International Journal of Advanced Research in Electrical, Electronics and Instrumentation Engineering
ISSN ONLINE(2278-8875) PRINT (2320-3765)
ISSN ONLINE(2278-8875) PRINT (2320-3765)
Prof. Ashok.S.Chandak1, Dr. Anil J.Patil2
|
| Related article at Pubmed, Scholar Google |
Visit for more related articles at International Journal of Advanced Research in Electrical, Electronics and Instrumentation Engineering
The Three Axes Closed Loop Fiber Optic Gyroscope Signal Processing Unit is expected to perform extraction of rotation rate information (Sagnac Phase) from the Sensor and computation of incremental angles, digitization of accelerometer outputs and computation of incremental velocities and Compensation of the sensor outputs over operating temperature range.
Keywords |
| Rotation Measurement, Fiber Optic Gyroscope, Sagnac Effect, Navigation control |
INTRODUCTION |
| In the applications of guidance, navigation and the control systems in aircrafts and spacecraft require gyroscopes to maintain orientation in flight even in case of undesired interference [1]-[4]. In particular, the measurement of the angular motion of a satellite in the space is essential for the control and stabilization of its attitude.Systems employing a gyroscope include the control and processing electronics to provide the most direct method for sensing angular velocity.Traditionally, the angular momentum of a spinning rotor was used to determine the angular rate or displacement [5] – [7]. |
| Shortcomings of traditional methods: |
| 1. Susceptible to damage from shock and vibration. |
| 2. Exhibit cross axis acceleration sensitivity. |
| 3. For the lower cost versions have reliability problems. |
| So the Gyro based on Sagnac Effect Interferometer with no moving parts is having great future. |
LITERATURE SURVEY |
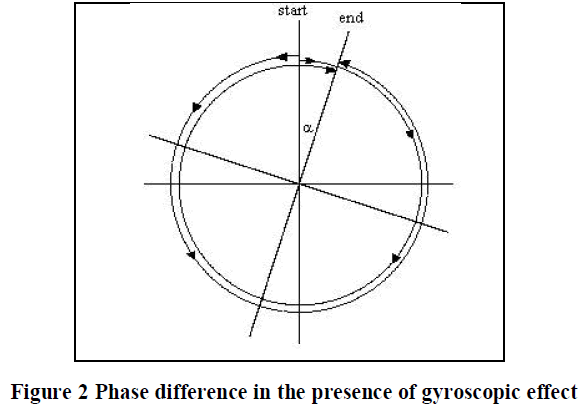
| Sagnac Effect :If two pulses of light are sent in opposite directions around a stationary circular loop of radius R, they will travel the same inertial distance at the same speed, so they will arrive at the end point simultaneously. This is illustrated in the figure 1 below |
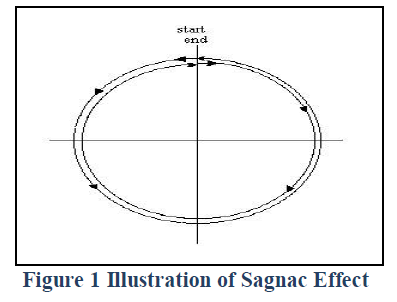 |
| Figure 2 indicates what happens if the loop itself is rotating during this procedure. The symbol Îì denotes the angular displacement of the loop during the time required for the pulses to travel once around the loop. For any positive value of Îì , the pulse traveling in the same direction as the rotation of the loop must travel a slightly greater distance than the pulse traveling in the opposite direction. As a result, the counter-rotating pulse arrives at the "end" point slightly earlier than the co-rotating pulse. |
 |
| Quantitatively, if we let w denote the angular speed of the loop, then the circumferential tangent speed of the end point is v= wR, and the sum of the speeds of the wave front and the receiver at the "end" point is c-v in the co-rotating direction and c+v in the counter-rotating direction. Both pulses begin with an initial separation of 2πR from the end point, so the difference between the travel times is |
| where A = πR² is the area enclosed by the loop. If photo detector is present at the end point and the beams emerging out are allowed to fall on it, consequently the beams will reach the detector at slightly different times, and slightly out of phase, producing optical interference "fringes" that can be observed and measured. This effect was first demonstrated in 1911 by Harress and in 1913 by Sagnac, so it is now often called the Sagnac effect. |
| Light passing from the laser through the polarizer is restricted to a single state of polarization, and the directional couplers and coil are made of special polarization-maintaining fiber to ensure a single mode path. Both directions of light travel are through the same path, and almost all environmental effects except rotation have the same effect on each beam and are cancelled. |
| The laser must exhibit low optical coherence, for rate gyros, compact disk-type laser operated below threshold has proven to be satisfactory |
PREVIOUS RESEARCH WORK |
| This research aims at introducing a new surveying system that avoids the inadequacies of magnetic surveying techniques and meets more adequately the requirements of modern operations. The new system utilizes surveying technology independent of magnetic-field monitoring and employs different surveying methodologies. The proposed system utilizes the technology of fiber optic gyroscopes (FOGs) for the rotational measurement. Inertial navigation techniques will be employed for the integration of the FOGs angular velocity measurements with the linear acceleration measurements provided by three mutually orthogonal accelerometers. |
| The objectives of this research project are as follows: |
| 1. Quantitative study of the applicability of the FOG technology for rotational measurement |
| 2. Adaptive filtering of the raw measurements obtained from the FOG and the accelerometers to reduce both sensor output noises. |
OPERATION |
| The principle of operation of the FOG is based on Sagnac effect. In 1913, Sagnac showedthat two light beams propagated along two opposite directions in a rotational loop interferometer make an optical path difference (equation 1) appear and consequently make a phase difference with respect to each other (equation 2). Both the optical path and the phase differences are proportional to the rotation rate |
| ΔL = (Ld/Co) Ω (1) |
| φs = (2π/λ). ΔL = (2 π L d/ λ Co) Ω (2) |
| where |
| L is the length of the fiber optic coil, |
| d is the diameter of the fiber optic coil, |
| Ω is the applied rotation rate, |
| Co is the speed of the light in free space, |
| λ is the peak wave length of the optical beam and |
| φs is the sagnac phase shift and ΔL is the optical path difference. |
| The lock-in amplifier output is sampled and quantized yielding the error signal, which is maintained, closed to zero by the digital feedback. The sampling frequency corresponds to the inverse of the radiation transit time τ, for the required synchronization of the ramp and the biasing signal. Starting from the error signal, the controller drives the phase modulator so that it generates phase steps of amplitude equal to the Sagnac phase shift and duration. The digital to analog converter {automatically creates the ramp reset, by means of its overflow. The reset step corresponds to a phase variation of 2π radian, in order to get always the correct Sagnac phase shift. In this scheme the rotation rateis directly obtained, in a digital format, from the error signal. Another advantage of this configuration, with respect to the analog solution, is the phase stability during the signal recovering. |
GENERAL DESCRIPTION |
Product perspective |
| The main functions of the Navigation signal measurement and Signal Processing Unit are:Extraction of rotation rate information (Sagnac Phase) from the Sensor outputs and computation of incremental angles.Compensation of the sensor outputs over operating temperature range.A rotation rate sensor based on Sagnac effect is used. In this sensor, the photo detector output measured at the phase modulation frequency is used as an error signal. The Signal Processing Unit accepts this error signal as input. The unit has a feedback loop which introduces a controlled amount of nonreciprocal phase difference to counteract the Sagnac Phase shift. Thus the net phase difference is maintained at zero. |
End users perspective |
| This unit will accept photo detector output and introduce a controlled amount of non-reciprocal phase difference to counteract the Sagnac Phase shift. The calculated values of incremental angles, velocities and status information will be output every 2.0 ms over a Analog Devices SPORT synchronous serial port protocol interface. A asynchronous RS-485 interface will used for calibration, firmware up gradation and diagnostics.The system will have a master reset on RS- 485 levels. |
OBJECTIVES |
| The objectives of the Signal Processing Unit are: |
| ïÃâ÷ Extraction of rotation rate information (Sagnac Phase) from the sensor outputs and computation of incremental angles. |
| ïÃâ÷ Digitization of accelerometer outputs and computation of incremental velocities. |
| ïÃâ÷ Compensation of the sensor outputs over operating temperature range. |
Feasibility of the objectives |
| The above mentioned objectives can be achieved by implementing appropriately designed Signal Conditioning Blocks, Data Converters and Signal Processing Units (DSP, FPGA). |
General requirements |
| The CLFOG outputs from the rotation rate estimators are also to be read at 5000 Hz rate and 10 samples over an interval of 2.0 ms are to be integrated to yield incremental angles. This process is to be repeated at every 2.0 ms interval. |
SPECIFIC REQUIREMENT |
Functional requirements |
| Implementation of rotation rate estimators should meet the following requirements: |
| 1) Rotation rate output should settle within 3 seconds. |
| 2) Bias (max): 0.1 deg/hour. |
| 3) In run scale factor stability better than 100 ppm. |
| 4) Scale factor repeatability better than 100 ppm over run to run and over day to day. |
| 5) Short term bias stability better than 0.01 deg/hour. |
| 6) Long term bias stability better than 0.1 deg/hour. |
| 7) Dynamic range of +/- 200 deg/sec. |
| 8) Linearity better than 100 ppm. |
Power requirements |
| The total power consumption of the PCB should be less than 5W over the specified temperature range. The final power supply requirements will be provided at the time of PDR. |
Software requirements |
| A suitable monitor program with facility for firmware up-gradation, testing and debugging is to be provided. |
Firmware requirements |
| FPGA based firmware for estimating the rotation rate and providing appropriate bias signal to input of CLFOG. |
Interface requirements |
| 1) Analog Devices 21xxx family SPORT synchronous serial port protocol on RS-485 serial bus data levels is required to output the values of incremental angles, velocities and TCLFSPU status data. |
| 2) PCB connector: To be decided at the time of PDR. |
| 3) A secondary communication interface for calibration, firmware up gradation, diagnostics etc. is to be provided on asynchronous RS-485 interface compatible to TI16C550. Also a provision for master reset on RS-485 levels to be made. |
Communication requirements |
| The values of incremental angles, velocities and SPU status data are to be output every 2.0 ms with a bit rate of 2.0 MHz in the form of 32-bit words. |
Performance requirements |
| The system performance will be evaluated based on the following: |
1) Settling time: |
| The output data from the SPU card is to be captured to a PC. The output from the SPU card is to settle within 3 seconds to their nominal values. |
2) Scale factor: |
| The outputs corresponding to the sensor should show the correct polarity of the rotation and their absolute values should be within 0.1 deg/hour to each other. |
3) Bias Drift Stability: |
| Short term bias drift stability: |
| The output data is to be averaged over 1 minute and the peak to peak fluctuations in the outputs corresponding sensor should not be more than 0.01 deg/hour. |
| Long term bias drift stability: |
| The data is to be captured over eight hours and using Allan Variance technique bias drift and Random walk figures of outputs corresponding to the sensor under test are to be calculated. |
4) Dynamic Range and Linearity: |
| Linearity should be better than 100 ppm. |
5) Scale factor Stability: |
| The Dynamic range and linearity test should be repeated over the temperature range -40°C to +70 °C. |
6) Threshold/ Resolution: |
| The threshold should be less than 0.01 deg/hour. |
| The resolution should be better than 0.01 deg/hour. |
7) Bandwidth: |
| SPU card output should have a bandwidth of 150 Hz for an output updated every 2 ms. |
8) Repeatability: |
| The dynamic range and linearity test should be repeated over three successive days. The outputs corresponding to the CLFOG axis should be within 0.1 deg/hour. |
SIMULATIONS RESULTS |
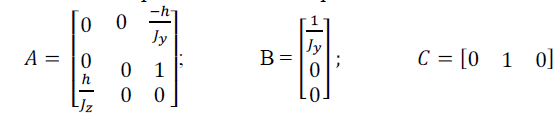
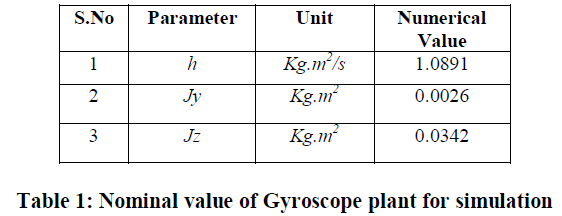
| In order to test the design of fiber optic gyroscope, following parameters are considered for simulation. The objective of the simulation is to illustrate the performance of the fiber optic gyroscope system with different real time scenarios. For different simulation scenarios linear quadratic controller (LQR) is designed. The state space model of the gyroscope system is given by |
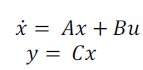 |
| where the system parameter matrix A, input matrix B and output matrix C are defined as, |
 |
| The state vector x is defined as |
 |
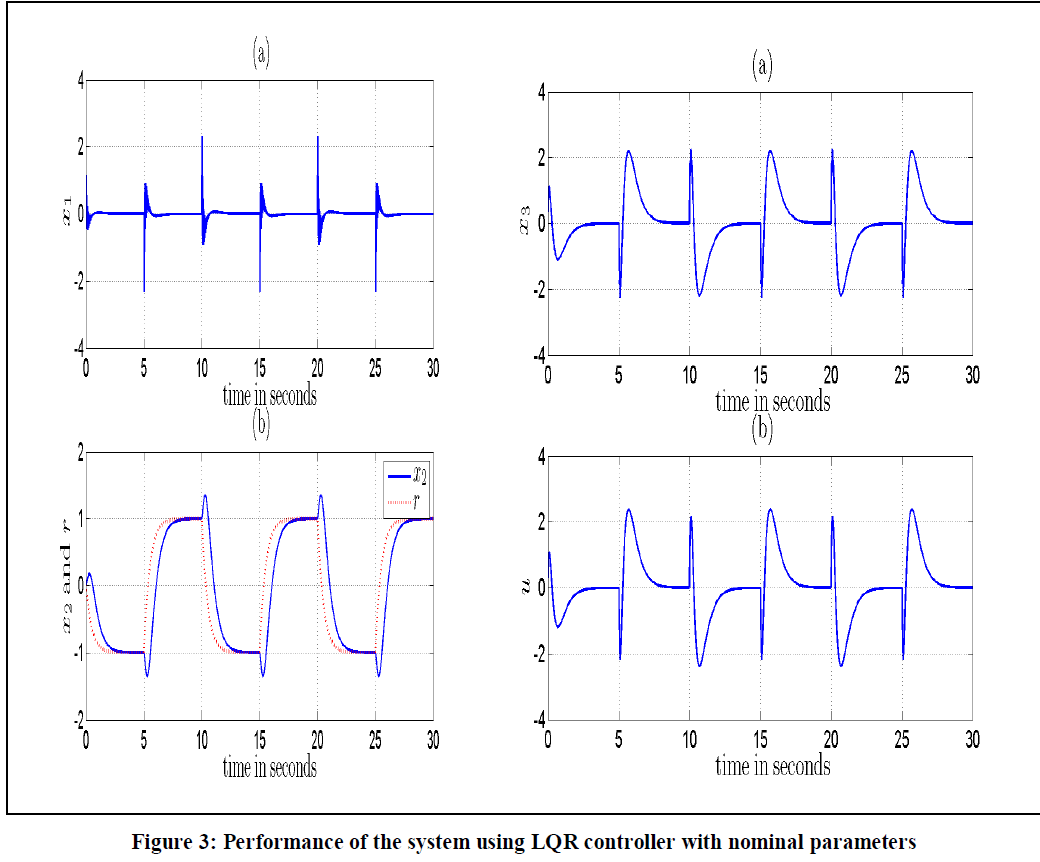
| Figure 3 shows the performance of the system to track the filtered square wave reference. It can be observed from the Fig. 3 that the output track the reference signal satisfactorily in the steady state. The other states ïÿýïÿýïÿýïÿý and ïÿýïÿýïÿýïÿý are stable can be shown in Fig.3. The control input signaluchanges as the error between the output and reference changes. |
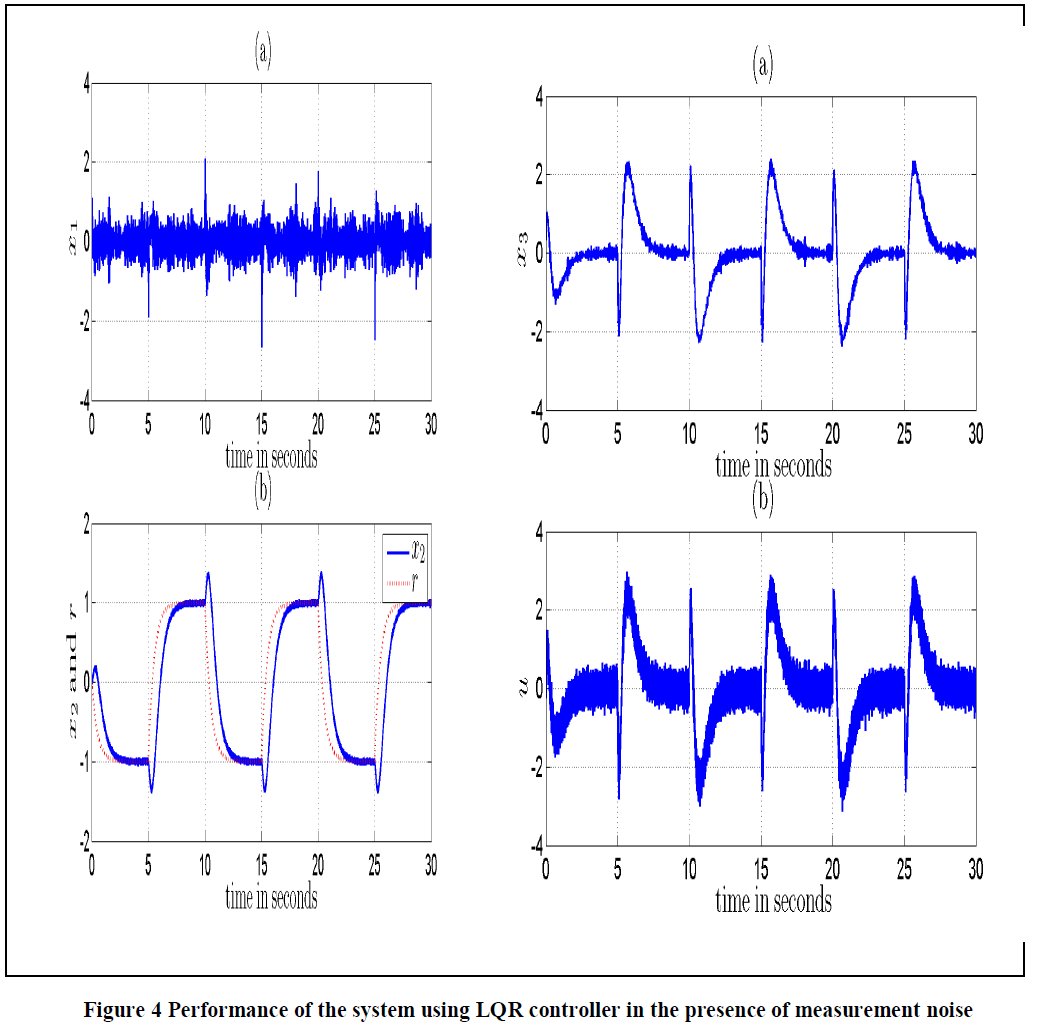
| Next the performance is carried out in the presence of measurement noise. It was expected that the output should track the reference signal and all other signals should be bounded. The white noise is injected in the output signal of magnitude1 × 10. The plots of the states and the control input are shown in Fig. 4. The measurement noise effect can be seen in the first signal and the third signal more as compared to the output signal. The measurement noise is injected to the output and passes it to input side and finally transmit to system signals and makes the closed loop of system signals. It has been noticed that the larger magnitude of noise may lead to unstable condition of the plant. |
 |
 |
CONCLUSION |
| As Gyro Sensor is used to determine angular Velocity - (Angular Variation per second).When the gyro position tilts and angular velocity increases in a specific direction and when the rotationoccurs, the peak of the output pulse will shift. This propertyhas been used for the rotation measurement. However, the use of a small phase modulation depthwill results in the broadening of the output pulse. The simulation is carried out with LQR controller to validate the performance of the fiber optic gyroscope. The simulations were carried out with nominal parameters and with measurement noise. The simulation results show satisfactory response of the system. |
References |
|