International Journal of Advanced Research in Electrical, Electronics and Instrumentation Engineering
ISSN ONLINE(2278-8875) PRINT (2320-3765)
ISSN ONLINE(2278-8875) PRINT (2320-3765)
Anilesh Dey1, Sanjay Kumar Palit2, D. K. Bhattacharya3, D.N. Tibarewala4
|
| Related article at Pubmed, Scholar Google |
Visit for more related articles at International Journal of Advanced Research in Electrical, Electronics and Instrumentation Engineering

The present article establishes the significant difference between normal and on-music HRV data by applying the notion of Two Factor ANOVA. First of all, an attempt has been made to ascertain which of the seven available standard time domain measures of HRV data are significantly different and which are not so by the statistical test single factor ANOVA or its modified forms as and when necessary. It is found that in both of normal/pre-music and on-music states, all the measures show significant difference as a whole; the problem remains to identify exactly the measures, which cause the significant difference. This is done by applying Tukey’s multiple comparison test or by Newman-Keul’s test on pair wise means as and when required. This shows that there exists exactly one pair of measures, which are similar, but the rest five are significantly different in pre-music/normal state and two pairs of similar measures and the rest three are significantly different in on-music state. On comparing similar measures of normal and on-music states, it is found that there exists exactly one pair of similar measures common to both the states. Finally, the two factor ANOVA is applied, which successfully differentiates the aforesaid two states.
Keywords |
| HRV data, Bartlett test, modified ANOVA of Brown and Forsythe, Tukey’s multiple test, Newman- Keul’s test, Two factor ANOVA. |
INTRODUCTION |
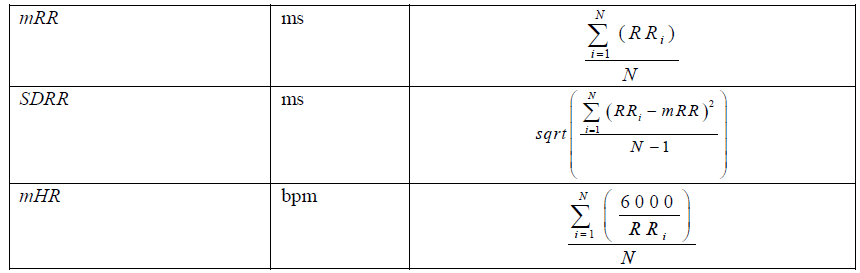
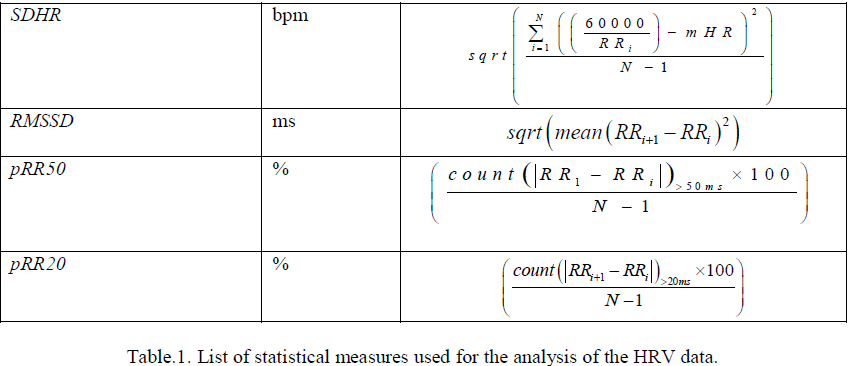
| During normal sinus rhythm, the heart rate (HR) varies from beat to beat. Heart rate variability (HRV) results from the dynamic interplay between the multiple physiological mechanisms that regulate the instantaneous HR. HRV is a useful signal for understanding the status of the autonomic nervous system (ANS)[1-4]. HRV refers to the variations in the beat intervals or correspondingly in the instantaneous heart rate (HR). The normal variability in HR is due to autonomic neural regulation of the heart and the circulatory system [5]. The balancing action of the sympathetic nervous system (SNS) and parasympathetic nervous system (PNS), the two branches of the autonomic nervous system (ANS) controls the HR [6-10]. Increased SNS or diminished PNS activity results in cardio-acceleration. Conversely, a low SNS activity or a high PNS activity causes cardio-deceleration[14-18]. The degree of variability in the HR provides information about the functioning of the nervous control on the HR and the heart’s ability to respond [11]. So far as the application of statistical methods are concern the following two works may be cited. Andriano L Roque et.al. [19] describes in their article ‘ The effects of auditory stimulation with music on heart rate variability in healthy women’.Standard statistical methods were used to calculate the means and standard deviations. The normal Gaussian distribution of the data was verified by the Shapiro-Wilk goodness-of-fit test (z value of >1.0). For parametric distributions, the one-way ANOVA was applied for repeated-measures followed by the Bonferroni post-test. For nonparametric distributions, the Friedman test was made and it was followed by Dunn's post-test. The authors compared the geometric indices of HRV between the three moments (Group 1, control condition vs. classical baroque vs. excitatory heavy metal; Group 2, control condition vs. classical baroque vs. excitatory heavy metal vs. white noise). The differences were considered significant when the probability of a Type I error was less than 5% (p<0.05). They used the Software Graph Pad Stat Mate version 2.00 for Windows (Graph Pad Software, San Diego, CA, USA).Bianca CR de Castro et al. in their article [20] establishes that ‘Previous exposure to musical auditory stimulation immediately influences the cardiac autonomic responses to the postural change maneuver in women’. Statistical tools and software’s used are the same as in [19]. In the first protocol they compared the indices: RMSSD, pNN50, LF [nu], HF [nu] and LF/HF). They compared the HRV indices between the four moments in the first protocol (seated rest vs. 0–5 min after the volunteers stood up vs. 5–10 min after the volunteers stood up vs. 10–15 min after the volunteers stood up). In relation to the second protocol for parametric distributions, they applied the ANOVA for repeated measures followed by the Bonferroni post-test (SDNN), for non-parametric distributions they used the Friedman test followed by the Dunn’s test on (RMSSD, pNN50, LF [nu], HF [nu] and LF/HF). They compared the HRV indices between the five moments in the second protocol (seated rest vs. 10 minutes musical auditory stimulation vs. 0–5 min after the volunteers stood up vs. 5–10 min after the volunteers stood up vs. 10–15 min after the volunteers stood up). Differences were considered significant when the probability of a Type I error was less than 5% (p < 0.05).There are many HRV measures that can be defined in the time domain. In this article, we consider only some promising measures [12]. These are mean RR interval (mRR), standard deviation of RR interval (SDRR), mean heart rate (mHR), standard deviation of heart rate (SDHR), root mean square successive difference (RMSSD), Number of pairs of adjacent RR intervals differing by more than 20 ms to all RR intervals (pRR20), and Number of pairs of adjacent RR intervals differing by more than 50 ms to all RR intervals (pRR50) [12]. Obviously it is necessary to check which of them are significantly different; otherwise unnecessarily some measures are included, which are not significantly different and as such do not give any new result. It is also necessary to see whether the measures differ in the HRV data of persons, when they listen to and do not listen to some suitably chosen music. Lastly it is to seen whether it is possible to differentiate between normal and on-music HRV data based on the significantly different measures only. In this article, an attempt has been made to answer all of the above questions by means of some well known statistical tests. |
MATERIALS AND METHODS |
A. ACQUISITION HRV DATA |
| The ECG signals in digitised form are recorded from different subjects (age between 20 to 30 years) by 'HRV data logger machine. All the signals are recorded at School of Bio-Science and Engineering, Jadavpur University, Kolkata, India under normal room temperature and least noisy environment. Recording is done in two stages. At the first stage ECG is taken at normal condition, when the subjects do not listen to music. In the second stage ECG signals are taken, when subjects do listen to Rabindra Sangeet of some special choice. All signals are taken in ten minutes duration. Finally, recorded signals are processed by MATLABR2010a software using moving window integration of a digital filter and converted into HRV signals. |
B. DIFFERENT TIME DOMAIN MEASURES OF HRV |
| The different time domain measures of HRV [12] used in this article are enlisted in the table.1. |
 |
 |
C. ANALYSIS OF VARIANCE (ANOVA) |
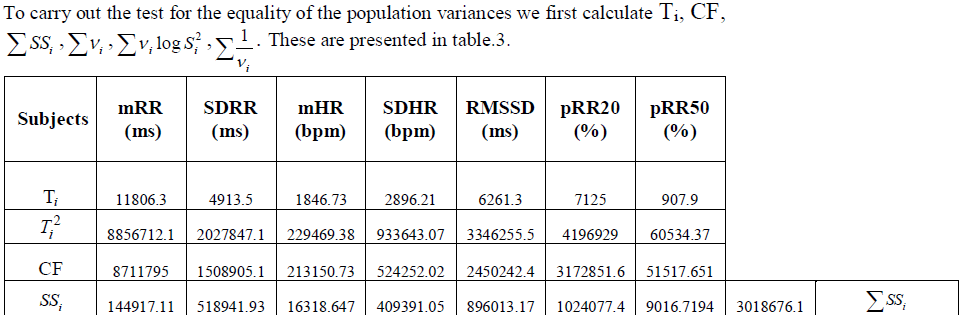
| As we deal with equality of population means of more than two samples, so student’s t- test is not workable. In fact, consideration of pair of samples at a time, involves increase in type1 error. So we opt for single factor ANOVA. The basic assumption for applying ANOVA is that the data must be normally distributed (which is usually assumed) and the secondary assumption is that the population variances are same under certain level of confidence, which is normally taken as 0.95. The secondary assumption is always to be verified by Bartlett’s test for homogeneity of variances [13]. |
D. TEST FOR EQUALITY OF VARIANCES (BARTLETT’S TEST) |
| Null hypothesis H0: Variances are homogeneous. |
| Alternative hypothesis HA: Variances are heterogeneous |
 |
 |
| If H0 holds for the population variance, then the single factor ANOVA is applied. Otherwise if HA holds, then one of the following two tests (section E and F) are applied: |
E. MULTIPLE WELCH’S TEST [13] |
| The test statistic is given by |
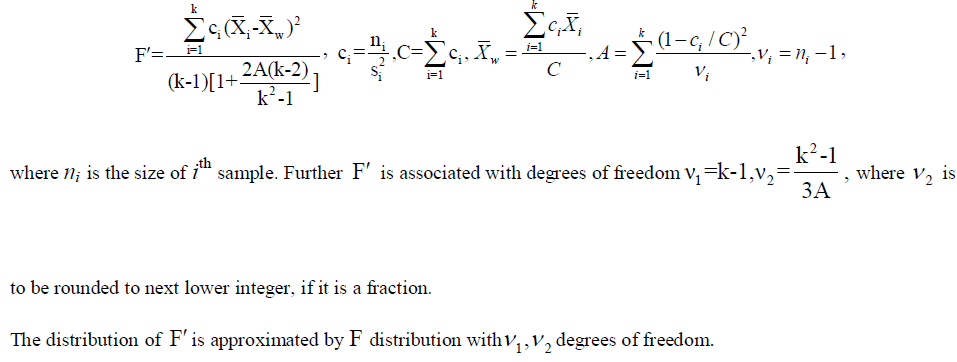 |
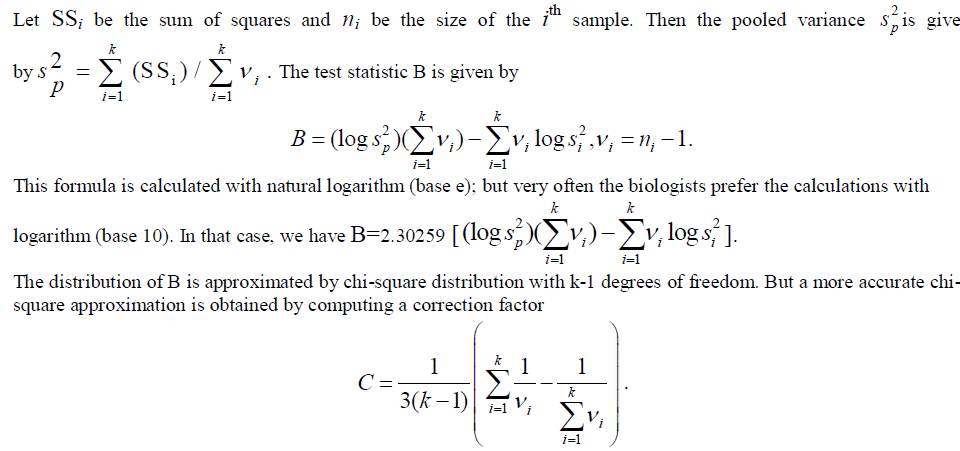
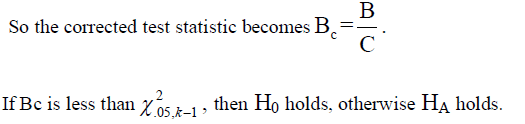
F. MODIFIED ANOVA OF BROWN AND FORSYTHE [13] |
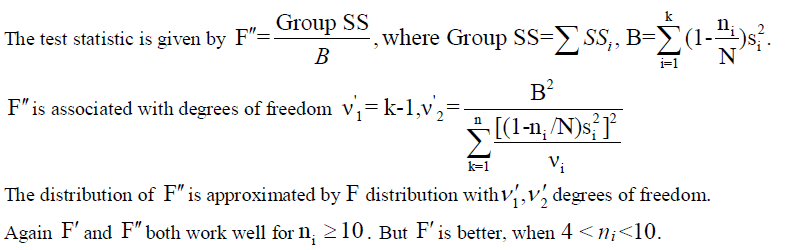 |
| If it is proved that there is no significant difference between the population means, then no more investigation is necessary. But if there is a significant difference, then the natural query is to find exactly those population means, which do differ significantly. This is done by Tukey’s multi-comparison test. |
G. TUKEY’S MULTI-COMPARISON TEST [13] |
It consists of the null hypothesis H0: μB= μA versus the alternate hypothesis HA: μB≠μA, where the subscripts denote all possible pairs of groups. For k group, k (k – 1)/2 different pair wise comparisons can be made. The sample means are ranked; pair wise differences between means are determined, and a standard error is computed. The test 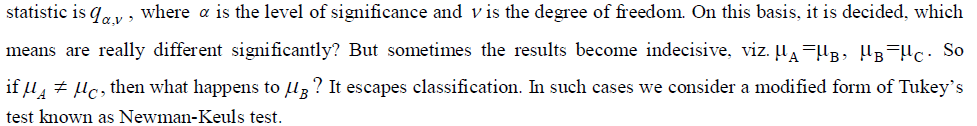 |
H. NEWMAN-KEULS TEST [13] |
 |
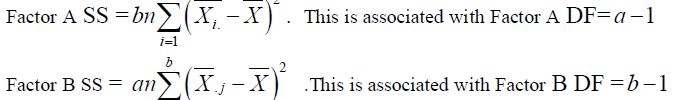 |
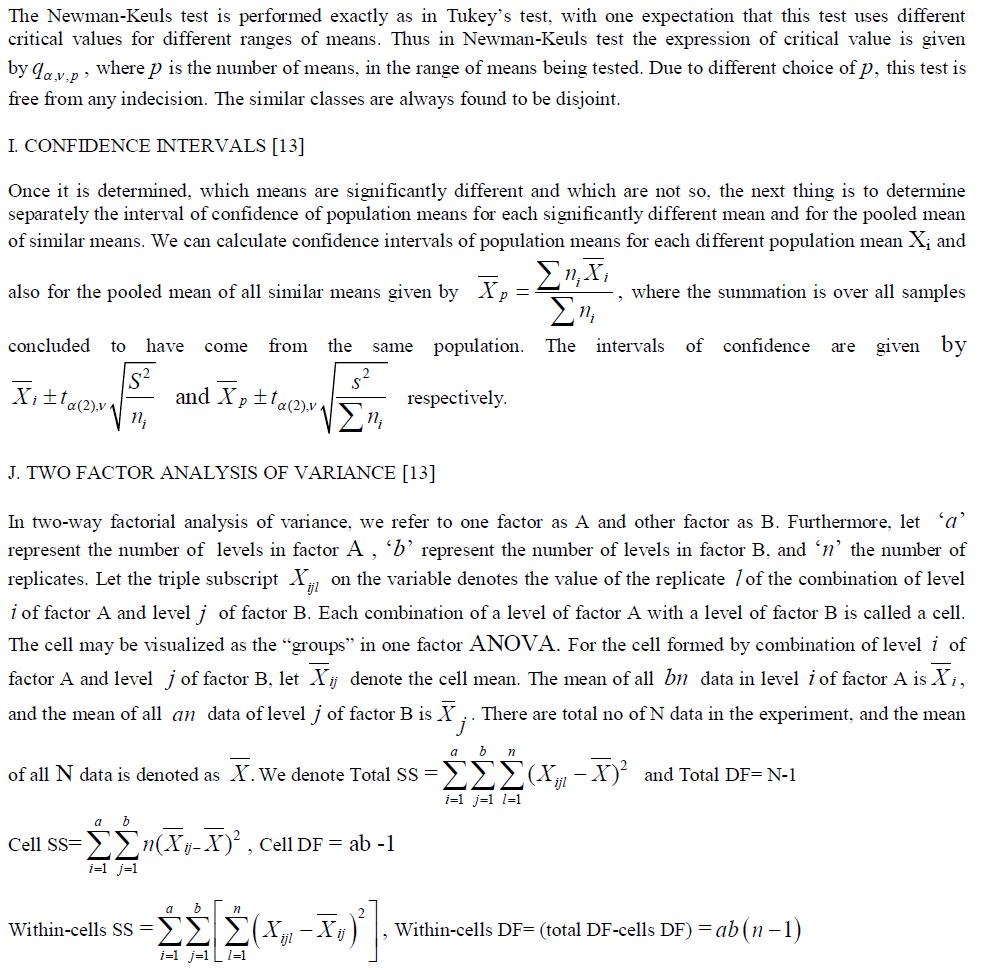
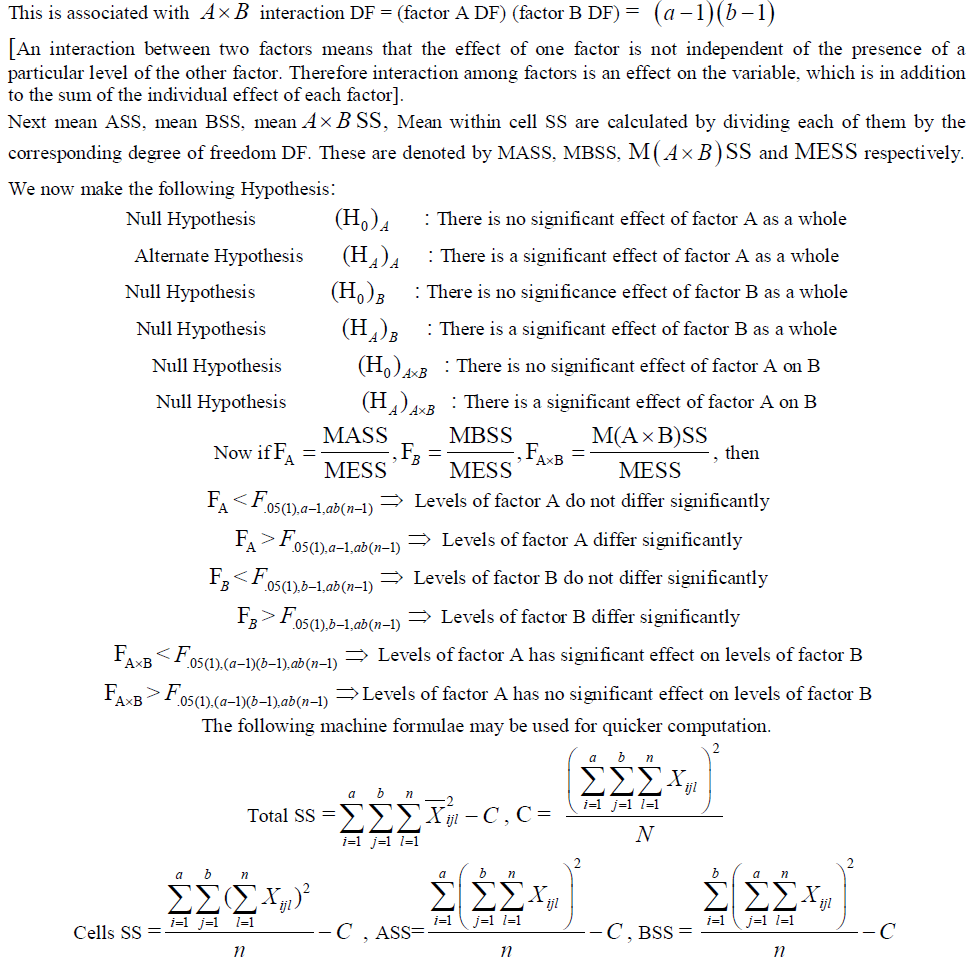
| In general the variability among cells is not equal to the variability among levels of factor A plus the variability among levels of factor B. The amount of variability not accounted for is that due to the effect of interaction between factors A and B. This is designed as the A B interaction and is readily calculated by difference. It is given by |
| AB Interaction SS = cells SS – factor A SS – factor B SS |
 |
RESULTS AND DISCUSSIONS |
A. NORMAL HRV DATA |
B. HRV DATA UNDER DIFFERENT STATISTICAL MEASURES |
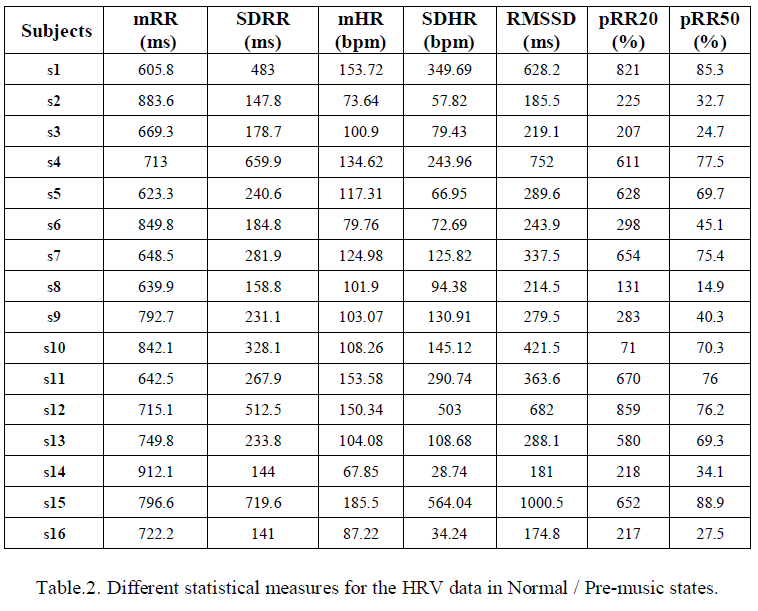
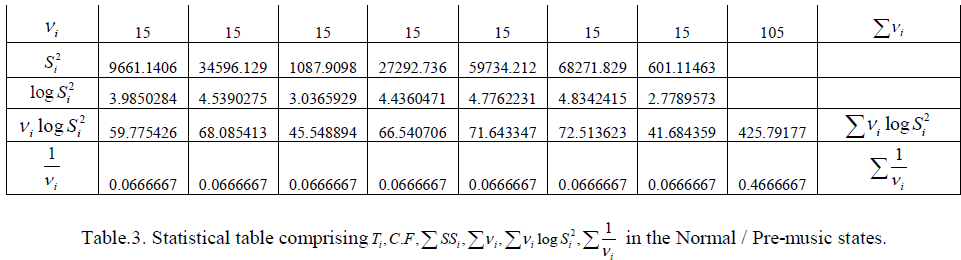
| The HRV data of the subjects (s1- s16) in normal state is recorded as discussed in section 2.1. The statistical measures as given in section 2.2 are then computed for all the above mentioned 16 subjects. The results are presented in table.2. |
 |
C. BARTLETT’S TEST |
 |
 |
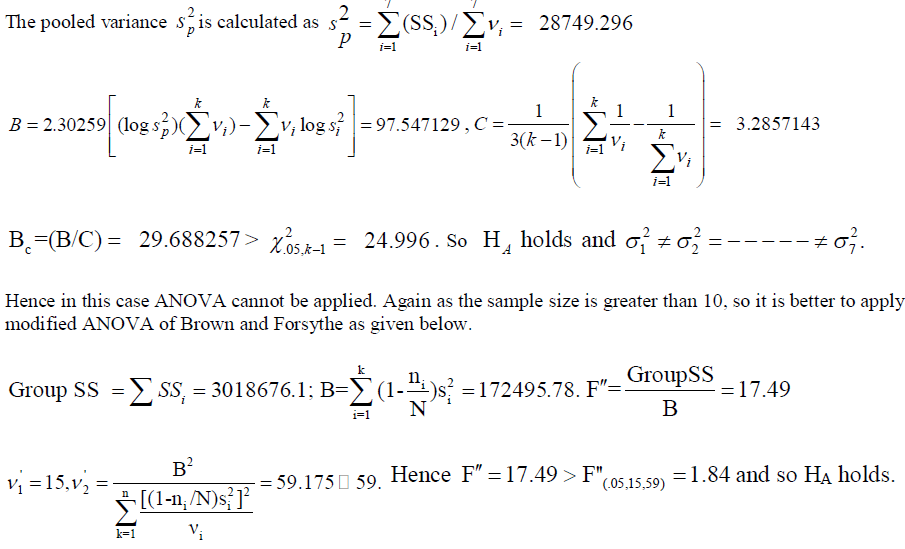 |
| Thus there is a significant difference between the different measures in the normal state. |
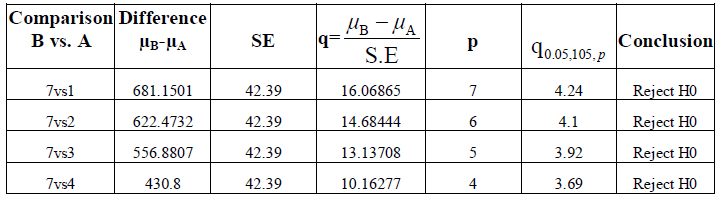
D.. TUKEY’S MULTI-COMPARISON TEST |
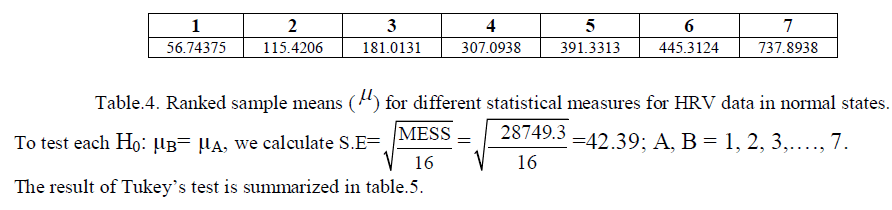
| We calculate Ranked Sample Means ( μ ), given by table.4. |
 |
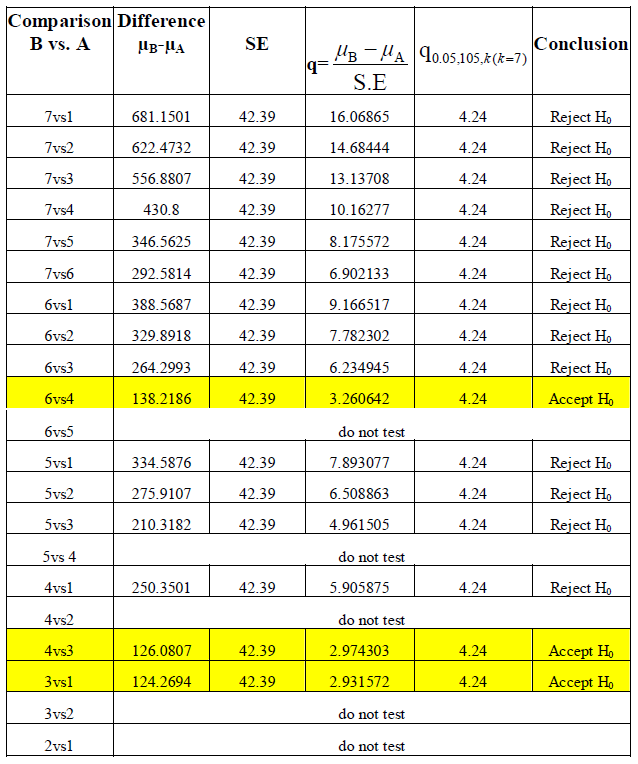 |
| Table.5. Results of Tukey’s Test for different statistical measures for the HRV data in normal states. |
 |
 |
 |
| Table.6. Results of Newman-Keul’s Test for different statistical measures for the HRV data in normal states. |
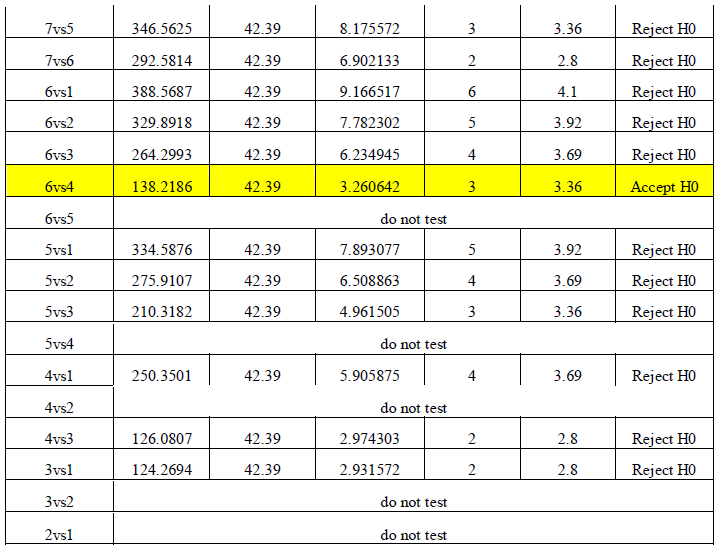
| From the table 6, we get μ6 =μ4 . So the measures corresponding to the mean value pRR20 and SDRR are similar. All other measures are significantly different in the normal state. To verify this argument, we now compute the confidence intervals of the population mean for each of the ranked sample means. These are presented in table.7. |
 |
 |
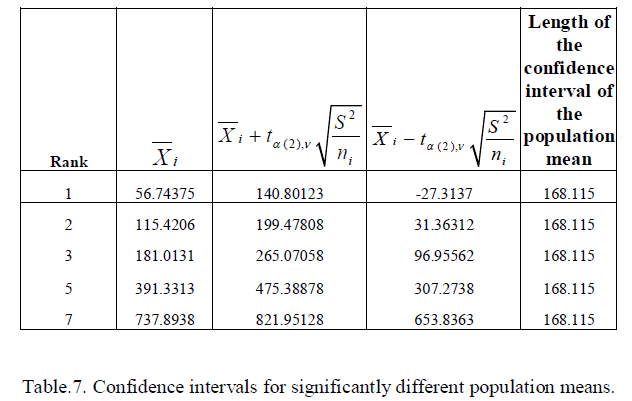
| It is evident from table 7 and 8 that the confidence interval is of minimum length for the common mean X 4,6 . 3.2 ON-MUSIC HRV DATA |
E. HRV DATA UNDER DIFFERENT STATISTICAL MEASURES |
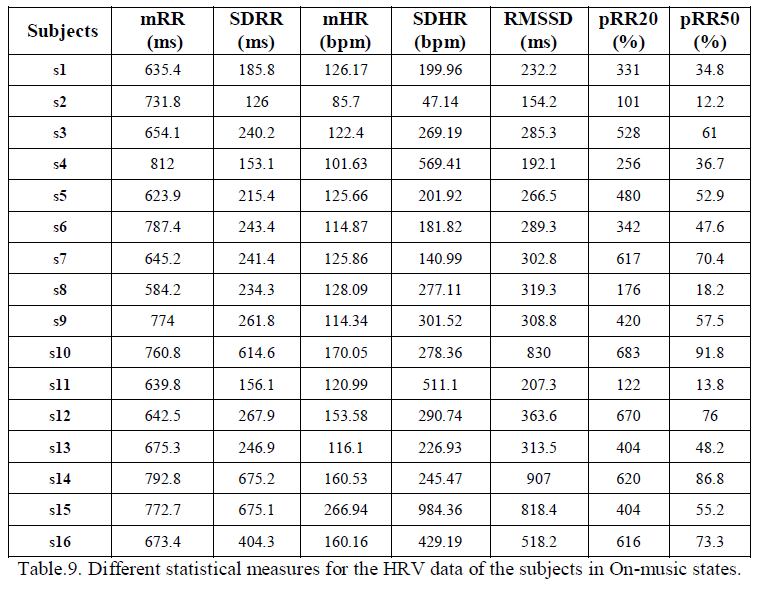
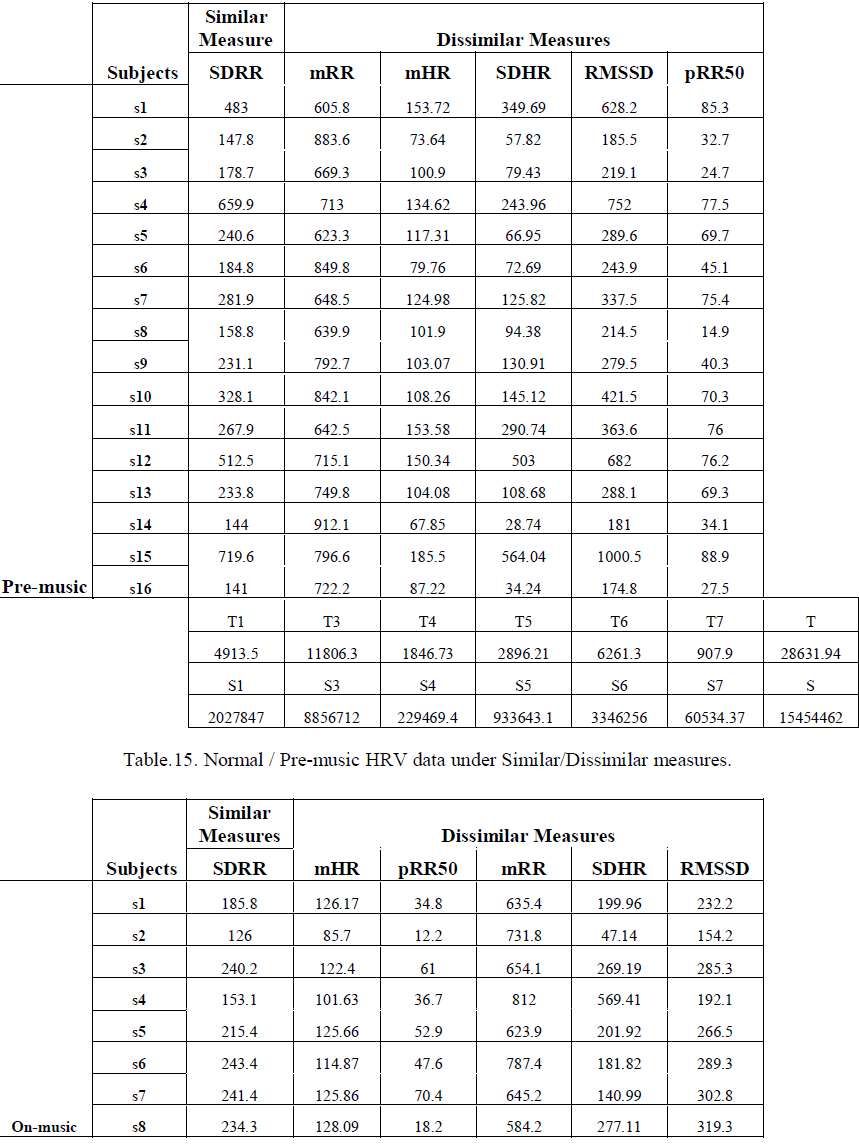
| The same seven statistical measures computed for the HRV data of the same 16 subjects (s1- s16), when they listen to some music of special choice is presented in table.9. |
 |
F. BARTLETT’S TEST |
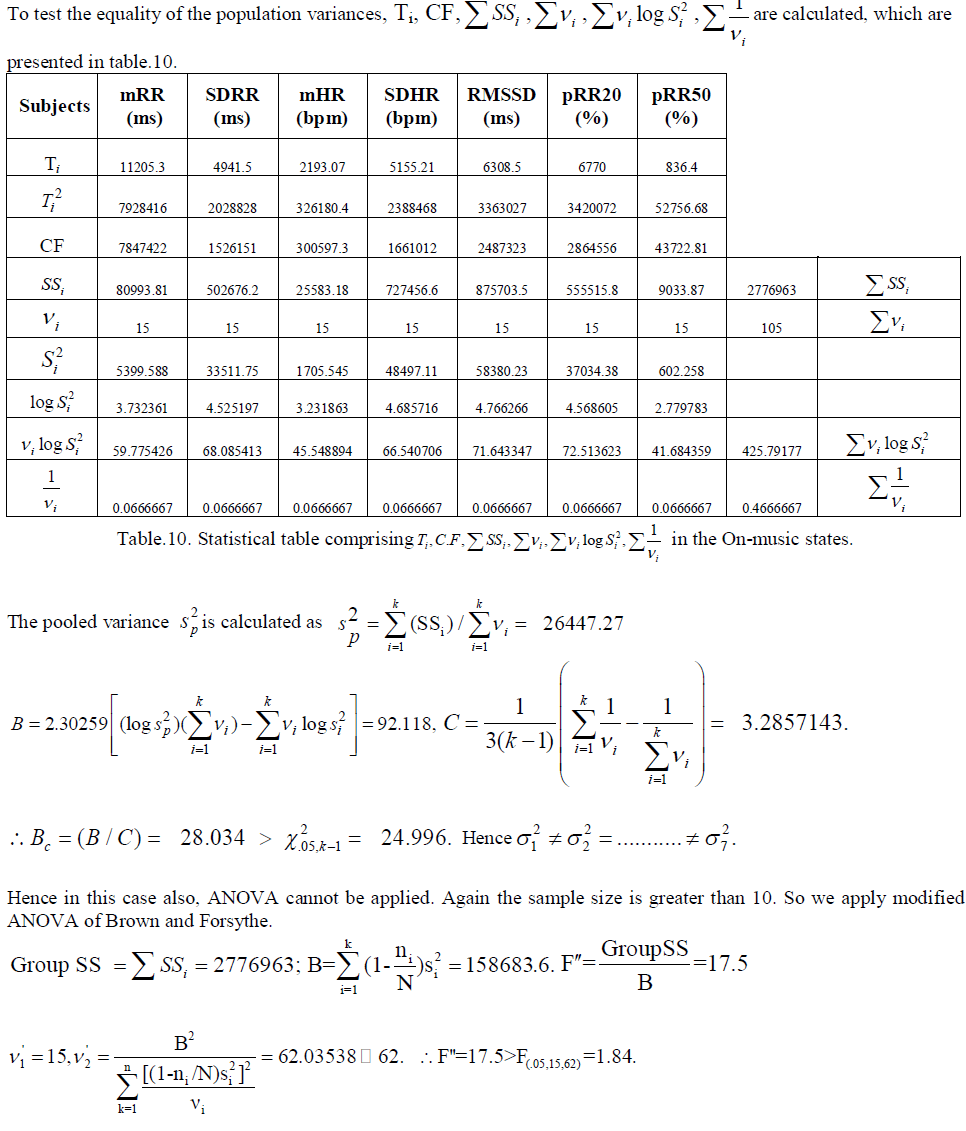 |
| So there is a significant difference between different measures of HRV in on-music state. |
G. TUKEY’S MULTIPLE COMPARISON TEST |
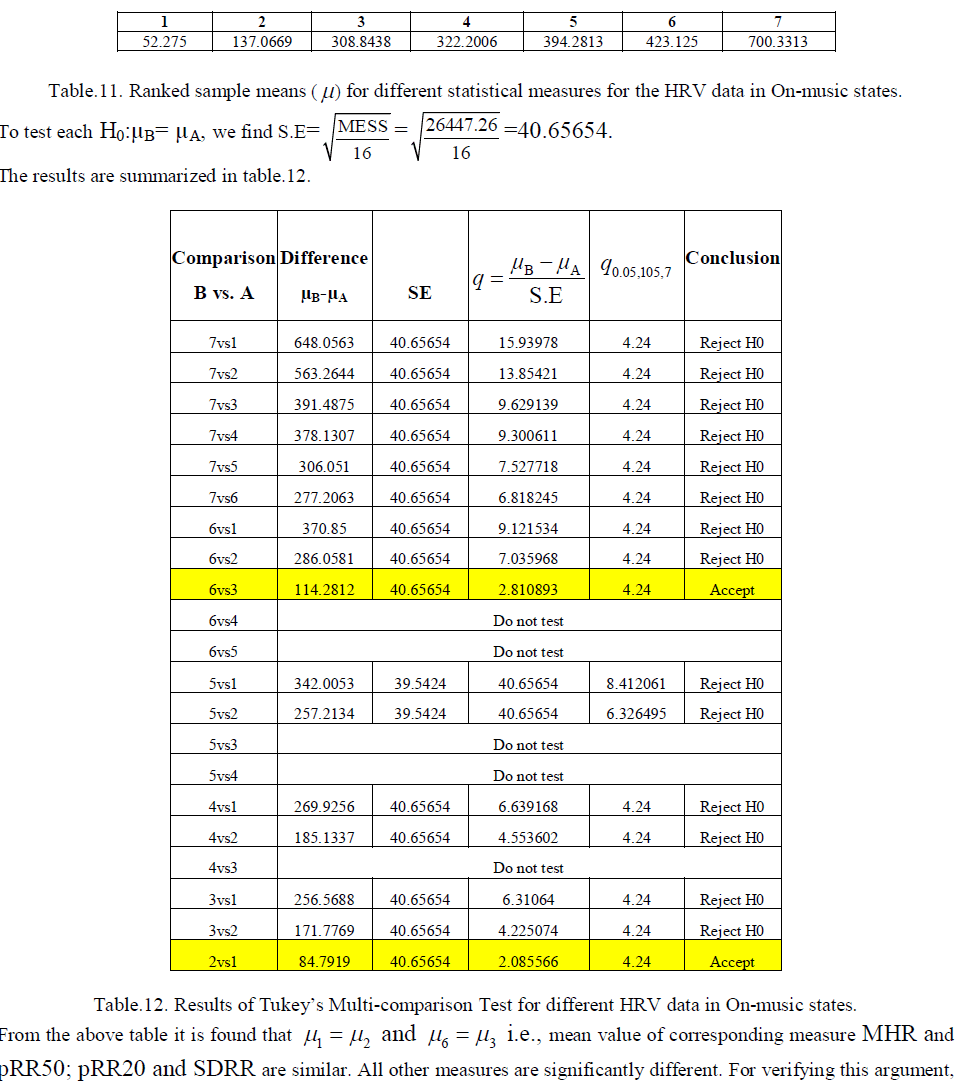
| The calculated Ranked Sample Means (μ ) are given by table.11. |
 |
| the confidence intervals for the population mean of significantly different measures and of similar measures in onmusic state are computed. These are given by table.13 and table.14 respectively. |
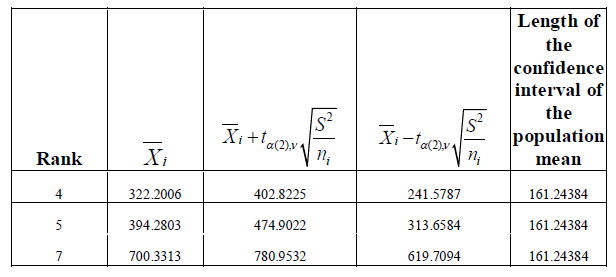 |
| Table.13.Confidence interval for population mean of significant different measures in on-music states. |
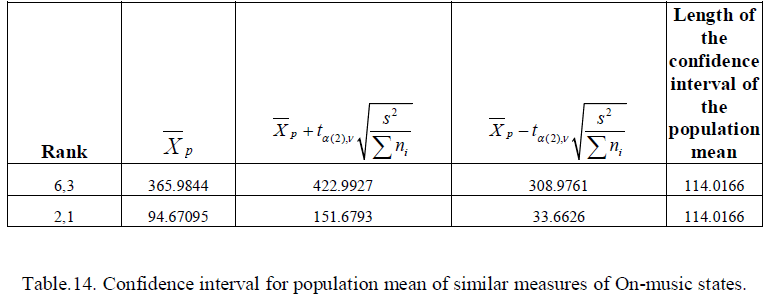 |
| From table 13 and 14, it is found that lengths of the intervals of confidence of the common population mean X 6,3 and X1,2 are same and they give the minimum length. In normal state the measures pRR20 and SDRR are similar and the rest are all significantly different. In on-music state there are two sets of similar measures. One is MHR and pRR50, and the other one is pRR20 and SDRR. The rest are significantly different. Finally it may be concluded that the common similar measures in normal and on-music state are pRR20 and SDRR only. The length of the confidence intervals of the corresponding population means also supports the above conclusions. We call these two as similar measures and consider SDRR from them as the similar measure for further analysis. The rest measures are taken as dissimilar measures. |
H. TWO FACTORS ANOVA |
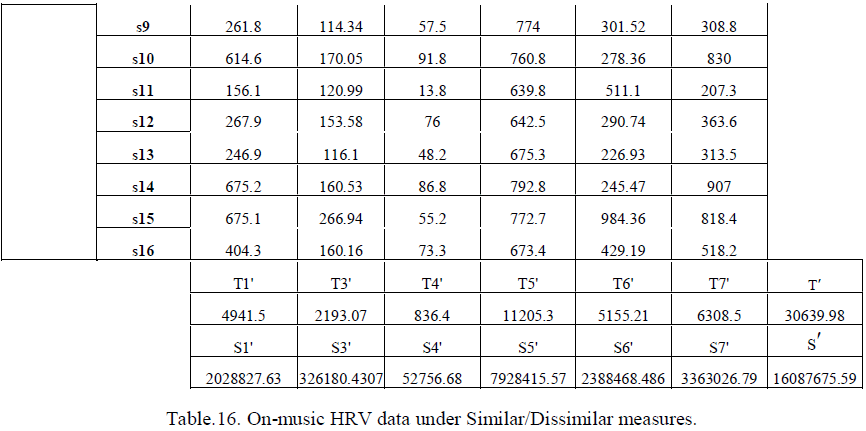
| To establish that the pre-music/normal and the on-music states differ significantly with respect to the aforesaid one similar and five dissimilar measures and also to cross verify the significant difference between the similar and dissimilar time-domain measures [already established in section 3.2], two factors ANOVA is performed. In this case the factors are denoted by A and B respectively, where the factor A has two components viz. similar measure and dissimilar measures and the factor B has two components viz. pre-music states, on-music states. The test is done at 0.95 confidence level. The similar and dissimilar measures and the related calculations for pre-music / normal states and onmusic states are given by table.15 and table.16 respectively. |
 |
 |
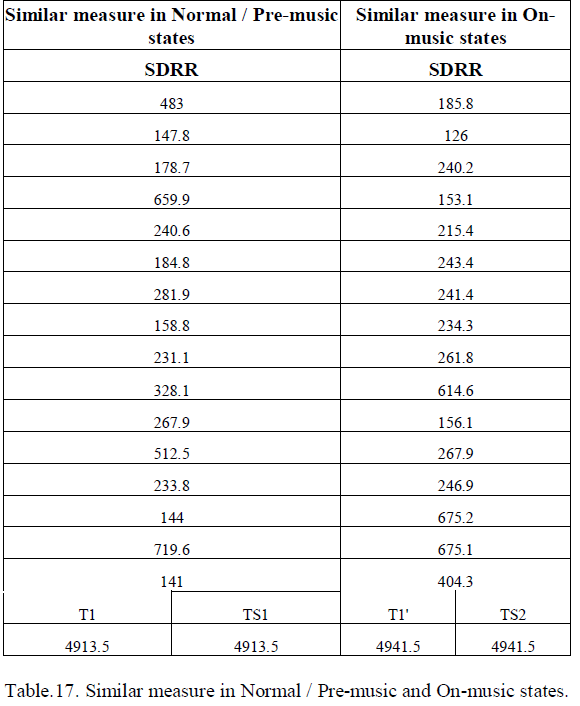
| The similar measure for pre-music and on-music states and the dissimilar measures for pre-music / normal state and onmusic states are summarized in table.17 and table.18a, 18b respectively. |
 |
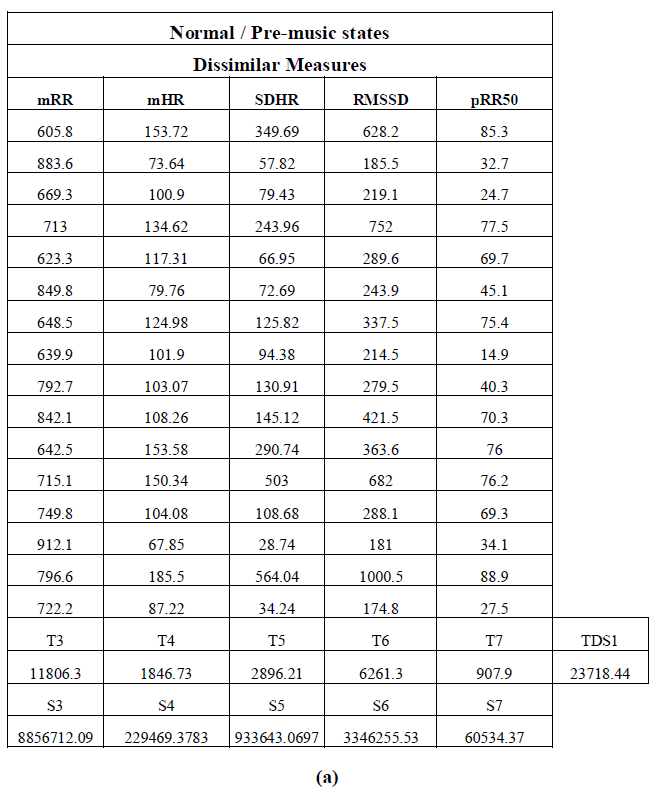 |
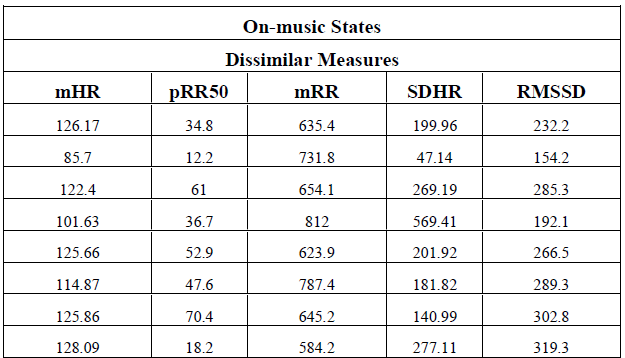 |
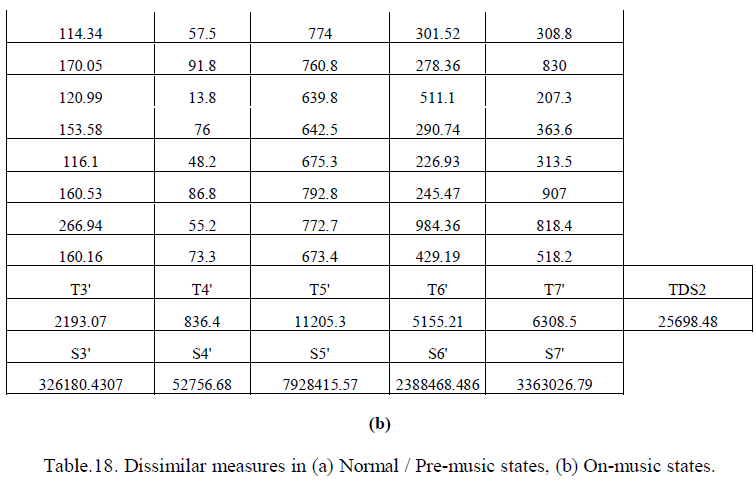 |
| Now, |
 |
CONCLUSIONS |
| In the present article, the effect of music on HRV has been studied through statistical analysis of different time domain measures [12] available for HRV. For this purpose, the analysis of normal/pre-music and on-music data is taken up sequentially. Firstly, the homogeneity of population variances is tested by Bartlett hypothesis test [13], which fails in both cases. So instead of ANOVA, modified ANOVA of Brown and Forsythe [13] is applied, which shows that all the measures are significantly different. Thus to find exactly the measures, which cause the significant difference, Tukey’s multiple comparison test [13] is applied for on-music data and Newman-Keul’s test, a modified form of Tukey’s test is applied for normal/pre-music data by which one similar measure and five dissimilar measures are identified. With these similar and dissimilar measures two factor ANOVA [13] is performed, which shows that there is a significant effect of music, in the sense that the measured values of HRV data in the normal/pre-music and on-music states do differ significantly. The main goal of this present study is to highlight the application of different statistical tests on bio-medical signals like HRV and at the same time to identify the relevant time domain measures in order to distinguish the pre-music/normal and on-music states. |
References |
|