ISSN ONLINE(2278-8875) PRINT (2320-3765)
ISSN ONLINE(2278-8875) PRINT (2320-3765)
Yogesh Patel1, Dixit Tandel2, Dharti Katti3
|
| Related article at Pubmed, Scholar Google |
Visit for more related articles at International Journal of Advanced Research in Electrical, Electronics and Instrumentation Engineering
The main objective of this thesis is to simulate and analyze the 220 KV Substation. The simulation and analysis includes power flow analysis and short circuit analysis. Power flow study also known as load flow constitutes an important part of power system analysis and design of any power system network. The power flow analysis and short circuit analysis is done in the Power World Simulator Software. For the power flow analysis using the single line diagram of 220 KV substation, the model of the substation is developed in the Power World Simulator. The different kinds of faults are also simulated at various buses of the substation. Power World Simulator is very useful software for analyzing power system operation. By doing the power flow analysis in the Power World Simulator we estimate the real and reactive power flows, power losses in the entire network and phase angle using Power World Simulator. Short circuit analysis is also useful to select, set, and coordinate protective equipment such as circuit breakers, fuses, relays, and instrument transformers. Simulation technique is very useful in the power system planning and design.
Keywords |
| Power World Simulator, Short Circuit Analysis. |
INTRODUCTION |
| The most of electrical power is generated by three main methods: hydro sources, coal fired stations and nuclear generating stations. Isolated power supplies are obtained from diesel engine driven generators, wind electric generators, solar panels and batteries. This power is generated normally at 11 KV and is stepped up to high voltages for transmission. The load centres are usually located away from generating stations. Therefore, the power is transmitted to the load centres and is stepped down to distribution level. The load is supplied at various voltage levels. The load may be residential, industrial or commercial. Depending on the requirement the loads are switched on and off. Therefore, there are peak load hours and off peak load hours. When there is a need, power is transmitted from one area to the other area through the tie lines. The control of generation, transmission, distribution and area exchange are performed from a centralized location. In order to perform the control functions satisfactorily, the steady state power flow must be known. Therefore, the entire system is modelled as electric networks and a solution is simulated using a digital program. Such a problem solution practice is called power flow analysis.The power flow solution is used to evaluate the bus voltage, branch current, real power flow, reactive power flow for the specified generation and load conditions. The results are used to evaluate the line or transformer loading and the acceptability of bus voltages. In general the power flow solutions are needed for the system under the following conditions: |
| • Various systems loading conditions (peak and off peak). |
| • With certain equipment outage. |
| • Addition of new generators. |
| • Addition of new transmission lines or cables. |
| • Interconnection with other systems. |
| • Load growth studies. |
| • Loss of line evaluation. |
| Successful power system operation under normal balanced three-phase steady-state conditions requires: |
| Generation |
| 2. Bus voltage magnitudes remain close to rated values. |
| 3. Generators operate within rated real and reactive power limits. |
| 4. Transformers and transmission lines and are not overloaded. |
| The power-flow computer program (sometimes called load flow) is the basic tool for investigating these requirements. This program computes the voltage magnitude and angle at each bus in a power system under balanced three-phase steady-state conditions. It also computes real and reactive power flows for all equipment interconnecting the buses, as well as equipment losses2. |
| In order to solve for the power flow solutions, it is necessary to model all the networks, generators, transformers and shunt capacitors. The approach to the modelling and the analysis of large-scale power flow solutions are presented in this thesis. |
| Reference [1] discusses the use of contours for visualizing power system voltage data. Also, because of the low computation requirements of the contouring algorithm, the algorithm is implemented into a real-time animation of the voltage profile of a power system. The contouring routines are implemented into the Power World Simulator software package, with results shown for systems with up to several thousand buses. Experiments and interviews with system engineers are also discussed to measure the applicability of voltage contouring as an add-on to practical Energy Management Systems.Reference [2] considered the 330kV Nigeria power grid for estimating the real and reactive power flows, power losses in the entire network and bus phase angles using Power World Simulator. The simulation result of the existing 330kV power grid indicates that Damaturu and Gombe bus voltages were out of tolerance with per unit and actual values of 0.94432, 311.63kV and 0.94497, 311.84kV respectively. Substantial losses occurred along some transmission lines like Osogbo-Aiyede (18.78MW), Osogbo-Ikeja-West (6.28 MW), Jos-Mando (5.49MW) and Osogbo-Benin (5.20MW). The power loss of existing grid totalled 85.3MW, while the expanded and fortified grid showed power losses of 32MW and 24.7MW respectively.In reference [3] an attempt has been made to investigate power flow in the northern Nigeria330kVtransmission sub – grid using Power World software. The 13 – bus sub – grid was developed on base values of 100MVA and 330kV (transmission line) using data obtained from the National Control Center, Osogbo, Nigeria. The data is valid through 31st December, 2010. The power flow was run using Gauss – Siedel power flow algorithm and low voltage violations were found at buses 1, 7, 8, 9, 10, and 13. To minimize these voltage violations, shunt capacitor compensators were placed at affected buses, resulting in a network with a minimum bus voltage of 0.95 p.u. The voltage control also resulted in reduced reactive MVar demand on two of the three generators, with the slack bus experiencing a decrease of 60.27 MVar. The results also indicated that incorporation of compensators yielded a reduction in 8.76 MW and 96.51 MVar line power losses. |
II.POWER FLOW ANALYSIS |
| A power system network usually consists of component such as buses, transmission lines, generators and loads. These are principle components of a power network; other components such as compensator are usually included only to improve the network after load flow studies. Figure 2.1 gives an example on a simple two bus power network modelled for load flow analysis. |
 |
| Bus represents reference node during calculation or simply nodes that are used in nodal analysis. In load flow studies, there are three types of bus, slack bus, generator bus and load bus. To begin with load flow study, one must identify or assign one slack bus. Another type of bus in a power network is the generator bus. Generator bus is defined as any bus excluding the slack bus with a generator connected to it. As for a load bus, it is simply any bus that has only loads connected. |
| In a power system, generators are referred to as devices which convert mechanical energy into electrical energy or in layman’s terms, anything that produces power. For a steady state load flow study, parameters that generators are represented as are fixed power and desired voltage magnitude. |
| A load in a power system context is defined as devices that consume power in the network. There are three types of loads in power system. They are purely resistive load, purely reactive load and load that consume both type of power. In a steady state load flow study, loads are specified as fixed real and reactive power. |
Transmission lines are power lines that connect buses. The key parameters of transmission lines are resistance R, and reactance X. In load flow analysis, parameters of transmission lines are simply represented as the impedance, Z=R+jX, or as the admittance,  |
| In a power flow network, buses are bound to have self- or mutual admittance, and this increase the complexity to determine the admittance of the bus. However, it is easy to model the admittance of the network into a matrix for any analysis, where the diagonal elements are self-admittance and off-diagonal elements are mutual admittance. Equation-1 shows an example of an admittance matrix. |
 |
| The five parameters which are used for load flow analysis are voltage magnitude, voltage angle, real power, reactive power and admittance. The basic formula to solve all load flow problems is represented by Equation 2 and Equation-3, |
 |
| The Load flow solution is also known as power flow solution. The load flow solution of an electrical power system provides voltages at all the buses, power flows and losses in the lines at specific levels of power generation and loads. The results of load flow analysis are used in load forecasting, system planning and operation. In practical field, system engineers carryout load flows on a daily basis with varying system configurations, load patterns and generating conditions to understand the behaviour of the system at different operating conditions. Therefore, computation of a load flow solution is a basic requirement and at present there are many tools and software available. |
| There are four bus types in a power transmission network. These are generator buses, load buses, swing buses, and disconnected buses. |
| Methods for solving load flow analysis are: |
| a. Gauss – Seidel method |
| b. Newton-Raphson method |
| c. Fast decoupled method |
| d. DC load flow method |
III.POWER WORLD SIMULATOR |
| Power World Simulator is a power system simulation package designed from the ground up to be user friendly and highly interactive. Simulator has the power for serious engineering analysis, but it is also so interactive and graphical that it can be used to explain power system operations to non-technical audiences. |
| Simulator is actually a number of integrated products. At its core is a comprehensive, robust Power Flow Solution engine capable of efficiently solving systems of up to 60,000 buses. This makes Simulator quite useful as a standalone power flow analysis package. Unlike other commercially available power flow packages, however, Simulator allows the user to visualize the system through the use of full-colour animated oneline diagrams with full zooming and panning capability. Moreover, system models may be modified on the fly or even built from scratch using Simulator’s full-featured graphical case editor. Transmission lines may be switched in or out of service, new transmission or generation may be added, and new transactions may be established, all with a few mouse clicks. Simulator’s extensive use of graphics and animation greatly increases the user’s understanding of system characteristics,problems, and constraints, as well as of how to remedy them. |
| Simulator also provides a convenient medium for simulating the evolution of the power system over time. Load, generation, and interchange schedule variations over time may be prescribed, and the resulting changes in power system conditions may be visualized. This functionality may be useful, for example, in illustrating the many issues associated with industry restructuring. |
| In addition to these features, Simulator boasts integrated economic dispatch, area transaction economic analysis, power transfer distribution factor (PTDF) computation, short circuit analysis and contingency analysis, all accessible through a consistent and colourful visual interface. These features are so well integrated that you will be up and running within minutes of installation. |
| Simulator also offers five optional product add-ons to meet your needs. |
| ïÃâ÷ Optimal Power Flow (OPF) |
| ïÃâ÷ Available Transfer Capability (ATC) |
| ïÃâ÷ Power-Voltage Reactive Power-Voltage Tool (PVQV) |
| ïÃâ÷ Automation Server (SimAuto) |
| ïÃâ÷ Security Constrained Optimal Power Flow (SCOPF) |
IV.SIMULATION DIAGRAM |
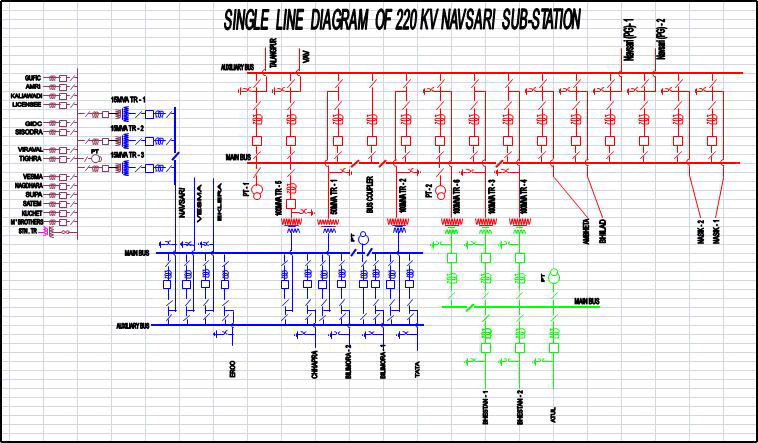
| Figure shows the single line diagram of 220 KV Navsari substation. The red line indicates the 220 KV bus section. There is a one 220 KV main bus. At this 220 KV bus eight 220 KV lines are connected. The eight lines are Talanpur (sachin), Vav, Kawas-1, Kawas-2, Nasik-1, Nasik-2, Ambheta and Bhilad. All this lines are export and import power to the substation. Now, this 220 KV bus step downs voltage at 66 KV and 132 KV for the transmission of power by using step down transformer. The three 220/132 transformers step down the voltage at 132 KV and connect to 132 KV bus. The transformers used are transformer number 3, 4, 6. Each has 100 MVA rating. The green line indicates the 132 KV bus section. This 132 KV bus transmits power through Bhestan-1, Bhestan-2 and Atul line to Bhestan and Atul Substation. The three 220/66 KV transformers step down the voltage at 66 KV and connect it to 66 KV bus. The transformers used are transformer number 1, 2, 5. The transformer number 1 has 50 MVA rating and the transformer number 2, 5 has 100 MVA rating. The blue line indicates the 66 KV bus section. The 66 KV bus transmits power through the transmission lines to different 66 KV substations are Tata, Bilimora, Gandevi, Chapara, Eroo, Vesma, Eklara and Navsari. The 66 KV Navsari bus is further step down the voltage at 11 KV by using the three 66/11 KV transformer. Each transformer has 15 MVA rating. The 11 KV bus feed the power to different 11 KV feeders. |
 |
V. RESULT AND DISCUSSION |
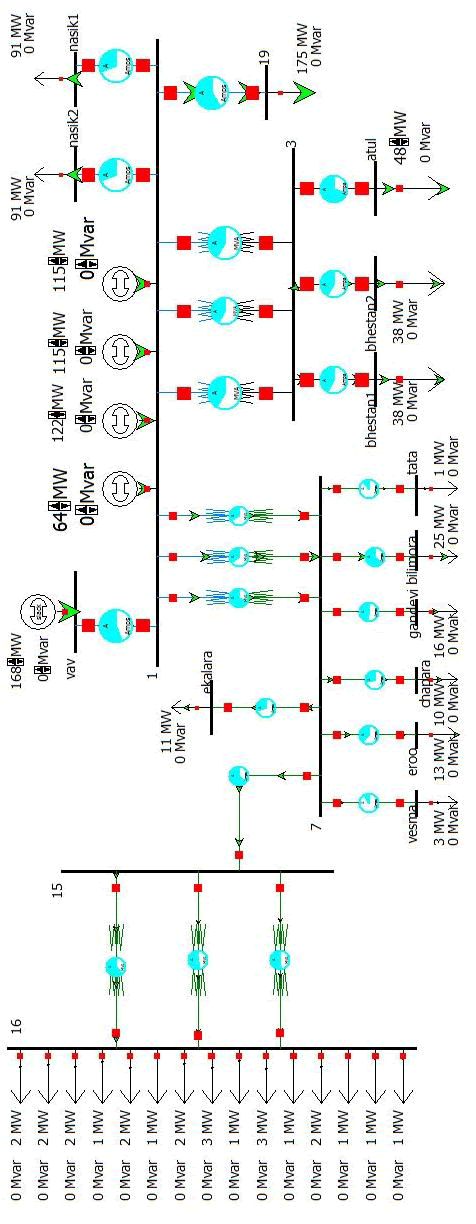
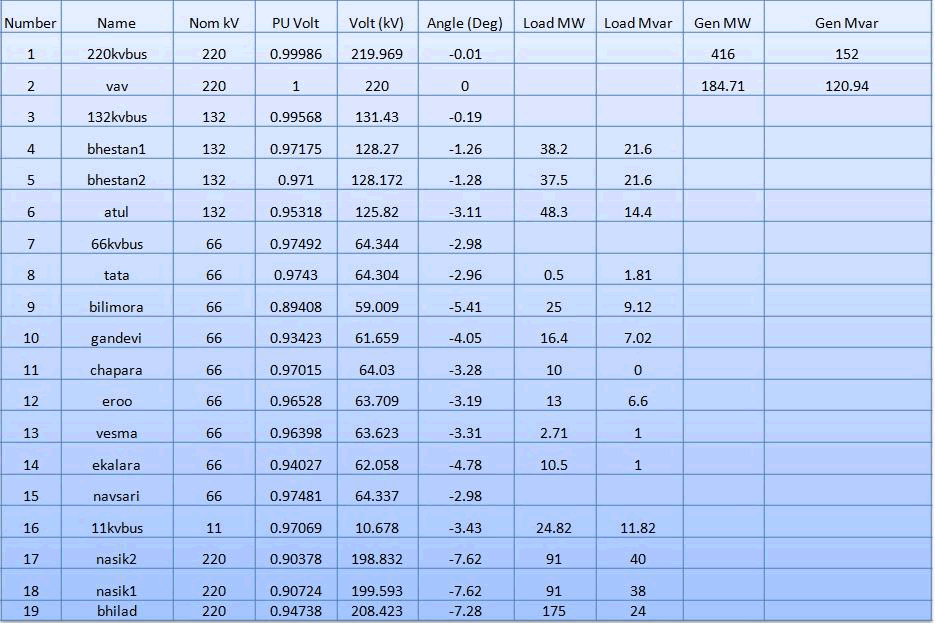
| A Newton-Raphson load flow analysis was performed on the power system described in Figure. The animated results of this load flow are shown in Figure. |
 |
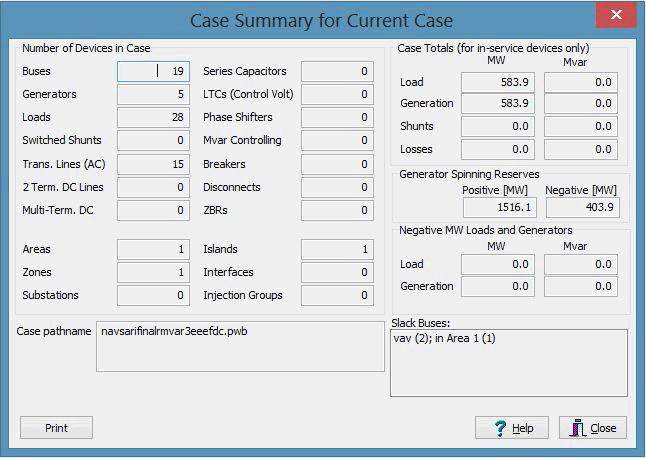
| Generator 1 was set up to be the slack generator (i.e. 1 PU output voltage at 0 ° phase angle). The connected load was 25 MW and 10 MVAR (inductive).The resulting power flows for each transmission line feeding the connected load are also displayed.The resulting bus voltages and phase angles are shown on the one-line diagram. |
 |
| The pie charts associated with each transmission line, provide the student with an indication of transmission line loading. For this example, the resistance of each transmission line was not included, only the reactive component. The power flows (real and imaginary) for this example are in the same direction. |
 |
VI.CONCLUSION |
| It is very necessary to carry out power flow analysis for satisfactory operation of the power system. This analysis is done effectively using PowerWorld simulator software. By using the PowerWorld simulator we also analyse the effect of adding or removal of transmission line and other power system component. The PowerWorld simulator also gives information for what amount of power the system works with maximum efficiency. The PowerWorld simulator is a user friendly tool that provides visual simulation results. |
References |
|