ISSN ONLINE(2278-8875) PRINT (2320-3765)
ISSN ONLINE(2278-8875) PRINT (2320-3765)
Manish N. Sinha1, Dr.B.R.Parekh2
|
| Related article at Pubmed, Scholar Google |
Visit for more related articles at International Journal of Advanced Research in Electrical, Electronics and Instrumentation Engineering
The “Power Quality” term is widely used in recent years in power system field. Voltage sags is one of the power quality issue, which is also known as dips, are important to industrial reliability. This paper presents a power world simulation approach to find the voltage sag magnitudes in power system network. In this paper, investigations have been conducted on a sample distribution system model taking into consideration with the practical operation of a power system.
Keywords |
| Equipment Sensitivity,Fault Analysis, Power quality, Voltage sags |
INTRODUCTION |
| The term power quality refers to a wide variety of electromagnetic phenomena that characterize the voltage and current at a given time and at a given location on the power system. Electric energy is one of the most important production factors in modern manufacturing industry. It is also an important commodity for the power utility industry. For both parties, the quality of electric power is becoming increasingly important. High Power Quality means a high rate of efficiency in the networks with a low level of electrical disturbances [1]. |
| 1. Voltage sag (or dip): |
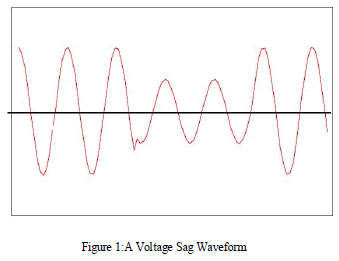
| Description: A decrease of the normal voltage level between 10 and 90% of the nominal rms voltage at the power frequency, for durations of 0,5 cycle to 1 minute. Figure 1shows the typical voltage sag waveform. |
 |
| Causes: Faults on the transmission or distribution network (most of the times on parallel feeders). Faults in consumer’s installation. Connection of heavy loads and start-up of large motors [1]-[2]. |
POWER WORLD SIMULATOR |
| Power World simulator is a power system analysis and simulation software package. It has got the ability to animate the various power systems in part as well as a whole interconnected system. It is a highly interactive package which can be used in study of power flow, load distribution, short circuit study, line lodability, power factor improvement, voltage profile improvement, economic dispatch, etc. The graphical interface given by the computer is quite noteworthy. The simulator’s extensive use of graphics and animation greatly increases the user’s understanding of system characteristics, problems, and constraints, as well as of how to find solution for them. The Power World simulator can be used to simulate high voltage, high power interconnected AC systems. Since during normal operation, the 3-phase AC system is balanced, the system can be satisfactorily and accurately modelled as an equivalent single-phase system. PW simulator uses this approach and hence connections between devices are shown with single line. Various graphical symbols are adopted to represent real power world components such as thick lines are used to represent buses, magnitude and direction of power flow is shown by size and speed of arrow .With Version 14 educational Simulator version software easier to use, yet even more powerful and more visual [3]. |
SENSITIVITY OF EQUIPMENT TO VOLTAGE SAGS |
| The magnitude and duration of voltage sag that could disrupt electronic equipment vary from device to device. The following is a summary for some typical equipment. |
| 1.Extreme sags may cause the motor to lose enough rotational inertia to affect its performance or task. If sags happen frequently enough, the motor may draw high inrush currents often enough to trip a breaker. Motor capacitor coils will generally drop out for voltages in the range of 50% to 75% for duration of 1-5 cycles. |
| 2.PLCs that are used to control equipment such as AC and DC drives may shut down the devices for voltages on the order of 80% to 85% of nominal. The remote I/O units, for instance, have been found to trip for voltages as high as 95% for a few cycles. |
| 3.In an industrial plant, high-intensity discharge lightings are often the most sensitive equipment to low voltages. The lamps will typically extinguish for voltages in the range of 85% to 90% of nominal for periods of time as short as 1 cycle and will take several minutes to restart. |
BASIC VOLTAGE SAG ANALYSIS |
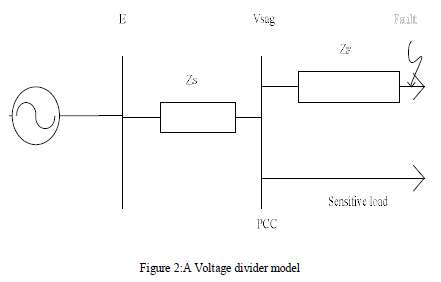
| In the literature analysis about the voltage sag event in a power system has been presented in many research papers. As to understand the voltage sag event and analysis of voltage sag in a power system [1]-[9] will be useful. The response of the system to faults can be calculated analytically using symmetrical components or running detailed simulations. In [1] ,simplified expressions based on the voltage divider model have been proposed for fast assessment of the critical distances and the number of sags.The calculation of magnitude and phase-angle jump of voltage sag at sensitive load buses is the basic requirement for voltage sag assessment. The proposed voltage divider model shown in Figure 2 is used [1]. |
| Voltage at PCC |
| Vsag=E*ZF/(ZS+ZF) (1) |
| Where E=1 p.u. and ZF=fault impedance up to PCC and Zs= Source impedance. |
 |
| Fault studies form an important part of power system analysis. Faults on power systems are divided into two components which are balanced faults and unbalanced faults. There are different types of unbalanced faults which are single line-to-ground fault, line-to-line fault, and double line-to-ground fault. |
| Short circuit faults, especially single Line to ground Faults, are one of the main sources of voltage sags. Short-circuited fault analysis is mainly used to provide data for system design, protective relay coordination, equipment selection, etc. by obtaining the fault currents. In the meantime, short circuit calculation combined with reliability data can also be used to predicate number of voltage sags and their level of severity [4]-[9]. |
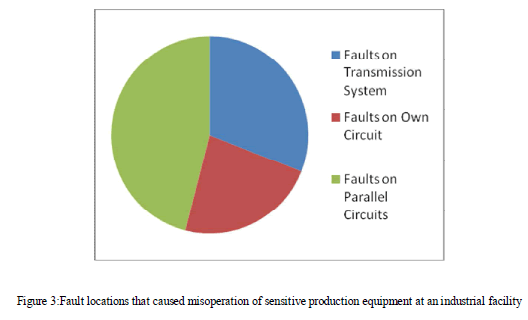
| Figure 3 shows an example of the breakdown of the events that caused equipment misoperation for one industrial customer. Note that faults on the customer feeder only accounted for 23 percent of the events that resulted in equipment misoperation. This illustrates the importance of understanding the voltage sag performance of the system and the equipment sensitivity to these events [2]. |
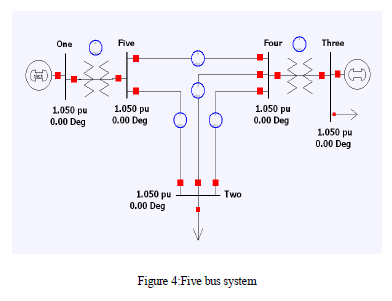
| Five bus system(Figure 4) is developed for study of voltage sag in a various buses when fault is occur on various buses. Three buses namely two, four and five are selected and single line to ground fault is created on it [3]. |
 |
 |
RESULTS AND DISCUSSION |
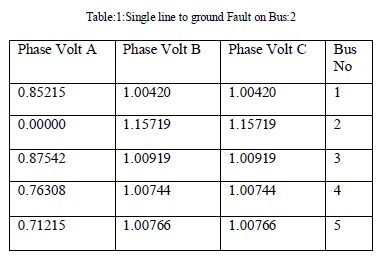
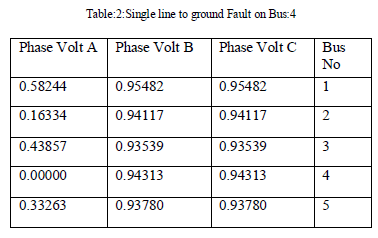
| The results are simulated and prepared in tabulated forms which are shown in table number 1 to 3. |
 |
 |
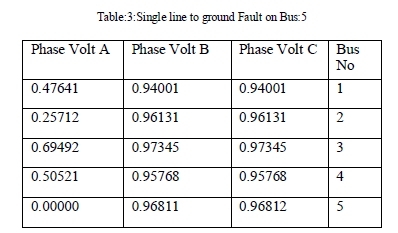 |
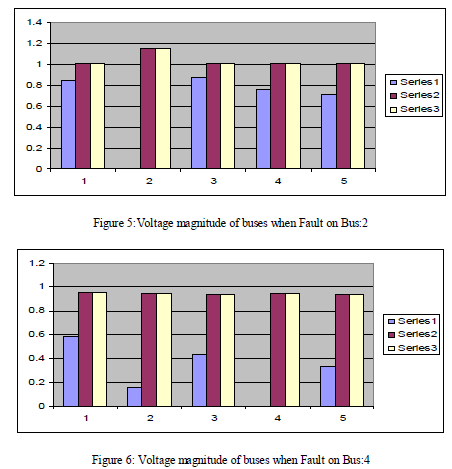
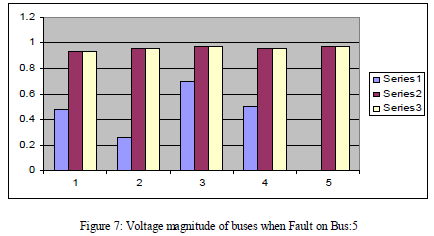
| The results show that whenever the fault is occurring in a power system the buses are experiences a voltage rise or fall depending on the parameters. When a SLG fault on bus two, voltages on 1,3,4,5 buses experience a momentary voltage sag (Figure 5).For the same developed model, when a SLG fault on bus four, voltages on 1,2,3,5 buses experience a momentary voltage sag. From the result it is clear that few buses voltage are below the desired value but others are almost in specified range (Figure 6).When a SLG fault on bus five, voltages on 1,2,3,4 buses experience a momentary voltage sag. From the result few buses voltage are below the desired value but others are almost in specified range (Figure 7). |
 |
 |
CONCLUSION |
| This paper has presented the procedure for the prediction of voltage sags in a power system networks. The simple power system is studied for voltage sag at a sensitive node where critical loads are connected. The voltage sag magnitude depends on the type of fault as well as fault distance. The simulation has carried out using PWS software. The fault calculation results are almost matched with the simulation results. |
References |
|