Research & Reviews: Journal of Pharmaceutical Analysis
e-ISSN: 2320-0812
e-ISSN: 2320-0812
Taruvaran1, Shambhavi1, Neeladri Srinivasulu1, Y Anand Kumar2*, Keerthana Shetty1, Madhusri C1
1 Department of Pharmaceutical Chemistry, V.L. College of Pharmacy, Raichur, Karnataka, India
2 Department of Pharmaceutics, V.L. College of Pharmacy, Raichur, Karnataka, India
Received: 19-Nov-2024, Manuscript No. JPA-24-152895; Editor assigned: 22-Nov-2024, Pre QC No. JPA-24-152895 (PQ); Reviewed: 06-Dec-2024, QC No. JPA-24-152895; Revised: 16-Mar-2026, Manuscript No. JPA-24-152895 (R); Published: 23-Mar-2026, DOI: 10.4172/2320-0812.15.1.001
Citation: Anand KY, et al. Simultaneous Estimation of Linagliptin and Metformin HCL by Simple Precise UV Spectroscopic Method in Bulk and Marketed Tablets. RRJ Pharm Anal. 2026;15:001.
Copyright:© 2026 Anand KY, et al. This is an open-access article distributed under the terms of the Creative Commons Attribution License, which permits unrestricted use, distribution and reproduction in any medium, provided the original author and source are credited.
Visit for more related articles at Research & Reviews: Journal of Pharmaceutical Analysis
The present work was aimed to develop and validate spectrophotometric methods for simultaneous estimation of Linagliptin (LIN) and Metformin HCl (MeT) in a pure and tablet dosage form. The absorption maxima were measured for LIN and MeT in solvent blend Methanol: Distilled water at 1:1 was 293 nm and 236 nm respectively. This method was validated according to ICH guidelines. The percentage estimation of LIN (Linazex 5, Linares 5), MeT (Vrimet 500, Vrimet 250) and percentage estimation of LIN and MeT in combined marketed tablet (Linaplizin Duo) was done in proposed method. A linearity range for LIN and MeT is 5-30 μg/ml at respective wavelengths. The coefficient of correlation for LIN at 293 nm and for MeT at 236 nm is 0.9998 and 0.9999, respectively. The percentage recovery from the marketed tablets by method is 98.92 ± 0.481 to 100.01 ± 0.279 for LIN (Linazex-5, Linares-%), 99.58 ± 0.963 to 99.87 ± 0.531 for MeT (Vrimet-500, Vrimet-250) and 98.97 ± 0.207, 100.2 ± 0.531 for LIN and MeT in (Linaplizin Duo) with a % RSD less than 2. The proposed method was robust and can be successfully rugged and stable for 72 hr. The results conclude that the proposed method was simple, rapid, and validated and can be used successfully used for routine simultaneous estimation of LIN and MeT in a single and combined tablets.
Linagliptin; Metformin HCl; UV; Methanol; RSD
Linagliptin is a novel dipeptidyl peptidase-4 inhibitor representing a new therapeutic approach by stimulating glucose-dependent insulin release and reduction of glucagon levels. It acts through inhibiting the inactivation of incretins particularly glucagon like peptide-1 and gastric inhibitory polypeptide. Chemically it is 8-[(3R)-3-aminopiperidin-1-yl]-7-(but-2-yn-1-yl)-3-methyl-1-[(4ethylquinazolin-2-yl) methyl]-3, 7-dihydro-1H-purine-2, 6-Dione] as shown in Figure 1 [1].
Metformin HCl is a hypoglycemic agent which stimulates glycolysis in peripheral tissues and is considered to be a vital component in mixed therapies of oral hypoglycemics. Chemically it is N, N-dimethylimido dicarbonimidicdiamide as shown in Figure 1 [2].
These drugs are generally prescribed in multi-component dosage forms, which are available in the market [3]. Few analytical methods such as fluorometric were reported for Linagliptin, similarly few analytical methods such as HPLC, RP-HPLC reported for Metformin HCl [4]. Few literatures suggested simultaneous estimation of Linagliptin and Metformin HCl such as UV, RP-HPLC [5].
Suggested methods were expensive and tedious, it necessities the development of UV method for the estimation of Linagliptin and Metformin HCl [6]. In view of this, a simple, precise and accurate method for the simultaneous estimation of metformin and linagliptin in pharmaceutical dosage forms UV has been developed validated as per International Conference on Harmonization (ICH) guidelines (Figure 1).
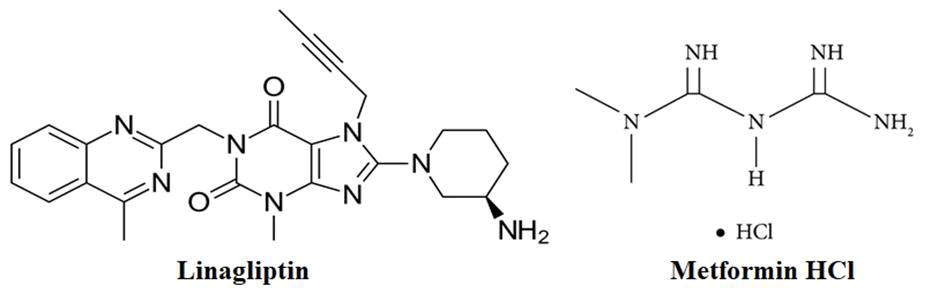
Figure 1. Chemical structure of Linagliptin and Metformin HCl.
Materials: Linagliptin (LIN) and Metformin HCl were obtained as gift sample (Fleming Laboratories Ltd, Hyderabad) [7]. Linazex 5, Linares 5, Vrimet 500, Vrimet 250 and Linaplizin Duo 2.5/500 marketed tablets were procured from local community pharmacy [8]. Methanol purchase from SD Fine-Chemicals, Bangalore, India. All the chemicals of analytical grade were used for the proposed study [9].
Instruments: A double beam UV-VIS spectrophotometer (UV-1900, Shimadzu, Japan) with UV Probe software was used for the analysis. Quartz cells having 3 cm length with 1 cm path length were used for spectral measurement [10].
Preparation of standard stock solutions of LIN and MeT: 25 mg of LIN and MeT were weighed separately and transferred into a series of two 25 ml volumetric flask. To these flask 25 ml of Methanol: Distilled water 1:1 solution was added, shaken 5 min and sonicate for 5 min to dissolve [11]. The obtained solutions were labeled as 1 mg/ml of concentrations respectively for LIN and MeT and used for further studies [12].
Sample preparation
Linagliptin marketed tablets (Linazex 5, Linares 5): In each case 10 marketed tablets were taken and ground into fine powder. Powder equivalent to 25 mg LIN was extracted with 25 ml of medium under study by shaking for 1 hr and sonicate for 10 min.
Metformin HCl marketed tablets (Vrimet 500, Vrimet 250): In each case 5 marketed tablets were taken and ground into fine powder. Powder equivalent to 25 mg MeT was extracted with 25 ml of medium under study by shaking for 1 hr and sonicate for 10 min.
Linagliptin and Metformin HCl (Linaplizin duo 2.5 mg of LIN /500 mg of MeT): Ten tablets were taken and ground into fine powder. Powder equivalent to 25 mg LIN and 25 mg MeT and was extracted with 25 ml of medium under study by shaking for 1 hr and sonicate for 10 min.
Determination of absorption maxima (λ max): The LIN and MeT standard stock solutions were appropriately diluted with medium under the study to obtain 10 μg/ml solutions separately. Both the solutions were scanned in the range of 200 to 400 nm using double beam UV spectrophotometer, and observe the characteristic peak at standard wavelength (nm).
Analytical method validation
The developed method was validated for linearity, accuracy, precision, specificity, robustness, Limit of Detection (LOD) and Limit of Quantification (LOQ), as per the ICH Q2 (R1) recommended conditions.
Linearity: Linearity of the developed method was determined by analyzing the serial dilutions of LIN and MeT between 5 and 30 μg/ml, and plotting the absorbance against concentration. Further, linearity of the method was confirmed by least square regression analysis on the obtained data by comparing the predicted and observed responses at 95% confidence interval using a Graph Pad Prism V9.
Accuracy: Accuracy of the method was determined as the mean percentage recovery from 30 μg/ml standard solution of LIN and MeT separately spiked with 40% (LQC: 12 μg/ml), 80% (MQC: 24 μg/ml) and 120% (HQC: 36 μg/ml) of additional amount of LIN and MeT. Further, SD, %RSD and SEM were calculated to check the accuracy of data within the specified limit.
Precision: Precision was assessed by assay of two different concentrations of LIN and MeT (LQC: 10 μg/ml, and HQC: 30 μg/ml) at different time intervals on the same day (i.e., intra-day precision or repeatability), and by repetition on the next day (i.e., inter-day or intermediate precision). Further, the magnitudes of mean percent recovery, SD and %RSD were also calculated.
Limit of detection and limit of quantification: The LOD and LOQ were determined from the Slope (S) of the linearity plot and standard deviation of the response to the blank sample (σ) as per the formulae enlisted in Equation (1).

Robustness: Robustness of the method was evaluated by analyzing the system suitability parameters after alteration in the nm (± 5). A working standard 10 μg/ml was used during the experimentation, followed by calculation of the mean percent recovery and % RSD.
System suitability: System suitability was assessed by six replicate analyses of standard LIN and MeT separately (10 μg/ml) followed by estimation of % recovery, SD and % RSD.
Ruggedness: Ruggedness of the method was evaluated by analyzing the system suitability for check the influence of process parameters varied intentionally on the proposed method viz., different analyst and different UV instrument. Interpret the results in terms of % RSD.
The absorption maxima were found to be 293 nm for LIN and 236 nm for MeT with characteristic peak in accordance with the literature data as shown in Figure 2.

Figure 2. Absorption maxima of Linagliptin and Metformin HCl.
Linearity: The linear calibration plot for LIN and MeT in the concentration ranging between 5 and 30 μg/ml as shown in Figure 3. The goodness of fit study suggests good correlation coefficient (R2) 0.9998 and 0.9999 for LIN and MeT respectively shows the validity of Beer’s law with intercept response <2% calculated by the least square method indicating functional linearity between the concentration of analyte and the absorbance (Figure 3).

Figure 3. Linearity curve for Linagliptin and Metformin HCl.
Accuracy: Accuracy data table 1 showed good percent recovery between 98.92 ± 0.481 to and 100.01 ± 0.279 for LIN (RSD <2%) and 99.58 ± 0.963 to 99.87 ± 0.531 for MeT (RSD<2%) for marketed tablets which suggest high degree of accuracy of the developed method. Table 2 illustrates the accuracy data for LIN and MeT by standard addition method (Tables 1 and 2).
| Drug | Brand name | Labelled claim µg/ml | Amount recovered (µg/ml) | % Recovery mean ± SD n=6 |
% RSD |
| LIN | Linazex 5 | 10 | 9.892 | 98.92 ± 0.481 | 0.492 |
| Linares 5 | 10 | 10.01 | 100.01 ± 0.279 | 0.217 | |
| MeT | Vrimet 500 | 10 | 9.987 | 99.87 ± 0.531 | 0.536 |
| Vrimet 250 | 10 | 9.958 | 99.58 ± 0.963 | 0.964 | |
| LIN | Linaplizin duo 2.5 | 10 | 9.897 | 98.97 ± 0.207 | 0.105 |
| MeT | Linaplizin duo 500 | 10 | 10.02 | 100.2 ± 0.531 | 0.536 |
Table 1. Accuracy data of proposed method for LIN and MeT in single and combined marketed tablets.
| Drug | Levels % | Concentration µg/ml | Amount recovered (µg/ml) | % Recovery mean ± SD |
% RSD |
| LIN 10 µg/ml | LQC 40 | 14 | 13.98 | 99.85 ± 0.352 | 0.332 |
| MQC 80 | 18 | 17.96 | 99.77 ± 0.479 | 0.437 | |
| HQC 120 | 22 | 22.04 | 100.18 ± 0.479 | 0.442 | |
| MeT 10 µg/ml | LQC 40 | 14 | 13.98 | 99.85 ± 0.173 | 0.17 |
| MQC 80 | 18 | 17.99 | 99.94 ± 0.110 | 0.1 | |
| HQC 120 | 22 | 21.99 | 99.95 ± 0.108 | 0.098 |
Table 2. Accuracy data for developed method by standard addition method.
Precision: The intraday and interday precision showed higher values of percent recovery of Linagliptin ranging between 100.20 ± 0.85 and 101.24 ± 1.44; Metformin HCl 100.02 ± 0.669 and 100.40 ± 0.383 whereas interday precision showed percent recovery of LIN ranging between 99.00 ± 0.97 and 99.50 ± 0.72; MeT 99.20 ± 0.69 and 99.40 ± 0.651. Further, the %RSD for LIN and MeT assay as per repeatability and intermediate precision were well within the 1%. These results confirmed high degree of precision of the developed method. Table 3 illustrates the interday and intraday for quality control samples of LIN and MeT (Table 3).
|
Drug |
Standard concentration µg/ml |
Amount recovered µg/ml |
% recovery n=6 |
% RSD |
|
Intraday precision |
||||
|
Linagliptin |
5 |
5.062 |
101.24 ± 1.44 |
0.991 |
|
10 |
10.02 |
100.20 ± 0.85 |
0.081 |
|
|
Metformin HCl |
5 |
5.02 |
100.40 ± 0.383 |
0.362 |
|
10 |
10.02 |
100.02 ± 0.669 |
0.662 |
|
|
Interday precision |
||||
|
Linagliptin |
5 |
4.95 |
99.00 ± 0.97 |
0.91 |
|
10 |
9.95 |
99.50 ± 0.72 |
0.654 |
|
|
Metformin HCl |
5 |
4.97 |
99.40 ± 0.651 |
0.641 |
|
10 |
9.92 |
99.20 ± 0.69 |
0.621 |
|
Table 3. Intra and interday precision data for the developed method.
LOD and LOQ: Based on standard deviation of the response and slope, the LOD values for LIN and MeT for the proposed methods found to be 0.001893 ± 0.02638 μg/ml, 0.001528 ± 0.02968 μg/ml, and limit of quantification values found to be 0.001893 ± 0.07994 μg/ml, 0.001528 ± 0.08994 μg/ml with % RSD values less than 2. The results indicating high sensitivity of the developed method for quantification of LIN and MeT.
System suitability: The system suitability results confirmed lack of significant difference in absorbance values after six replicate measurements of both LIN and MeT. The values of % RSD and SEM were found to be <1 %, thus corroborating high degree of accuracy of the UV instrument.
Robustness: The varied conditions such as absorption maxima ± 5 nm to the actual absorption maxima shows no significant difference between actual and varied nm. The magnitude of % RSD and SEM were found to be well within the limit (<2%).
Raggedness: In ruggedness analysis, by different analyst and different instrument indicate the proposed method is significantly rugged.
A simple, rapid, sensitive and economical UV method has been developed for quantification of LIN and MeT in alone also simultaneous estimation in marketed tablet formulations. Validation of method corroborated excellent linearity, accuracy, precision, system suitability and robustness. Further, experimentally observed values of LOD and LOQ of LIN and MeT were quite lower.
We wish to thanks to the principal and management of V. L. College of pharmacy for providing the facilities to carry out the work.
There are no conflicts of interest.
[Crossref] [Google Scholar] [PubMed]
[Crossref] [Google Scholar] [PubMed]
[Crossref] [Google Scholar] [PubMed]
[Crossref] [Google Scholar] [PubMed]
[Crossref] [Google Scholar] [PubMed]
[Crossref] [Google Scholar] [PubMed]