ISSN ONLINE(2278-8875) PRINT (2320-3765)
ISSN ONLINE(2278-8875) PRINT (2320-3765)
K.C. Sujitha, S. Leninisha
|
| Related article at Pubmed, Scholar Google |
Visit for more related articles at International Journal of Advanced Research in Electrical, Electronics and Instrumentation Engineering
Until now, various techniques have been proposed for predicting fault prone modules based on prediction performance. Unfortunately quality improvement and cost reduction has been rarely assessed. The main motivation here is optimization of acceptance testing to provide high quality services to customers. From this perspective, the primary goal of this proposed methodology is reduction of acceptance test effort based on fault prediction results using single linkage clustering and simulation model. The prediction is conducted using test dataset and fault prone module are predicted by means of jaccard similarity measure. Simulation model estimates number of discoverable faults and results of simulation showed that the best strategy was to let the test effort be proportional to the number of expected faults in a module multiplied by log(module size).
Keywords |
| Jaccard similarity measure, prediction model simulation model, test effort estimation. |
INTRODUCTION |
| With the rapid development in size and complexity of software systems, quality assurance activities such as testing and inspection have become more important for software developers and software purchasers who are responsible for acceptance testing. Fault prediction model have the potential to improve the quality of systems and reduce the costs associated with delivering those systems. Fault prediction modeling has become essential for the early identification of fault-prone code. These studies typically produce fault prediction models which allow software engineers to focus development activities on fault-prone code, thereby improving software quality and making better use of resources. |
| To prioritize quality assurance efforts, the techniques have been proposed for predicting fault prone modules by their probability of having a fault [8], the number of expected faults [6],[9] or the fault density [7]. Based on the prediction results, tester can allocate limited testing efforts to fault prone modules so as to find more faults with smaller effort. Our primary goal is to estimate the reduction of acceptance test effort that fault prediction can achieve. To achieve this goal, we need to allocate test effort with appropriate strategy to each module after prediction. We need to compute the expected number of discoverable faults with respect to test resources, resource allocation strategy, and set of modules to be tested. Tests currently conducted by the company are not complete, and most software systems contain faults after release [3]. The required test effort discovers as many faults as actual testing through simulation. To assess the cost effectiveness of prediction we need to measure the effort for metrics collection, data cleansing and modeling. |
| The next section explains related research ongoing in the fault prediction. In section 3 we explain architecture based analysis for our proposed methodology. Section 4 describes the results and conclusion. |
II. RELATED RESEARCH |
| Various studies in fault prediction to industry dataset have been reported previously [11], [12], [13], few studies have estimated the reduction of test effort or increase the quality of software achieved by fault prediction. |
| Arisholm et al. 2010 proposed systematic and comprehensive investigation of methods to build and evaluate fault prediction models [1]. To evaluate the fault proneness models, the three main aspects are (1) Data mining and machine learning techniques are compared, (2) Assess the impact of using different metric sets such as source code structural measures and change/fault history, (3) Performance of the models are compared in terms of accuracy, ranking ability, cost effectiveness measure. |
| Bug prediction models are used to allocate software quality assurance efforts. Effort needed to review code or test code when the prediction models are evaluated. Revisiting two common findings in the bug prediction literature (1) process metrics outperform product metrics, (2) package level predictions outperform file level predictions [14], whereas Kamei and et.al showed that file level predictions outperform package level predictions [4]. |
| Many researchers have discussion on probability of having a fault to distinguish fault prone modules from fault free modules [15]. On the other hand, some practitioners have discussion on number of faults to allocate quality assurance resources based on number of expected bugs that exist before testing [6],[9]. Some researchers have chosen the fault density rather than probability of having fault or number of faults since larger files have more defects [7]. |
| Graves et al. 2000 proposed predicting fault incidence using software change history [2].The code to be aged or decayed if its structure makes it unnecessarily difficult to understand or change. Process measures based on the change history are more useful in predicting fault rates than product metrics of the code. We also compare the fault rates of code of various releases, if a module is a year older than similar module, the older module will have roughly a third fewer faults i.e., the existing version contains lesser faults than current version for the same software project. |
III. PROPOSED METHODOLOGY |
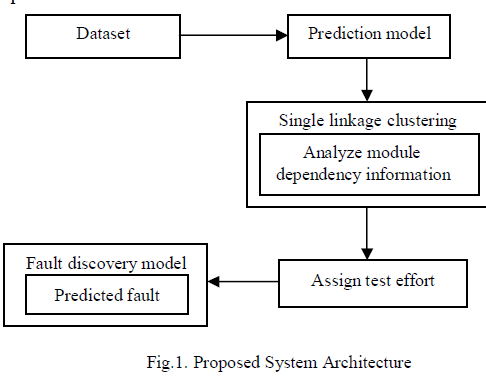
| As shown in fig.1 the most suitable dataset has been considered as input which has been taken from the historical dataset. By considering the dataset, prediction model is used to analyze the metrics in both source code and design document. Base metrics is the number of lines already exists in the existing version and change metrics is the number of lines added and deleted in the current version. Once the base metrics and change metrics is analyzed, single linkage clustering method is used to analyze the modules dependency information based on minimum distance. Jaccard similarity measure is used to calculate the distance. Based on the modules distance measure, simulation model is used to assign the test effort to each module. The allocated test effort for each module is computed based on the given test effort allocation strategy. After computing the test effort, fault discovery model discovers the fault with respect to the given test resources, resource allocation strategy and set of modules to be tested. Fault discovery model computes the discoverable faults in every module based on the test effort and module size. The number of initial faults before testing and the expected number of discoverable faults in each module are identified by the tester. So that testing time and testing costs are reduced by the tester to provide better services to the customer. |
 |
a. Prediction Model |
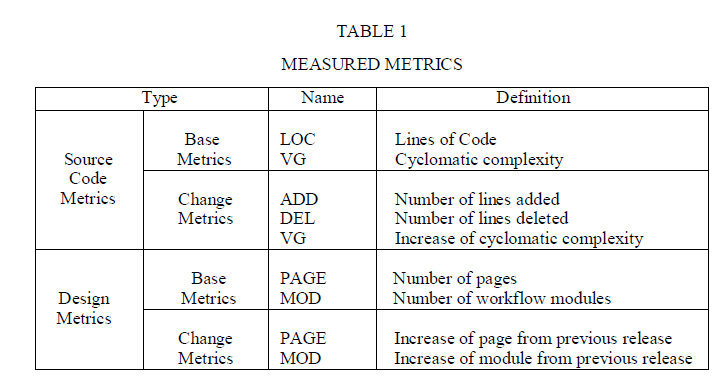
| The prediction model is conducted to analyze the base metrics and change metrics in both source code and design document. As shown in table 1, the base metrics for source code is the identification of number of lines in the existing version and change metrics indicates number of lines added and number of lines deleted in the current version. In this prediction model, we need to predict both the number of faults and fault density and their prediction performance is compared. |
 |
b. Single Linkage clustering |
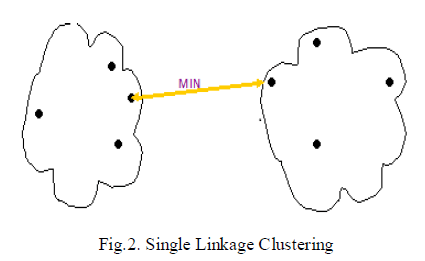
| The single linkage method is the best hierarchical methods and operates by joining the two most similar objects at each step, which are not yet in the same cluster. The similarity of two clusters is the similarity of their most similar members. As shown in fig.2, the link between two clusters is made by a single element pair, namely those two elements that are closest to each other. In single linkage clustering, the modules are analyzed and then their dependency information's are extracted. Based on the dependency information the modules distances are calculated |
 |
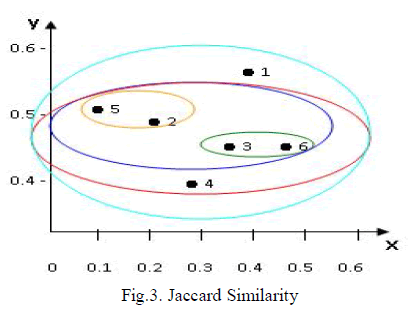
| As shown in fig.3, the two clusters separated by the shortest distance are combined into cluster first and at each step, we merge the closest pair of clusters until certain termination condition satisfied. For calculating, jaccard similarity measure is used. Jaccard similarity measure follows single linkage method i.e., it identifies the minimum distance between any two points in the two clusters. Jaccard similarity measure is defined as number of attributes common in two clusters divided by total number of attributes in both clusters. |
 |
| The modules are then clustered based on the jaccard distance metrics. As shown in equation 1, Jaccard similarity is a measurement that is used for identifying the degree of similarity and diversity of two cluster C1and cluster C2. The Jaccard coefficient used to measure the similarity between modules is defined as the size of the intersection divided by the size of the union. |
 |
| c. Test Effort Estimation |
| In this module 7 possible test strategies are compared to choose the best strategy, to allocate test effort to each module. |
| [1] Equal test effort to all modules. |
| This strategy is considered as a baseline strategy. |
| [2] Test effort based on new module size. |
| ti =t total .Si / S total |
| Where ttotal is total test effort of all modules, Si is size of ith module and S total is total size of all modules. |
| To assign more test effort to larger modules, industries used this basic strategy. Arisholm et al. [1] pointed out that effort needed to test or review the module is roughly proportional to size. Indeed, many companies use baseline values for test case density, for e.g. in operational testing one must run at least 10 test cases per thousand lines of code |
| [3] Test effort based on new and modified modules. |
 |
 |
| Strategy 6 allocates more test effort to larger modules; if the total test effort is limited the faults in smaller modules might not be found. Strategy 7 tries to reduce the effect of very large modules, while still giving additional test effort to larger modules. Simulation model showed that the best strategy was to let the test effort be proportional to “the number of expected faults in a module × log (module size)”. Based on the prediction results and total test effort, the allocated test effort for each module is computed based on the given test effort allocation strategy. |
d. Fault Discovery Model |
| Fault discovery model estimates the discoverable faults with respect to the resource allocation strategy, given test resources and set of modules to be tested. This model computes discoverable faults in every module based on the given test effort and module size. In this fault discovery model, the fault detection rate is inversely proportional to the size of the module. All the modules have same parameter i.e, given a certain amount of test effort and same module size, the ease of finding a fault becomes same. Then the number of initial faults before testing and the Probability of detecting each fault per unit time are identified and the expected number of discoverable faults in each module is identified. |
IV RESULTS AND DISCUSSION |
| The results of this proposed methodology rely on the fault discovery model, which we extended from the exponential software reliability growth model. This proposed methodology used datasets which is collected from different releases of one software project. Metrics are analyzed in both source code and design document of the suitable dataset. The modules are clustered based on jaccard similarity measures and follows single linkage clustering method to analyze the modules dependency information. After that a set of possible test strategies are applied to detect the fault prone modules using simulation model. Given the prediction results and total test effort, the allocated test effort for each module is computed based on the given test effort allocation strategy. These seven strategies are by no means complete. To find better strategies in the future, we need to conduct simulation model with other strategies. Using the fault discovery model the expected number of faults is predicted. We expect further researches to improve this model to be more accurate and more realistic. |
V CONCLUSION |
| In this proposed methodology, we presented a method called single linkage clustering that helps testers to locate the related faults and reduces the test effort by analyzing the modules dependency information. Using the simulation model, there are seven test effort allocation strategies are compared to evaluate the cost effectiveness of fault prediction. Strategy 4 and 7 were the two best strategies that could possibly reduce the test effort. By using the 7th strategy with our best fault prediction model, the test effort could be reduced by 25% to detect as many faults as actual testing. The reduction of test effort is achieved only if the appropriate test strategy is employed with high fault prediction accuracy. In the future, it will be important to study whether it is possible to provide another tool for practitioners to reduce the testing costs or increasing the quality produced by testing. |
References |
|