International Journal of Advanced Research in Electrical, Electronics and Instrumentation Engineering
ISSN ONLINE(2278-8875) PRINT (2320-3765)
ISSN ONLINE(2278-8875) PRINT (2320-3765)
Y. Vamsidhar1, Y.Srinivas2, Achanta Brahmini3
|
| Related article at Pubmed, Scholar Google |
Visit for more related articles at International Journal of Advanced Research in Electrical, Electronics and Instrumentation Engineering
In any business environment the ultimate objective is to derive a quality product. In order to deliver a quality product, the quality characterstics are to be mainly focused. Among the various Quality characterstics, Reliability is considered as the most predominant characterstics. Many models have been utilised for assessing the quality of a software using reliability but very little focus on Pareto Type III distribution. Hence this paper mainly projects in this direction.
Keywords |
| Non-Homogeneous Passion Process, Pareto Type II Growth model, Pareto Type III Growth Model, Software Reliability. |
INTRODUCTION |
| Software Reliability is mainly focused on identifying the failures in a given software and helps to build a reliable model by which the identified failures can be overcomed. Analysing the software helps to build an error-free system. Software growth model have gained importance since it can identify the probability of failure rate of a software in a given specified time and in particular to a specific environment. Any software reliability can be tested basing on different parameters such as lines of code (LOC), no. of loops within a program, based on the input and output data in these models are generally termed as defective density models. In any real time environment if a software occurs, we have to co-relate the failure rate and these failure rate is a co-relations of several factors. In order to identify these correlations statistical methodologies are well suited. Here the second types of models called reliability growth models are used. |
| Reliability Growth Models helps to identify the failure rate during the testing phase based on the input functions which are generally termed as exponential functions. These functions help to predict the behaviour of a software with the given functions. Much work has been reported in literature and most of the dominates the software Reliability Growth models are Crow and Basu(1988), Goel and Okumoto(1979,1984),Musa(1980),Pham(2005),Ramamurthy and Bastani (1982), Zhang,Teng and Pham(2003), Malaiya,Karunanithi and Verma (1982) and Wood(1996). Software Reliability models can be addressed using concave and S shaped Models, Gompetz curves etc. These models behave in a similar fashion where if probability of defects increases, the failure rate increases and if the no. of defects increases, the total no. of defects reaches a finite value. Software Reliability Models are probabilistic models where the failure of occurrences and fault removals are events in the model. |
| The Software reliability models are well estimated using Non-Homogeneous Poisson process(NHPPs)(R. Satya Prasad et al (2011)).Since its ability to determine the mean value function by which the expected no. of failures can be identified over a period of time. Among the Non-Homogeneous models Goel-Okumoto (1979, 1984) models proposed by R. Satya Prasad et al(2011) are mainly projects. The works of R. Satya Prasad are based on Pareto Type II models. But in order to estimate the failure rate most exactly pareto Type III distribution are more advantageous(Giuito Bottazi (2009)).Hence in this paper a Software Reliability Growth Model has been proposed using Pareto Type III distribution. The rest of the paper is organized as follows, Section II of the paper describe the Pareto model Development, Section III of the paper presents the parameter estimation of the pareto type III model, the experimentation based on NTDâÃâ¬ÃŸs Software failure data analysis is presented in Section IV and the conclusion derived or highlighted in Section V. |
II. PARETO TYPE III MODEL DEVELOPMENT |
| Software Reliability Model is well estimated using Non-Homogenous Poisson process. Non-Homogenous is a counting process which is used to determine an appropriate mean value function m(x). |
| Where m(x) represents the expected no. of software failures at time in this paper, we consider pare to type III distribution contains three parameters and m(x) is given by |
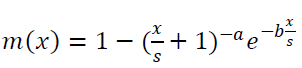 |
| Where x represents the cumulative time, |
| s>0 is a scale parameter and |
| If a>0 is a power coefficient then |
| a>=0 is a exponential coefficient |
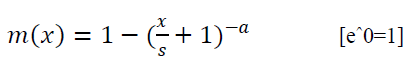
| If the exponential coefficients say b is set to 0 then the above equation reduces to Pareto type II model. The equation as follows. |
 |
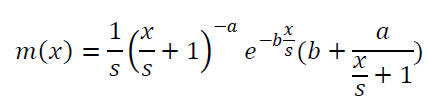
| We consider one new parameter in Pareto type III, (i.e.) scale parameter. The associated density function is |
 |
| The expressions of a, b, s can be estimated using logarithmic likelihood function and values can be obtained using Newton Rapson Model. |
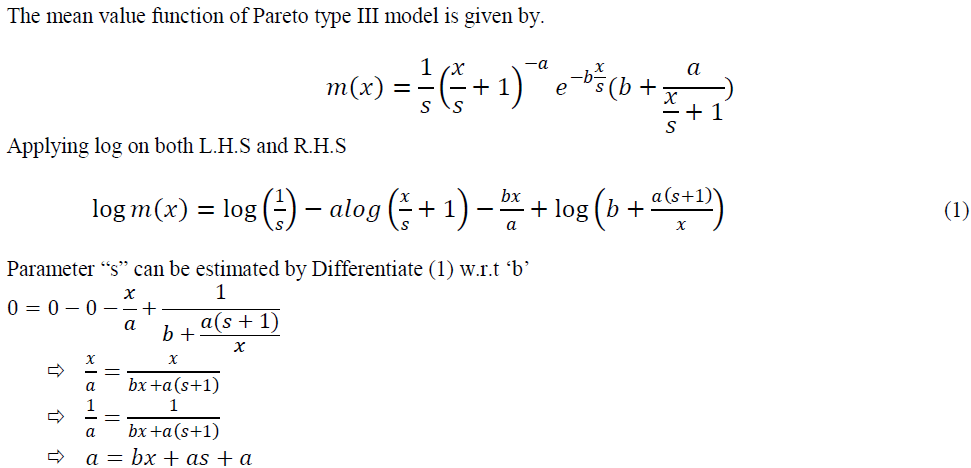
III. PARAMETER ESTIMATION OF PARETO TYPE III MODEL |
| In this section we derive expression for estimating the parameters of Pareto type III distribution. The parameter estimation is of time primary importance in software Reliability prediction. A set of failure data can be commonly collects=d in one of the two ways, time domain and interval domain data. In this paper we consider time between software failures for estimating the parameters. |
 |
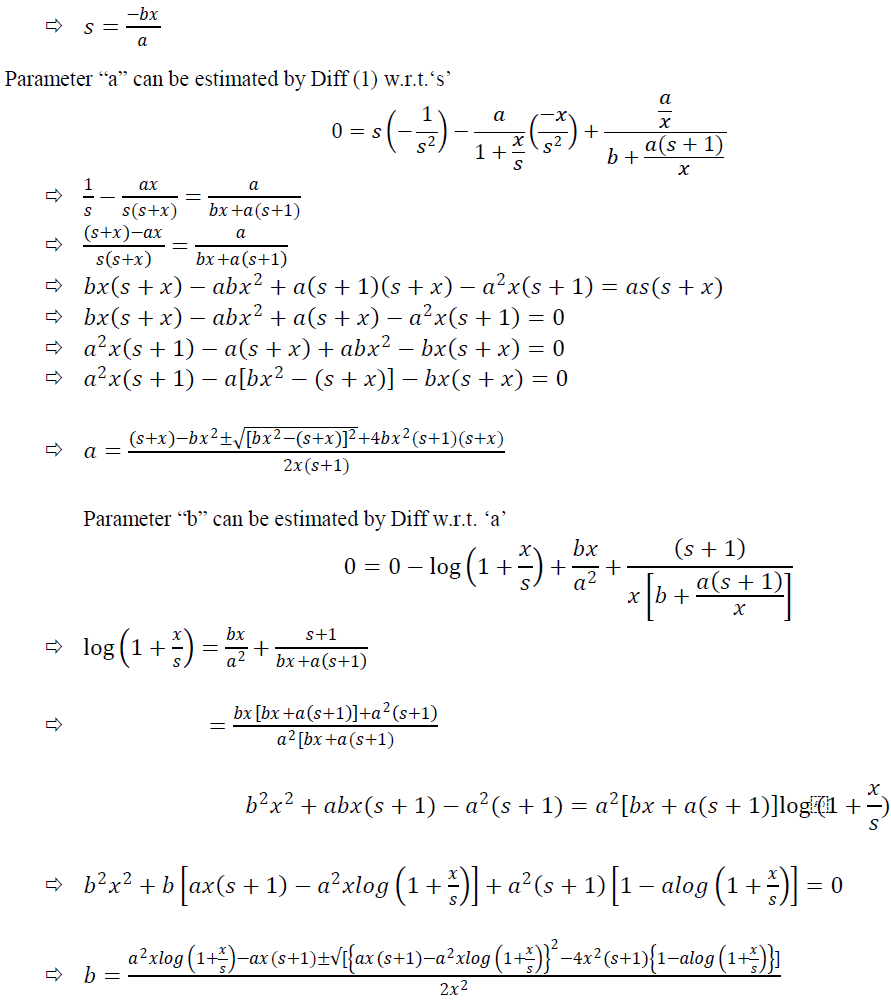 |
| The value of “s”, “b” in above equations can be obtained by using Newton Rapson Method. These equations are iteratively and the solutions are substituted in expression “a” to get the value of “a”. |
IV.DATA ANALYSIS |
| In this section we present the NTDS software failure data, taken from Jelinski and Mornda (1972).the Naval tactical Data Systems (NTDS) software failure data are taken from U.S Navy Fleet Computer Programming Center. The NTDS software consists of an error which consists of 38 modules. Each module consists of three phases; the production phase, the test phase and user phase. The time between software failures is shown in below table. |
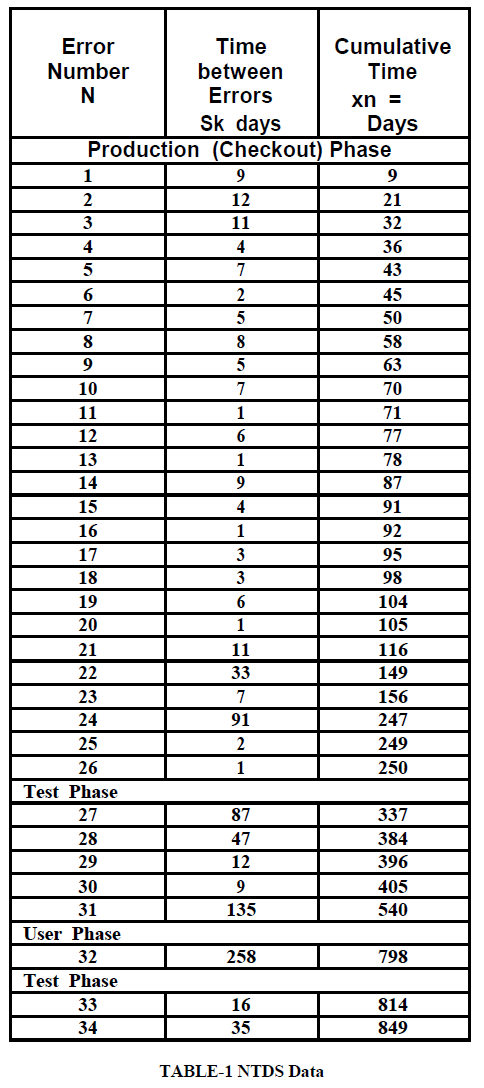 |
| Table-1, showing the dataset containing 26 failures in 250 days, time of errors and cumulative errors. |
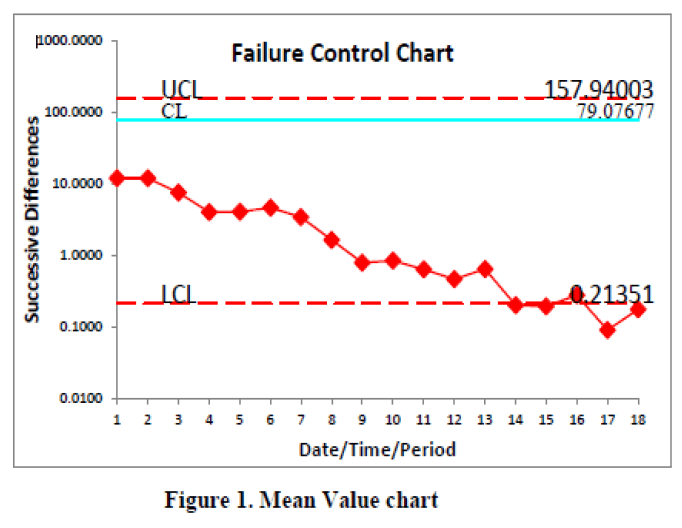 |
| Fig-I, showing the control chart of the failure data. |
VI.CONCLUSION |
| Software Reliability is an important quality measure that quantifies the operational profile of computer systems. In this paper we proposed Pareto type II software reliability growth model. This model is primarily useful in estimating and monitoring software reliability, which is viewed as a measure of software quality. Equations to obtain the maximum likelihood estimates of the parameters based on interval domain data are developed. This analysis shows that the Release 2 data (Figure 1) shows out of control signals i.e., below the LCL. We conclude that our method of estimation and the control chart are giving a +ve recommendation for their use in finding out preferable control process or desirable out of control signal. By observing the Mean Value Control chart (Figure 1) we identified that the failure situation is detected at 14th point of Table-2. Hence our proposed Mean Value Chart detects out of control situation. This is a simple method for model validation and is very convenient for practitioners of software reliability. The early detection of software failure will improve the software reliability. The methodology adopted in this paper is better than the methodology adopted by Xie et al [2002]. Therefore, we may conclude that this model is the best choice for an early detection of software failures. |
References |
|