ISSN ONLINE(2278-8875) PRINT (2320-3765)
ISSN ONLINE(2278-8875) PRINT (2320-3765)
K. K. Abdul Salam1, Jidhin Jayan2, R. Syamkumar3
|
| Related article at Pubmed, Scholar Google |
Visit for more related articles at International Journal of Advanced Research in Electrical, Electronics and Instrumentation Engineering
Solar energy is the most renewable and reliable form of energy available to mankind. All renewable energies, other than geothermal and tidal, derive their energy from the sun. Accurate measurement devices for solar energy are not available. Devices like pyranometer are capable of measuring solar intensity but, they fail to draw the exact picture of the incident energy. These facts are considered in this work to design a device which is more reliable and efficient than the existing devices. This design presents a device to measure the solar intensity at a specific location and time, using a photovoltaic cell and a microcontroller based circuitry, which is interfaced with a personal computer.
Keywords |
| Renewable energy, solar intensity, solar cell, insolation. |
INTRODUCTION |
| Solar intensity data log is an instrument for calibrating the insolation of sun light. Being aware of the available intensity of an area, it is easier to design and implement a solar power plant in that area. Such a design criteria requires the number of solar cells and their placing and how much battery to store the generated power. The existing technology to measure solar intensity is Pyranometer which is a broad spectrum device [7]. This device manages the calculations for the whole spectrum which includes radiations which may not provide any work function. Thus the efficiency of this device is very low. Considering these factors, a low cost device for measurement of solar intensity is designed and is presented in this paper. This may provide intensity manipulation for the relevant spectrum of solar radiation. |
BLOCK DIAGRAM |
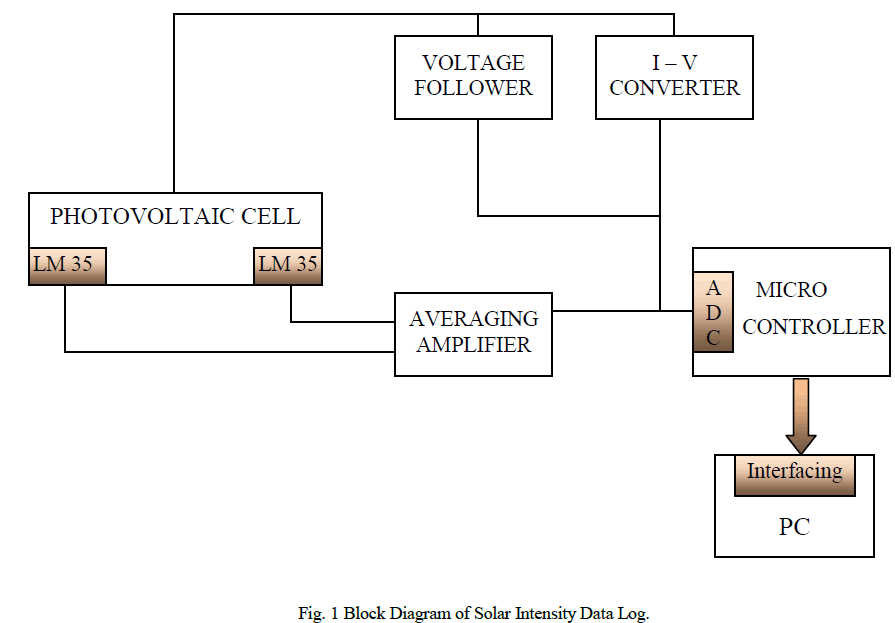 |
| The Photovoltaic cell converts the solar radiations in to voltage and current. In this design we have used a 5W, 6 V photovoltaic cell. Temperature sensors were used to measure temperature variations on the surface of photovoltaic cell. LM 35 is used as the temperature sensor in this design. An averaging amplifier is used to get the average value of the output voltage from multiple temperature sensors. The microcontroller used is Atmega8 series for the data storage and interfacing support functions. This microcontroller contains its own ADC, which converts input voltage to digital terms, which will later be stored in the internal RAM of the microcontroller. For this purpose the measured current value will be changed to voltage using a current to voltage converter. Unity gain voltage follower is also embedded to the system. |
A. Photovoltaic Cell |
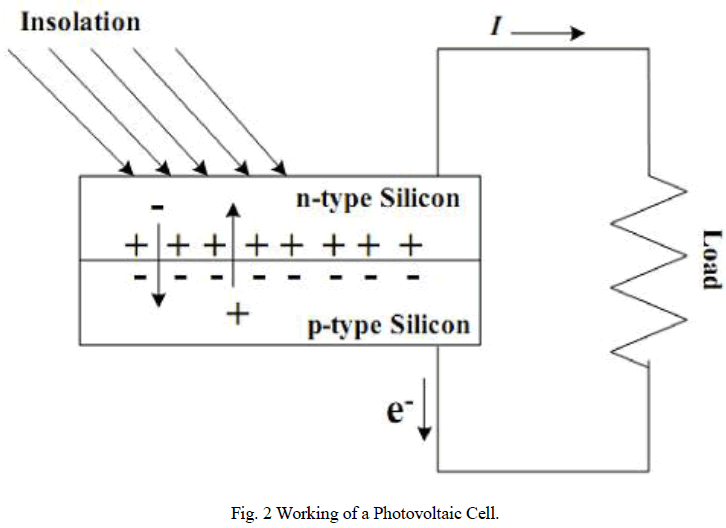
| A photovoltaic cell is made up of at least two layers of semiconductor material which is p-type and n- type semiconductor material. When light falls on the photovoltaic cell with photons having sufficient energy, it results in the flow of electrons from the negative layer to the positive layer through the external circuit [1] – [6]. This flow of electrons constitutes current. To realize sufficient power, more number of photovoltaic cells is connected in series in a weatherproof package to increase their voltage rating. Such a durable package results in a photovoltaic module. Series or parallel combinations of photovoltaic modules form a solar panel and a group of photovoltaic panels result in a photovoltaic array. |
 |
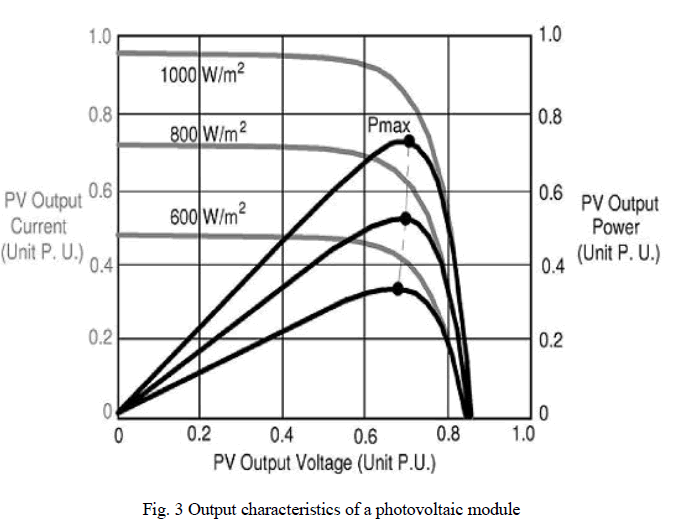
| The maximum power of the photovoltaic module changes with climatic conditions, and there is only one value for the current (Imax) and the voltage (Vmax), which defines the maximum power point (Pmax), as shown in fig 3. The photovoltaic current changes with the solar irradiation level, whereas the photovoltaic output voltage changes with the temperature of the photovoltaic module [2] – [3]. Therefore, an important challenge in a photovoltaic system is to ensure the maximum energy generation from the photovoltaic array with a dynamic variation of its output characteristic and with the connection of a variable load. A solution for this problem is the insertion of a power converter between the photovoltaic array and load, which could dynamically change the impedance of the circuit by using a control algorithm. |
 |
CIRCUIT DIAGRAM |
 |
 |
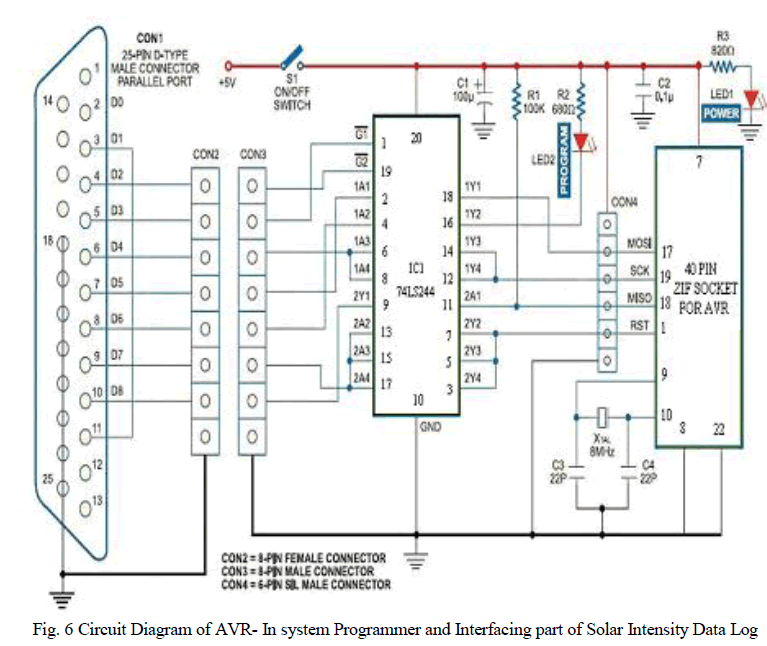 |
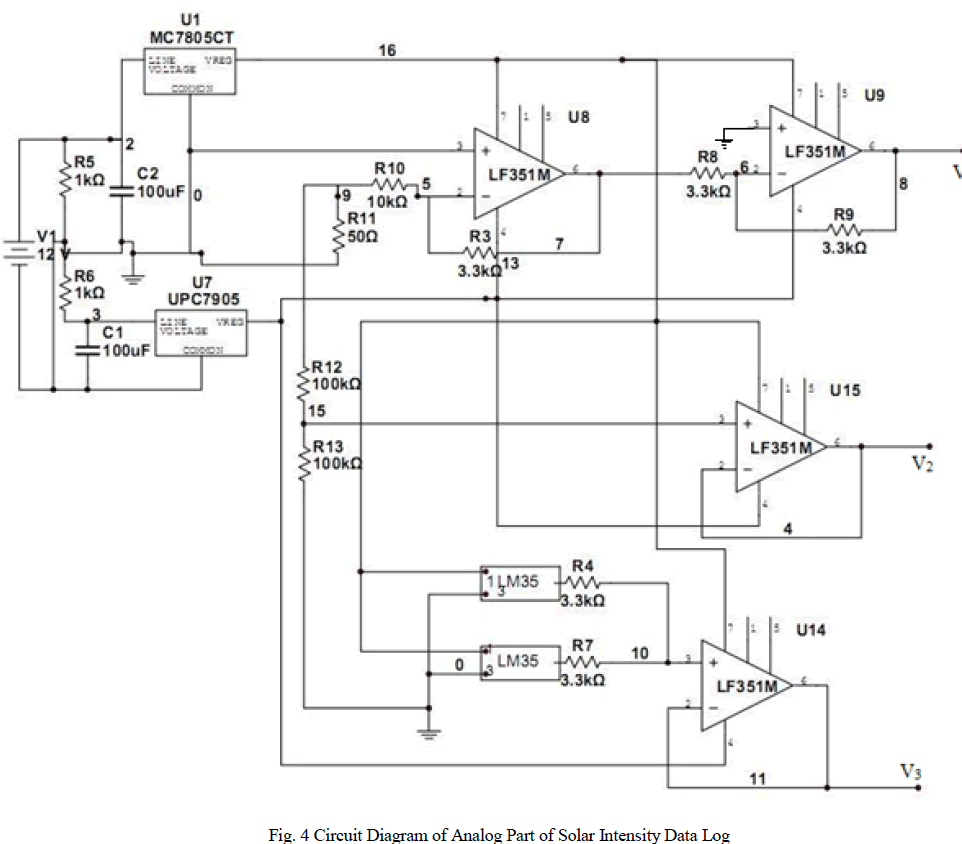
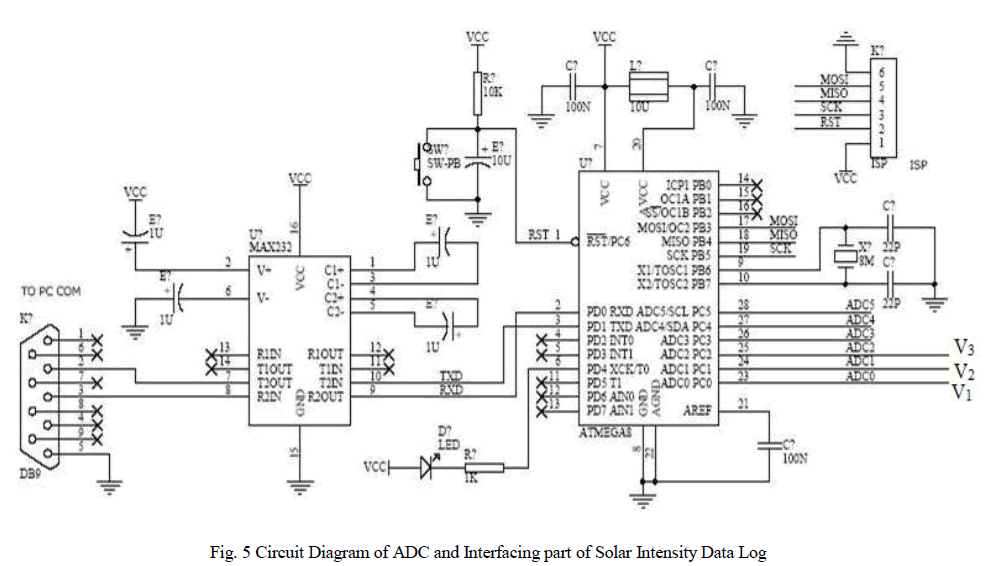
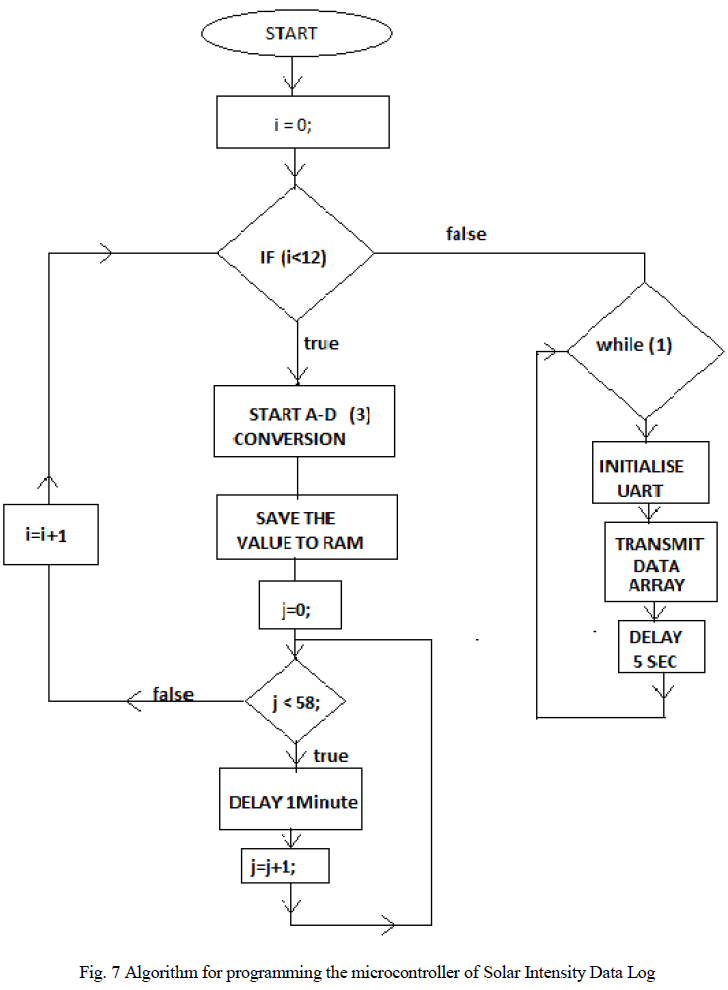
| A 5W, 6V photovoltaic cell is used in the design. The current to voltage converter converts the output current from the photovoltaic cell in to a voltage (V1). Two LM 35 temperature sensors are used at both ends of the solar panel and the voltage output from each are averaged (V3) before applying to the built in ADC of the microcontroller. The ADC converts the input analog voltage in to digital form and is saved in the internal RAM of the microcontroller [8]. The stored data is taken each day to a PC through MAX 232 interface, for further processing. |
PROGRAMMING THE MICROCONTROLLER |
 |
RESULTS AND DISCUSSIONS |
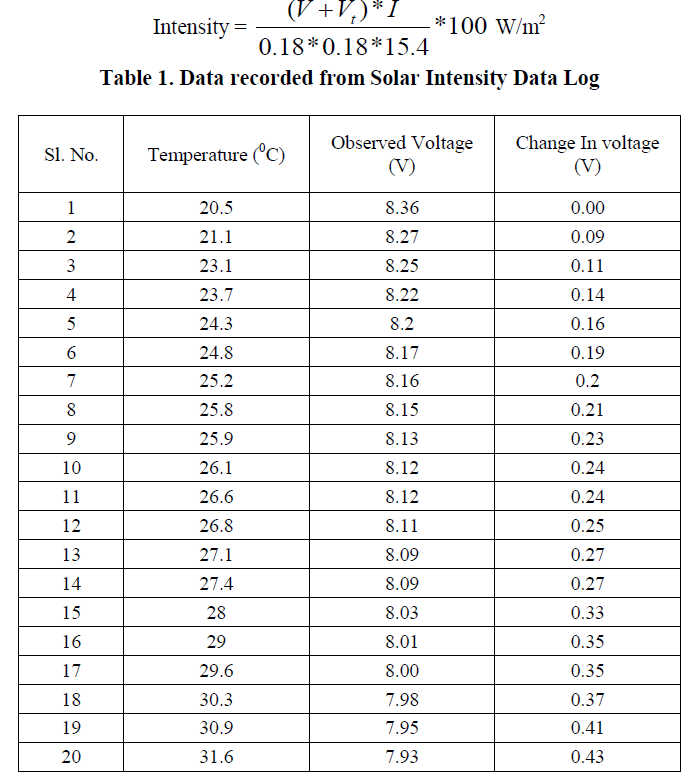
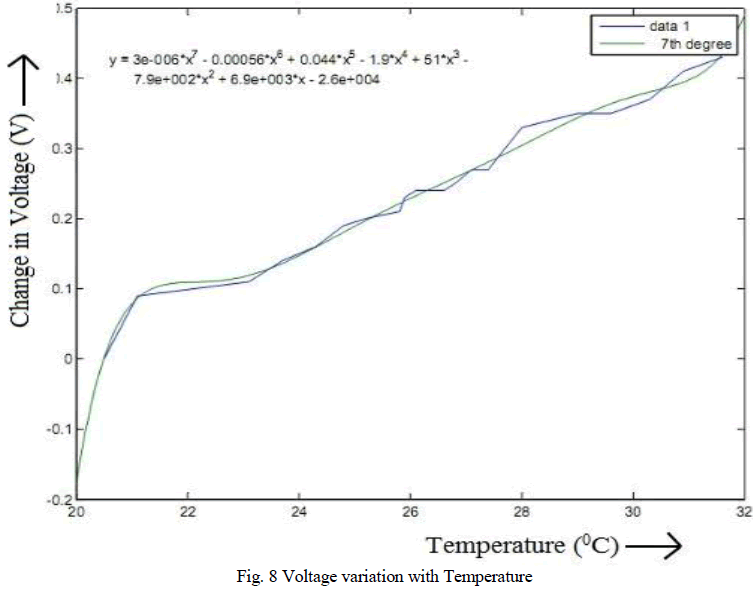
| A photovoltaic cell of 18 cm x 18 cm with a capacity of 1000 W/m2 at 25 0C and an efficiency of 15.4 % is used for the implementation of the device. The temperature and voltage output are recorded at one hour intervals and the change in voltage with temperature is plotted in Matlab. From the plot the expression for the voltage variation with temperature is extracted using curve fitting. A seventh degree expression of temperature is obtained from extraction. The extracted expression is, |
 |
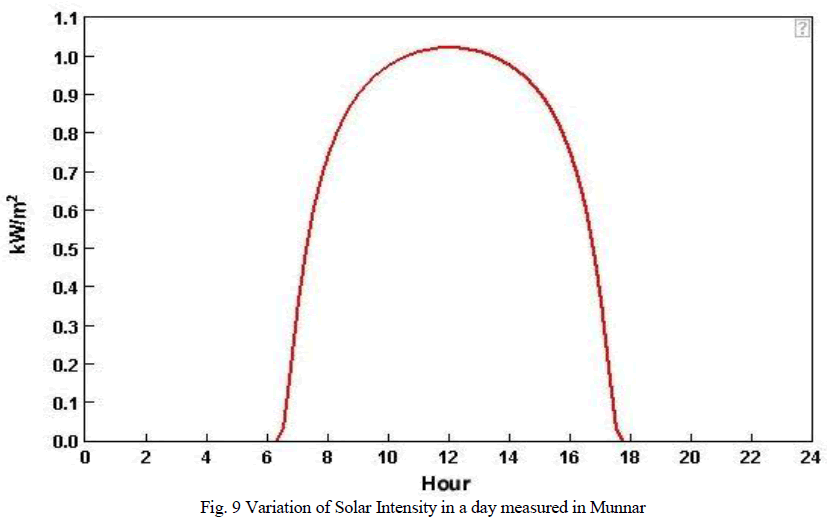
| The plot corresponding to this expression and the plot corresponding to the recorded values were found to be matching, and is shown in fig. 8. The solar intensity is also calculated at one hour intervals and the plot using Matlab is shown in fig. 9. |
 |
 |
 |
CONCLUSION |
| Solar Intensity Data log (SID) is a device which finds greater application in solar power generator design purpose. Being a low cost device in its family it provides greater accessibility to common man. Using a photovoltaic panel as primary sensor it has greater resemblance to the real solar panel properties. By programming the microcontroller for more duration we can create the data log for more duration and thus can confirm the necessary features needed for the development of a good solar power plant. Thus SID leads to be the best among the currently available solar intensity measuring devices with selective bandwidth. |
References |
|