1Department of Statistics, University Of Peshawar, Pakistan
2Department of Statistics, Islamia College Peshawar, Pakistan
Received date: 27/03/2018 Accepted date: 21/06/2018 Published date: 25/06/2018.
Visit for more related articles at Research & Reviews: Journal of Statistics and Mathematical Sciences
In this paper we have proposed an efficient estimator for estimating the mean of finite population under simple random sampling schemes. We have proposed a modified ratio estimator whose efficiency is the same as of regression estimator. It is a well establish fact that linear regression estimator is more efficient than most of the ratio estimators. We have found the Bias and MSE up to first order of approximation. The conditions under which the proposed estimators perform well as compared to other estimators. These properties are supported by real data sets.
Auxiliary information, Study variable, Bias, MSE, Percentage relative efficiency
The efficiency of an estimator can be increased largely, if we incorporate the auxiliary/benchmark variable(s) correlated with the study variable. Utilizing auxiliary information in a way so that the results become highly efficient. The use of auxiliary information is a challenging problem. Many statisticians use auxiliary information in their own way. It was Cochran who first uses auxiliary information in estimating the mean of finite population. Many other Statisticians make use of auxiliary information at estimation stages [1-6].
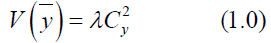
The Classical estimator of the mean of the finite population  This estimator is an unbiasedestimator of population
mean and its variance is given by
This estimator is an unbiasedestimator of population
mean and its variance is given by
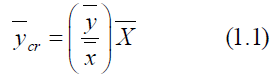
Cochran [1] introduces the traditional ratio type estimator and is given by
The Bias and MSE are
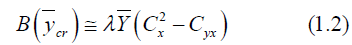
And

Where  the coefficient of variation of the study variable Y is,
 is the coefficient ofvariation of the auxiliary variable
 is the coefficient of covariance between the studyvariable and the auxiliary variable and
 is the coefficient of correlation
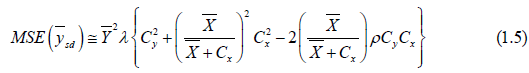
between Y and X.Sisodia and Dwivedi introduces the ratio type estimator for estimating the mean of finitepopulation and is follows as,
is the coefficient of correlation
between Y and X.Sisodia and Dwivedi introduces the ratio type estimator for estimating the mean of finitepopulation and is follows as,
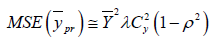
The mean square error is
An exponential ratio type estimator due to Bhal and Tuteja[7] is given by
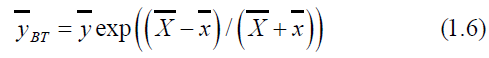
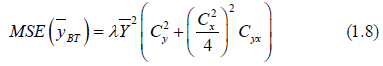
The Bias and MSE of (1.6) is given by
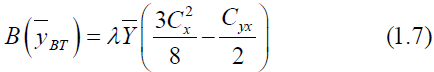
&
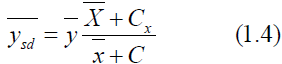
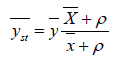
Sing and tailor [8] proposed another estimator for estimating the mean of finite population for theknown value of correlation coefficient between the study variable and auxiliary variable. The estimatoris given by
 (1.9)
(1.9)
The MSE is written as

We suggest the following estimators
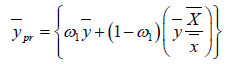 (2.0)
(2.0)
Where 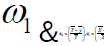 are constants or some functions of auxiliary information which is to be determined, sothat to get minimum MSE
for the proposed estimator.
are constants or some functions of auxiliary information which is to be determined, sothat to get minimum MSE
for the proposed estimator.
Properties of the First Proposed Estimator
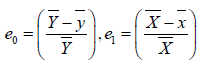
We will come across through the following terms and notations to compute the Bias and MSE for theproposed estimator,

Then we can write (2.0) as follows

By neglecting the higher power terms, we have

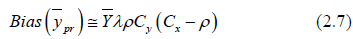
The Bias corresponding to (2.0) is given by
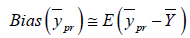
Or

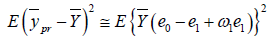
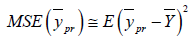
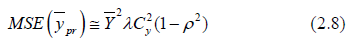
For MSE, Squaring and taking expectation of equation (2.3), we have
 (2.5)
(2.5)
Since,
 (2.6)
(2.6)
We can find the optimum value of  by minimizing the MSE of with respect to ω1
Differentiating (2.6) w.r.to  and equating to zero
 we get
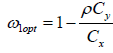
By substituting  , in (2.4) and (2.6) we get
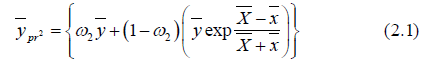
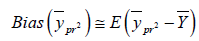
Properties of the Second Proposed Estimator
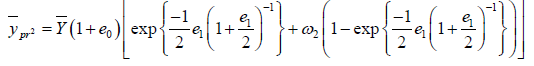 (2.9)
(2.9)
Terms with power higher than two is ignored, we have
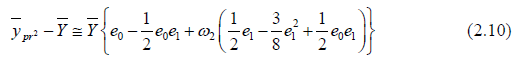
We can write
or

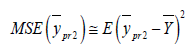
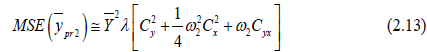
For MSE, Squaring and taking expectation of equation (3.3), we have
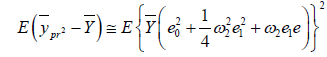 (2.12)
Since,
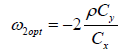
The optimum value of ω2 can be find out by minimizing (3.6) with respect to the
Differentiating (3.6) w.r.to ω2 and equating to zero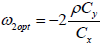 we get
Substituting (3.4) (3.6) for  we get
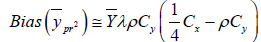 (2.14)
 (2.15)
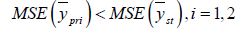
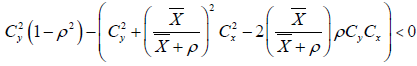
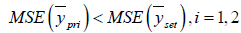
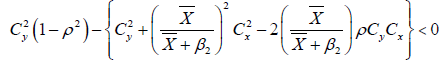
Theoretical Comparison of Proposed Estimators
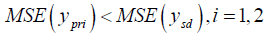
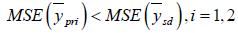
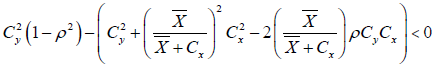
Following are the conditions under which the suggested estimator performs well than the existingestimators considered here.
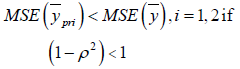
Which is always true if and only if ρ ≠ 0
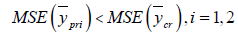
If
This is always true,
If,
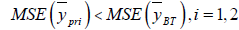
If
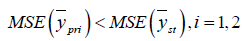
If
If
Obviously the above conditions will always true when we apply it to real data sets.
Applications in SRS
Here in this section we will apply our proposed estimator to different real data sets taken from variousfield of life. The table 2 below shows that our proposed estimator is best as compared to the existingestimators, discussed in the literature. The following data sets have been considered for the comparisonpurpose.
| Parameters | data set 1 Source: Murthy (1967), | Data set 2 Source: Murthy (1967), | Data set 3 Source: US Agriculture Statistics(2010) | Data set 4 Source: Koyuncu and Kadilar (2009) | Data set 5 Source : Pakistan MFA (2004) |
|---|---|---|---|---|---|
| N | 108 | 80 | 69 | 923 | 97 |
| n | 16 | 20 | 17 | 180 | 25 |
 |
461.3981 | 11.2664 | 4505.16 | 11440.498 | 3050.28 |
 |
172.704 | 51.8264 | 4514.9 | 436.43 | 3135.62 |
| ρ | 0.828315 | 0.3542 | 1.3756 | 1.718299 | 2.302173 |
| ρ | 0.6903 | 0.7507 | 1.18324 | 1.8645 | 2.327893 |
| ρ | 0.7896 | 0.9513 | 0.902327 | 0.9543 | 0.9871 |
| β1 | 1.3612 | 1.05 | 5.141563 | 3.9365 | 28.345 |
| β2 | 1.6307 | -0.06339 | 29.77932 | 18.7208 | 50.32 |
Table 1: Differeent data sets with their parameteres values.
| Estimators | Population 1 | Population 2 | Population 3 | Population 4 | Population 5 |
|---|---|---|---|---|---|
 |
100 | 100 | 100 | 100 | 100 |
 |
263.83 | 66.28 | 439.899 | 939.7 | 3818.46 |
 |
263.92 | 82.5 | 440.15 | 940.11 | 3823.8 |
 |
168.81 | 200.13 | 448.38 | 817.15 | 895.53 |
 |
263.93 | 87.067 | 440.05 | 939.91 | 3820.9 |
 |
264.03 | 65.05 | 448.34 | 943.8 | 3895.86 |
 |
266.15 | 877.54 | 538.19 | 1119.7 | 3994.77 |
Table 2: Percentage relative efficiency of the proposed estimators against some existing estimators
It is clear from above table that efficiency of our proposed estimators is optimum than all estimatorsconsidered in the literature, for all data sets. The conditions mentioned above also supported by the real data. Both estimators are equally efficient and give best results tan all others considered above. So we can modify some basic ratio estimators by assigning some suitable constants to them and hence their efficiency can be increases considerably.