Mahendra M. Alate*
Department of Mathematics, Krishna Institute of Medical Sciences Karad, Maharashtra, India
Received: 25-Jul-2022, Manuscript No. JSMS-22-70130; Editor assigned: 29-Jul-2022, Pre QC No. JSMS-22-70130 (PQ); Reviewed: 11-Aug-2022, QC No. JSMS-22-70130; Revised: 18-Aug-2022, Manuscript No. JSMS-22-70130 (A); Published: 29-Aug-2022, DOI: 10.4172/J Stats Math Sci.8.6.002.
Visit for more related articles at Research & Reviews: Journal of Statistics and Mathematical Sciences
Background: The people define their age from date of birth which said to be the “Chronological Age”. Regard less of the chronological age, the physical condition of the body determines the biological age or physiological age or functional age, which depends on several factors such as eating habits, lifestyle, genetics, cellular functions, lifestyle diseases and disorders, nutritional behavior, gut micro biome and other clinical conditions. The social-demographic parameters like population density, poverty in population groups, education, unemployment, poor food habits and hygiene and occupation-specific physical activities. It has evidenced from objective measures within and outside the body that the biological age is different from the actual chronological age.
Aim: Estimate of biological age rural population of western Maharashtra on its social-demographic parameters.
Materials and Methods: A study was conducted in a rural area of western Maharashtra and collected data in the form of a secondary source. Biological age was measured by using a standard instrument Omron HBF-375-Body Composition Monitor. We were studied total 300 records, those having age 18 to 60 years old included and any surgical illness and physically handicapped participants were excluded.
Results: We observed that 30% of people are preferred to only veg food in their rutting life. The proportion of non-vegetarian people is larger than vegetarian people. Correlation between biological age, chronological age and Body Mass index (BMI) was positive as compared to the systolic blood pressure, diastolic blood pressure and blood sugar level respectively. The respondents increasing Body Mass index showed that about 48% were obese or overweight in a rural area.
Conclusions: Ratio of Biological age and chronological is not same. Economical statues should be affecting on the biological age. The coefficient of correlation between social-demographic parameters and the biological age is positive. The study provided a statistically significant explanation about the complex interaction between different parameters taken into consideration under biological ageing.
Genetics; Biological age; Statistical methods; Parameters; Correlation
The Age is defined as the number of years something has been alive or in existence. The term age classifying two types in term of the medical field. First Actual age (i.e. chronological age) and other one biological age which is different from each other or may be same? Actual age start from human birth. Biological age refers to how old the human seems to be. It is a measure of how well or poorly body is functioning relative to actual calendar age of an individual person.
Estimation of Biological age (BA) important role of the biomarkers. They clearly reflect the health status with aging has been known as a marker for evaluating the body’s physiologic function, health status and aging state [1]. The Knowledge of the biological age to be needful for in life. At certain level of age to change the lifestyle and also necessary to improve health and increase the vitality of an individual person. Our study identifying how to disturbing the biological age as compare to the age actual i.e. is chronological age. The Biological age assessment includes an evaluation of health risk factors, nutrition, absolute and dynamic strength testing, flexibility, body composition, cardio respiratory fitness etc.
Dr. Reem Waziry conducted study on BA a determinant of age-related diseases. In 2019 Harvard T.H. Chan School of Public Health [2]. Chorological age is not a enough measure of the accurate physiological state of the body. The association between biological age with all-cause mortality (HR 1.15 vs. 1.13 and 1.10), all-cause morbidity (HR 1.06 vs. 1.05 and 1.03), stroke (HR 1.17 vs. 1.08 and 1.04), cancer (HR 1.07 vs. 1.04 and 1.02) and diabetes mellitus (HR 1.12 vs. 1.01 and 0.98). Individuals who were biologically younger exhibited a healthier life-style as reflected in their lower BMI (P<0.001) and lower incidence of stroke (P<0.001), cancer (P<0.01) and diabetes mellitus (P=0.02). Dr. Reem suggested that, biological age based on the biomarker composite model of physiological parameters such as, C-reactive protein, creatinine, albumin, total cholesterol, cytomegalovirus optical density, urea nitrogen, alkaline phosphatase, forced expiratory volume and systolic blood pressure. The above motioned parameters are useful construct to assess individuals 65 years and older at increased risk for specific age-related diseases.
Karina Louise conducted study in 2022 on healthy population of 100 women and men were used as biomarkers to establish an estimate of biological age [3]. The Principal component analysis was applied to the biomarkers estimated biological age. The first principal component accounted for 31% in women and 25% in men of the total variance in the biological age due to combining mean arterial pressure, glycated hemoglobin, waist circumference, forced expiratory volume. The correlation between the biological age and chronological age was having correlation coefficient r=0.86 with corresponding P value<0.001 in women and correlation coefficient r=0.81 in men with corresponding P value<0.001 respectively. There was no significant difference was found between mean chronological age and mean biological age.
Chul-Young Bae estimated biological age using waist circumference, waist hip circumference, height, LBM%, and weight (clinical parameters) associated with body composition for the purposes of examining a person’s body shape based on their chronological age [4]. In Korea under the general medical checkup at health promotion centers at university and community hospitals from 2004 to 2011, total 243,778 participants enrolled in this study among the age group 20 and 90 years old. They find out the clinical parameters with the highest coefficient of correlation to age included the waist-to-hip ratio (r=0.786, P value=0.001), hip circumference (r= -0.448, P value=0.001), and height (r= -0.377, P value=0.001) among the male. Some of the clinical parameters with the highest correlation coefficient to age include the waist-to-hip ratio (r=0.859, P value=0.001), waist circumference (r=0.580, P=0.001), and hip circumference (r = 0.520, P value=0.001) respectively. The fitted multiple regression for estimating body shape biological age might be a novel approach to variation in body shape that is due to aging. The estimated model body shape biological age, coefficient of determination (R2) was 0.71 in men and 0.76 in women respectively.
They were also suggested baseline data for upcoming research to examine not only the effects of changes in body shape due to the aging process on the degree of aging in individuals, the rate of aging progression, and life expectancy, but need of information surrounding correlations between body shape, disease, morbidity, and mortality.
Harvard T. H. Chan School of Public Health, Boston conducted study on biological age among healthy elderly participants predicts aging-related diseases and dementia in August 2021 [5]. Total 1930 participants were included in the study with a mean age of 72 years and a follow-up period of over 7 years, using two variants of a phenotypic blood-based algorithm that either excludes (Bioage1) or includes (Bioage2) Neurofilament light chain (NfL) as a neurodegenerative marker. When they were observed first five year age and three year time interval age each one year increase in biological age 1 was associate 15% and 16% evaluated risk of mortality. If we fixed chronological age, APOE status and gender, increase of biological age was found to be associated with elevated risk of all-cause mortality and major ARDs such as coronary heart disease, diabetes, cancer, stroke, COPD and dementia.
Biological age the deviation of biological age measure from chronological age predicts risks of mortality and major prevention of aging-related diseases onsets, especially dementia, in advanced age of populations. Klemera and Doubal conducted similar kind of study and showed that over a median follow-up of 11 years, biological age at baseline was superior to chronological age and traditional biomarkers, in predicting mortality, morbidity and onset of specific diseases such as stroke and cancer [6].
Levine et al., has introduced new approach of measuring of ‘phenotypic age’, developed and validated on The third National Health and Nutrition Examination Survey NHANES III (n=9926). They applied a Gompertz proportional hazards regression to account for the hazard of mortality when selecting clinical biomarkers in the dataset. This method is unlike most of the previous biological age algorithms, outcome of this method the association between accelerated biological age and elevated risk of age-related co morbidity. The “phenotypic age” algorithm was unable to establish a significant link between accelerated aging and elevated risk for dementia.
In 1994 Uttley and Crawford observed the difference between chronological age and biological age and concluded that, predicted age can be considered as an estimate of biological age, and may help to identify how much it differ from a chronological age [7]. In 1998 Johanson et al. and in 2000 Hak et al. have conducted study and observed age-related changes in bone and developed a model for human aging and observed basic biological changes that take place with increasing age.
In Cardiovascular Institute, a cardiology specialized hospital in an urban area of Tokyo, Japan conducted study on Electrocardiogram (ECG) and Biological age. Generally ECG used for the risk of cardiac diseases but in this study novel approach is that predict biological age with help of the ECG. They were registered patients 19,170 in this study from February 2010 to March 2018. Biological age was developed with help of principal component analysis. After taking 320 days follow-up there were 55 all-cause deaths by not adjusted for age (BAE) and 23 cardiovascular deaths by adjusted for age (BAEC). The predictive capabilities for all-cause death by BA, BAE, and BAEC using area under the curves were 0.731, 0.657, and 0.685, respectively, which were comparable to 0.725 for CA (p=0.760, 0.141, and 0.308, respectively). Biological age predict capability for mortality compared to CA by using 12-lead ECG.
The present study was designed to evaluate there was any relation between the BA and CA. Varies studies carried out on the BA which have shown, the some of the factor affecting on the BA. Therefore present study observed, what are the parameters affected on the BA.
An Observational study was conducted on rural area. Information regarding the personal data was collected with the help of a pre tested questionnaire from respondents. In this study we are included individuals having above age 18 to 60 years old. Individuals having any other co-morbid medical/surgical illness and physical handicapped participants were excluded.
Sample size
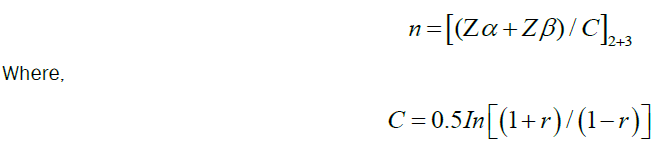
According to the correlation between actual (chronological) age and biological age of all respondents found positive significant r=0.73.
Nakamura suggested the correlation coefficient between the estimated biological and physical fitness ages was 0.73 (p less than 0.01). Biological age versus physical fitness age in European Journal of Applied Physiology and Occupational Physiology Jan 1989, Volume 58, Issue 7, pp 778–785.
C= 0.5 ln (1+ 0.72/1-0.72)
C=0.5 ln (1.72/0.284)
C=0.5 ln (6.1428)
C= 0.5 (0.7883)
C=0.3941
Now,
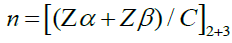
n = [(1.96+1.28)/ 0.3941] 2 +3
n =[3.24/0.3941]2 +3
n= (8.2194)2 +3
n=67.55+3
n=70.5
n=71
Minimum sample size n = 71
In this study we have to use the convenient sampling methods. We are collating data with help of records. Total 300 records studied.
Ethical issue: An Ethical clearance was taken from Institutional Ethical committee of Krishna Institute of Medical Sciences “Deemed to Be University”, Karad.
Statistical methods: Data were analyzed using Microsoft Excel. The results were expressed in terms of descriptive statistics and expressed in terms of the percentage. Significances of differences between variable was calculated.
Hypothesis:
H0: Biological age is same from Chronological age in Rural Population of Western Maharashtra.
H1: Biological age is differ significantly from Chronological age in Rural Population of Western Maharashtra (Table 1 and Figure 1).
| Parameters | Count | Percentage |
|---|---|---|
| Gender | ||
| Male | 147 | 49 |
| Female | 153 | 51 |
| Types of food taken | ||
| Mix (Veg /Non-veg) | 211 | 70.3 |
| Veg | 89 | 30.7 |
| Marital Status | ||
| Married | 152 | 54.7 |
| Unmarried | 149 | 49.3 |
| Total | 300 | - |
Table 1. Distribution of scio demographic variables.

Figure 1: Economical statues and age.
A total of 300 participant reported of in the study with the age range of 18 to 60 years. Table 1 presents the scio demographic characteristics of study participants. The distribution of selected variables such as gender, which types of food preferring, marital status respectively. None of the study participants reported history of smoking, smokeless tobacco use or alcohol at present or in the past.
The correlation between biological age and chronological age, BMI and Body Age it should be positive. It means, as chronological age increases than biological age also increases. We can’t say about correlation between BA and Systolic or Diastolic blood pressure (Table 2).
| Sr. No. | Correlation | Correlation r | P value |
|---|---|---|---|
| 1 | Biological age and Chronological age | 0.8487 | 0.0001 |
| 2 | BMI and Body Age | 0.5823 | 0.0001 |
| 3 | Biological age and Bold Sugar | 0.2787 | 0.0724nsq |
| 4 | Biological age and Systolic blood pressure | 0.4835 | 0.6294ns |
| 5 | Biological age and Diastolic blood pressure | 0.0691 | 0.4903ns |
Table 2. Correlation with clinical parameters. Note: ns–not significant; nsq–not quit significant.
According to WHO guide line BMI classified in five categories, Among 10.6% participants comes underweight, 13.6% participants comes in the normal category.27.3% participants comes class I obesity,34.3% participants Class II obesity 14.% overweight respectively (Table 3) [8].
| Cut of Levels | Frequency | Percentage | |
|---|---|---|---|
| Underweight | <18.5 kg/m2 | 32 | 10.6 |
| Normal weight | 18.5-24.9 kg/m2 | 41 | 13.6 |
| Class I obesity | 25.0-29.9 kg/m2 | 82 | 27.3 |
| Class II obesity overweight | 30.0-39.9 kg/m2 | 103 | 34.3 |
| Class III extreme obesity | 40 kg/m2 | 42 | 14 |
Table 3. Distribution of body mass index.
The fitted models
Chronological Age =0.389+ β1 Body mass index + β2RM_Cal+β3 Body fat + ε ……… [I]
Equation I we were comparing with equation II
Biological Age= 0.567+ β1Body mass index +β2RM_Cal +β3 Body fat+ ε……………… [II] (Table 4).
| Model | R | R Square | Adjusted R Square | Std. Error of the Estimate | Change Statistics | Durbin-Watson | ||||
|---|---|---|---|---|---|---|---|---|---|---|
| R Square Change | F Change | df1 | df2 | Sig. F Change | ||||||
| CA | 0.39 | 0.153 | 0.125 | 16.19 | 0.153 | 6.03 | 3 | 296 | 0.001 | 2.064 |
| BA | 0.57 | 0.32 | 0.381 | 14.0219 | 0.32 | 8.999 | 3 | 294 | 0.001 | 2.189 |
Table 4. Comparison of models.
We had observed that, there was auto correlation between the variable in Biological age Model as compare to the Chronological age Model. r2 value of the Biological age BA to be large as compare to the Chronological age Model CA. There was more variation in Biological age model .i.e. BMI, RM_Cal. Body fat were auto correlated with the Biological age.
A total 300 participates of data taken for the study. Collated data in the form of secondary sources. Selected data or record there was no scope of some variables such as, physical activity, habits, types of job, in come sours etc. or some other antroparamatric parameters. More than 70.3% of participates recommended for mix types for food taken in his rutting life.
In 2019 Mani G estimated statistics related to the adolescents. One-fifth of adolescents were overweight and a similar proportion had elevated blood pressure due to unhealthy dietary practices and sub-optimal physical activity [9].
Estimation of age of an individual’s has attained importance in forensic sciences [10]. It is legal proceedings and has been a recurrent demand from concerned authorities to find out whether the person in subject has reached the age of immutability and legal responsibility. The function of age estimation is not just limited to how much younger me as compare two others but also what about required situation of my body.
Peoples were not aware about the biological age. Here 48% Peoples already pass out the cut of biological age .i.e. biological age equals’ to the chronological age. Approximate 13.6% Peoples balancing his or her BA with the CA. Many peoples to be casual approach regarding to the controlling the biological age in rural area. Those group of peoples in overweight or obesity need to involving physical activities program me such as yoga, pranayam, ground game activity.
Acknowledgment
Authors are thankful to the team of KIMSDU, Karad to collating data. I am specially giving thanks to Dr. S.V. Kakade for supporting statistical knowledge, statistical analysis.
Funding sources: N.A.