Research & Reviews: Journal of Material Sciences
ISSN:2321-6212
ISSN:2321-6212
Zuhoor Elahi*
Department of Physics, University of Karachi, Karachi, Pakistan
Received: 10-Jun-2022, Manuscript No. JOMS-22-64667; Editor assigned: 13-Jun-2022, PreQC No. JOMS-22-64667(PQ); Reviewed: 27-Jun-2022, QC No. JOMS-22-64667; Revised: 05-Jul-2022, Manuscript No. JOMS-22-64667(R); Published: 13-Jul-2022, DOI: 10.4172/2321-6212.10.6.004.
Visit for more related articles at Research & Reviews: Journal of Material Sciences
A study of DC Arc plasma column during the preparation of carbon nanotubes is presented. Such study was planned to study the experimental parameters, which influence the formation of nano-structures. Excitation temperatures are measured by using the intensities of consecutive ionization states in the line spectrum. The dependence of excitation temperature on delay time is calculated and shown graphically. Electron densities are also calculated at different times in the arc plasma and are found to be decreasing exponentially as the plasma gets cool down. Carbon nanotubes that are formed during the arc are collected from the cathode in the form of soot and studied for morphology, composition, and structural properties. It is found that the nanotubes formed are of multiwalled nature.
DC ARC; Carbon nanotubes; Excitation temperature; Electron density
Nanotechnology has empowered the usage of nanoparticles with the size of under 100 nm in numerous applications. Researchers are consistently searching for innovative applications using nanoparticles. After the discovery of carbon nanotubes efforts have been committed to find effective methods for their synthesis [1]. However, there are usually not much publications in respect to the elementary methods that happen in the graphite arc in which these structures grow. The examination of graphite arc plasma is essential to understand the creation and the decay of carbon molecules in a high-temperature area, which can be associated with the formation of carbon nanostructures. The optical emission spectroscopy appeared to be remarkably appropriate technique for these sorts of studies. Some fairly qualitative outcomes on the characteristics of carbon plasma in the production of carbon nanostructures have just been published. It is notable that the development of carbon nanotubes in a DC/AC arc between graphite terminals happens in a chaotic environment which is not easy to control on such a small scale. Be that as it may, on the large scale one can predict distinctive strategies for affecting the arc discharge, e.g. by the pressure, input voltage/current control, distance between the electrodes, the diameters of the electrodes, or by changing condensation rates by various cooling techniques[1].
Carbon nanotubes can go about as a catalyst medium in a fuel cell and keeping away from the utilization of platinum which is much expensive, and most catalysts depend on. A few researchers have set up a strategy to develop integrated circuits utilizing carbon nanotubes [2]. Arc discharge was the first recognized procedure for producing Single-Walled Nano Tubes (SWNTs) [1,3] and Multi Walled Nano Tubes (MWNTs) [1,4].used the graphite bars in contact by applying an AC voltage in a noble gas environment to create Bucky balls, while in the DC arc the positive anode is sublimated and creates fullerenes[5] as ash in the chamber, and a small amount of the positive electrode is dissipated and stored on the negative electrode in the form of powder. In that cathode deposit, Iijima, in the year 1991, first observed the carbon nanotubes [1]. The yield for this approach is dependent upon 30% by weight. In this approach both SWNTs and MWNTs are formed with their lengths up to 50 micrometres [6].
Experimental work
A small stainless-steel vacuum chamber is used for the formation of DC arc between the graphite electrodes. During the arc carbon nanotubes are formed. The deposition chamber consists of four major components; (1) the chamber, (2) sample holders, (3) optical window, (4) and Vacuum system. The temperature of the electrodes can be adjusted for different values of currents as it is an important factor which the properties of produced nanoparticles depend on. Optical studies of the arc during the formation of carbon nanotubes are carried out by Avantes spectrometer. Spectra are recorded during the arc by using the spectrometer setup which consists of a spectrometer attached through an optical fibre cable to a computer, and on the other side to the deposition chamber. The obtained spectra can be analysed to find temperature, density, etc. of the synthesized nanostructures. The nanostructures formed there are then also studied for their morphological, elemental and structural properties.
Characterization
The observed values of intensities are used to calculate excitation temperature and densities within plasma. The intensities of two lines as a function of delay time. Excitation temperatures and densities are found by using the Boltzmann plot method and Saha-Eggert equation respectively. Morphological, elemental, and structural studies are carried out by using SEM, EDX, and XRD techniques Figure 1.

Figure 1: The intensities of two spectral lines in emission spectrum of arc are plotted against time delay. 
Excitation temperature measurement: The excitation temperatures are usually calculated with the help of relative intensities of the spectral lines in the emission spectrum using the Boltzmann equation given below [7]:
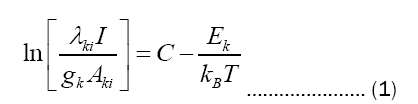
The values Aki, gk, and Ek are obtained from the website of NIST database.
The excitation temperatures in the plasma arc can be found by using spectral lines in the emission spectrum of carbon. The Boltzmann function  for different lines is calculated and plotted against the upper level energy Ek as shown in the Figure 2 and listed in the Table 1. The plot of Boltzmann function versus energy of upper level yields straight lines. The slopes (S) of these lines are
  assuming that there is a Boltzmann distribution in the populations. We can write:
| Wavelength λ | Ek | gk | Aki | λki/gkAki | ln[λkiI/gkAki] | ||||
|---|---|---|---|---|---|---|---|---|---|
| (nm) | (eV) | × 107 /cm | × 1014 | at 0 ms | at 1 ms | at 2 ms | at 3 ms | at 4 ms | |
| 601.484 | 10.7 | 3 | 0.16 | 0.125 | 23.89 | 24.16 | 24.61 | 24.88 | 25.49 |
| 657.805 | 16.33 | 4 | 3.67 | 44.81 | 26.34 | 26.87 | 27.39 | 28.26 | 29.21 |
| 833.515 | 9.17 | 1 | 3.51 | 2.375 | 23.21 | 23.54 | 23.84 | 24.22 | 24.56 |
Table 1. The values of the transition probabilities, and the energies of upper levels for the carbon lines taken from the NIST database.

Figure 2: Boltzmann function  is plotted against the upper level energy (in eV). Note:
 at 1 ms,
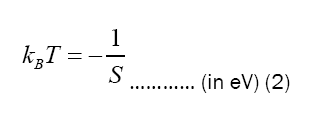
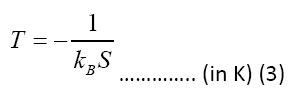
Table 2 shows the electrons temperatures obtained from the slopes of the straight lines of Figure 2. The measured values of excitation temperatures are plotted as function of delay time in the Figure 3.

Figure 3: The excitation temperature calculated from the Boltzmann plot of Figure are plotted as function of time delay.Note: 
| Time delay | Slope, S | kBT=-1/S | T |
|---|---|---|---|
| (ms) | (eV)-1 | (eV) | (K) |
| 1 | -0.437 | 2.288 | 26549.913 |
| 2 | -0.469 | 2.132 | 24744.066 |
| 3 | -0.495 | 2.022 | 23468.083 |
| 4 | -0.574 | 1.741 | 20203.633 |
| 5 | -0.653 | 1.532 | 17777.216 |
Table 2. The temperature measurement by the slopes of the Boltzmann plots of Figure
Electron density measurement: Saha-Eggert relationship is used to determine the electron densities within plasma. The relative intensities of the neutral atomic lines and the singly charged ionic lines of carbon are used in this equation.
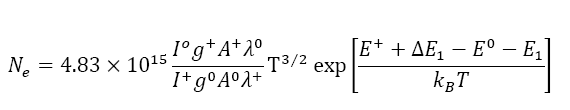
Figure 4 shows the plot of estimated values of electron densities versus delay time. The electron densities are also plotted against excitation temperatures in the Figure 5.

Figure 4: Electron density of plasma arc as calculated from the Saha-Eggert equation is plotted against the delay time. Note:

Figure 5: Dependence of the electron density on the excitation temperature. Note:
Figures 4 and 5 show that the dependence of electron density on both the delay time, and excitation temperature is exponential.
Morphology: The synthesized carbon nanotubes are analyzed for surface morphology by using the SEM images. The SEM images of the samples are shown in the Figure 6 at different magnifications. Junks of carbon nanotubes can be seen in the Figure 6. It can also be seen that nanotubes formed are of large lengths and very small diameters.

Figure 6: SEM images of the samples at different magnifications showing nanotubes formed during the arc discharge. (a) at 40,000X, (b) at 30,000X.
Composition: The elemental analysis of the samples is carried out by taking EDX spectrum. Figure 7 shows the EDX spectrum of a sample. Purity index of the carbon nanotubes is clear in the spectrum. There are three peaks in the spectrum. The most intense peak appeared at ~3 eV confirms that there are only carbon atoms present in the samples. The carbon is about 71% by weight and oxygen. It also proves the high purity of the graphite rods that are used as the electrodes with the DC power supply for producing DC arc. The second peak is relatively very small which shows the presence of oxygen atoms in the samples. This is since the experiment is done in the air atmosphere. The third peak is of gold, which is since the samples are electroplated with, for the SEM studies.

Figure 7: EDX spectrum of the sample.
Crystal structure: The XRD pattern of the sample is shown in the Figure 8 below. The diffraction peaks appeared in the XRD spectrum match very well with literature patterns. The most intense and the sharp reflection peak (002) appeared at 26.4° indicates the concentric cylindrical nature of graphene sheets nested together and that the nanotubes are multiwalled in nature [8,9].

Figure 8: XRD pattern of carbon nanotubes in which the intense peak at 26.40 shows the 002 reflection of the multiwalled carbon nanotubes. The other peaks at 42.40, 44.550, and 550 correspond to the 100, 101, and 004 reflections of the carbon atoms.
The presence of the peaks at 42.4° and 55° corresponding to the 100 reflection [10] and 004 reflection of carbon atoms respectively are also in good agreement with the literature [10,11].
Lattice constant : Lattice constants for different peaks are calculated by using the formula:
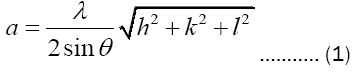
Average value of the lattice constants for the planes is found to be 6.602 Å.
Plane Spacing: The planes spacings d for all peaks are calculated by using the Bragg’s law:
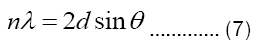
The calculated values of ‘d’ are listed in the Table 3. The most intense peak appeared at 26.4° in the XRD pattern confirms the presence of carbon nanotubes, and the plane of this peak is named as 002 in the literature [8,12,13]. The plane spacing at this peak is found to be 3.373 Å, which is alsao well matched with the literature for multi-walled carbon nanotubes (Tables 3 and 4) [14].
| Element | (keV) | mass% | Error% | At% | K |
|---|---|---|---|---|---|
| C K | 0.277 | 68.64 | 1 | 74.46 | 76.56 |
| O K | 0.525 | 31.36 | 8.15 | 25.54 | 23.43 |
| Total | 100 | 100 |
Table 3. The quantitative analysis: Fitting Coefficient: 0.9165.
| S.No. | 2θ | Intensity (I) | I / I0 | d-value |
|---|---|---|---|---|
| (deg) | (au) | % | (A°) | |
| 1 | 26.4 | 12278 | 100 | 3.373 |
| 2 | 38.25 | 540 | 4 | 2.352 |
| 3 | 42.4 | 345 | 3 | 2.13 |
| 4 | 44.55 | 655 | 5 | 2.032 |
| 5 | 64.9 | 641 | 5 | 1.436 |
| 6 | 69.3 | 236 | 2 | 1.355 |
Table 4. Planes spacing for different peaks in XRD data of the carbon nanotubes are calculated by using the Bragg’s law.
During the evaporation of graphite rods, a portion of the positive electrode is consumed. The rate of reduction in length of anode is measured to be 2 mm/s. Excitation temperatures are measured to be in the range of 20,000 to 30,000 kelvin that are in good agreement with reported values [15-19]. The electron densities in the arc plasma are measuring to be of the order of × 1024 particles. In Figure 4, the electron densities are falling exponentially with time which in turn implies that the electron densities are decreasing exponentially with the decrease in temperature within the plasma. The SEM images show that most of the particles have diameters ranging from approximately 5 to 30 nanometers, and their lengths are of the order of hundreds of nanometers.
The EDX spectrum of the samples show the purity index of carbon in the prepared samples, which is found to be ~ 71 weight% (Figure 7). The second peak is of oxygen which is since all the experiments are done in open air at atmospheric pressure. The third peak, which is not labeled, is of gold, because the samples are electroplated with gold for the SEM/ EDX analysis. The average value of the lattice constant is found to be 6.602 Å. The plane’s spacing for 002 peaks is calculated to be 3.373 Å by using Bragg’s law [20-26].
Also, the results are well matched with the literature patterns, according to which it is reported that the prepared nanostructures are multiwalled in nature [8].
In this report, I have tried to show some of the versatile capabilities of the small deposition chamber as a DC arc system for the study of plasma during the processing of nanostructures. Multiwalled carbon nanotubes are successfully synthesized by this experimental setup. The excitation temperature and the density within the plasma are successfully calculated the Boltzmann plots and the Saha-Eggert relationship respectively. I have modified the system to control the temperature using water cooling and a thermostat to enhance its performance for a variety of depositions. This system is very flexible that allows deposition of various materials with a very less mechanical job and in very short span of time (within 30 minutes if working at room temperature). The viewing window is positioned vertically to the plasma column, making the setup very appropriate to scan the plasma for spectroscopic studies. In conclusion, such setup is very useful to find quick results as far as research is concerned.
[Crossref] [Google Scholar] [Pubmed]
[Crossref] [Google Scholar] [Pubmed]