ISSN ONLINE(2278-8875) PRINT (2320-3765)
ISSN ONLINE(2278-8875) PRINT (2320-3765)
Biswajit Pathak1, Debajyoti Barooah2
|
| Related article at Pubmed, Scholar Google |
Visit for more related articles at International Journal of Advanced Research in Electrical, Electronics and Instrumentation Engineering
Texture is literally defined as consistency of a substance or a surface. Technically, it is the pattern of information or arrangement of structure found in an image. Texture is a crucial characteristic of many image type and textural features have a plethora of application viz., image processing, remote sensing, content-based imaged retrieval and so on. There are various ways of extracting these features and the most common way is by using a gray-level cooccurrence matrix (GLCM). GLCM contains second order statistical information of neighbouring pixels of an image. In the present work, a detailed study on a sample image (8 bit gray scale image) pattern is carried out with an aim to develop a methodology that acts as a non destructive and contactless way of describing the surface texture. The study involves the use of a contemporary method, known as absolute value of differences (AVD) when the information of the image is not present in higher frequency domain. The simulated results show that AVD can be used as an alternative to the classical inertia of moment (IM) computing and directions do matter while GLCM processing on image pattern. Moreover it is shown that Sobel edge-detector operator along with GLCM may be used to predict the surface texture quantitatively.
Keywords |
| Gray-Level Co-occurrence Matrix, Moment of Inertia, Absolute Value of Differences, Sobel-Operator |
INTRODUCTION |
| Texture is a property that represents the surface and structure of an image or it can be defined as a regular repetition of an element or pattern on a surface. Textures of an image are complex visual patterns that are composed of entities or regions with sub-patterns with the characteristics of brightness, color, shape, size, etc. A constant texture in an image represents a set of its characteristics that are constant, gradually changing or approximately periodic [1]. Also, it may be regarded as a similarity grouping in an image [2]. Texture analysis characterizes the spatial variation of image pattern based on some mathematical procedures and models to extract information from it. One of the earliest methods used for texture feature extraction was proposed by Haralick et al. back in 1973 [3], known as Gray-Level Cooccurrence Matrix (GLCM) and since then it has been widely used in many texture analysis applications. |
| Statistical methods may be used to analyze the spatial distribution of gray values by computing local features at each point in the image because spatial distribution of gray values is one of the defining qualities of texture. Statistical methods may be further classified into first-order (one pixel), second-order (two pixels), etc depending on the number of pixels defining the local feature of an image [4]. GLCM estimates image properties related to second-order statistics which considers the relationship among pixels or groups of pixels (usually two). A simple one-dimensional histogram may not be useful in characterizing texture features as it is a spatial property. Hence, this two-dimensional GLCM matrix is extensively used in texture analysis and is briefly discussed here. |
| In this paper, we have shown the construction of GLCM matrix along various possible directions and how to calculate statistics like IM and AVD using it. We have also commented about the preferred direction of GLCM processing and the importance of AVD when the pixel information is present in lower frequency side. Further, we showed that the use of an edge-detector operator together with the GLCM helps to quantify the surface texture of an image. |
THEORETICAL APPROACH |
A. Gray-Level Co-occurrence Matrix |
| The GLCM, which is a square matrix can reveal certain properties about the spatial distribution of the gray-levels in the texture image. It was defined by Haralick et al. in 1973 [3]. It shows how often a pixel value known as the reference pixel with the intensity value i occurs in a specific relationship to a pixel value known as the neighbour pixel with the intensity value j. So, each element (i,j) of the matrix is the number of occurrences of the pair of pixel with value i and a pixel with value j which are at a distance d relative to each other. The spatial relationship between two neighboring pixels can be specified in many ways with different offsets and angles, the default one being between a pixel and its immediate neighbor to its right. In the present work, four possible spatial relationships (00; 450; 900 and 1350) were specified and implemented. |
| Mathematically, for a given image I of size K×K, the elements of a G×G gray-level co-occurrence matrix MCO for a displacement vector d(= dx, dy) is defined as |
 |
| Fig. 1 illustrates the details of the process to generate four symmetrical co-occurrence matrices considering a 4×4 image represented with four gray-tone values from 0 to 3. For the purpose we considered one neighboring pixel (d=1) along four possible directions as {[0 1] for 00; [-1 1] for 450; [-1 0] for 900 and [-1 -1] for 1350]}. |
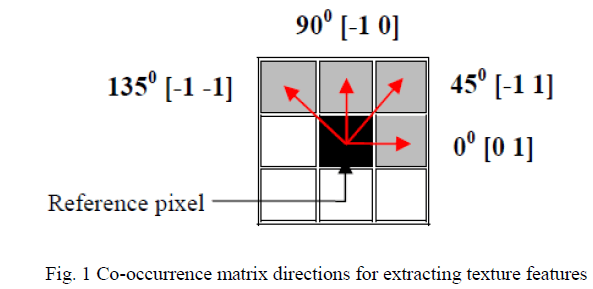 |
| Each element of the GLCM is the number of times that two pixels with gray tone i and j are neighbourhood in distance d and direction θ. For 00 co-occurrence matrix, there are 2 occurrences of the pixel intensity value 1 and pixel intensity value 3 adjacent to each other in the input image. Also, the occurrence of pixel intensity value 3 and pixel intensity value 1 adjacent to each other is 2 times. Hence, these matrices are symmetric in nature and the co-occurring pairs obtained by choosing θ equal to 0° would be similar to those obtained by choosing θ equal to 180°. This concept extends to 45°, 90° and 135° as well [5]. With all these considerations, the GLCM matrix is calculated for each of the four possible angles and shown in Fig. 2 below. |
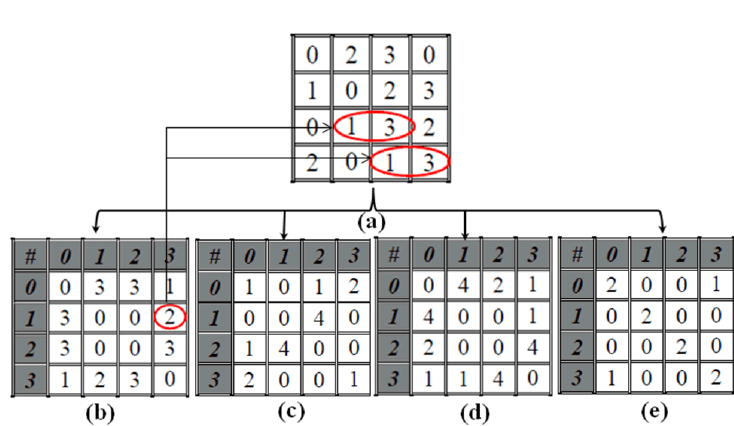 |
| Fig. 2 GLCM construction based on a (a) test image along four possible directions (b) 0° (c) 45° (d) 9°° and (e) 135° with a distance d =1. Here # represents the number of times |
B. Statistics Computation |
| Haralick et al. introduced 14 statistical features which are generated by calculating the co-occurrence matrix for different directions. These matrices are usually used to characterize textures in an image as it contains information about the image such as homogeneity, contrast, energy, entropy, etc. In the spatial case, its principal diagonal is related to homogeneous regions and the non-zero elements far from it represents high contrast occurrences. Here, we discuss and implement only one of the second-order statistical features known as contrast or inertia of moment (IM) based on the GLCM. Also, one of the recently developed first order statistical moment known as absolute value of differences (AVD) is implemented to show its usefulness [6]. |
1) Inertia of Moment (IM) of the COM |
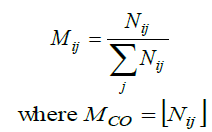
| The IM or the contrast of the co-occurrence matrix is a usual texture descriptor that has been used as a measure of intensity contrast between a pixel and its neighbor over the entire image. This is a second-order moment with respect to the diagonal in a particular direction. In order to obtain a quantitative measure from this matrix, it is necessary first to normalize it. This is done by dividing each row of the matrix by the number of times that the first gray-level appeared. The sum of the components then equals to |
 |
| A measurement of the spread of the Mij values around the principal diagonal can be constructed as the sum of the cooccurrence matrix values times its squared distance (here column) to the principal diagonal. This is obtained in such a way that low variations of pixel intensity will add low values to the final IM value, while high variations will contribute more to the IM value to quantify it as given by the following equation |
 |
2) Absolute Value of Differences (AVD) of the COM |
| AVD is a first order statistic moment, which is implemented in this work as an alternative to the routine IM computing on image processing. It measures the amount of local variations present in the image based on the principle that the sum of the co-occurrence matrix values times its difference distance is the main information searched, as the square operation carried out in the IM method can amplify the variations in the pixel values in a distorted way. |
 |
EDGE DETECTION |
| Edge detection refers to the process of identifying and locating sharp discontinuities in an image. The discontinuities are abrupt changes in pixel intensity which characterize boundaries of objects in a scene. There are an extremely large number of edge detection operators available (Sobel [7], Prewitt [8], Roberts [9]), each designed to be sensitive to certain types of edges. The edge detection has been used for object recognition, target tracking, segmentation etc. Therefore, the edge detection is one of the most important parts of image processing. These methods have been proposed for detecting transitions in images. Commonly used method for detecting edges is to apply derivative operators on images. In this work, Sobel which is an edge detection method is considered [10]. |
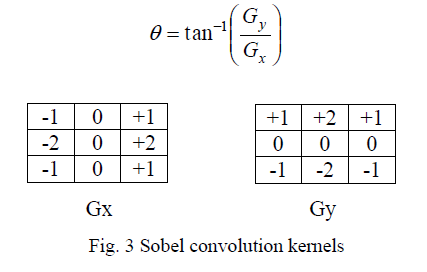
| The Sobel operator consists of a pair of 3×3 convolution kernels as shown in Fig. 3. One kernel is simply the other rotated by 90°. These kernels are designed to respond maximally to edges running vertically and horizontally relative to the pixel grid, one kernel for each of the two perpendicular orientations. The kernels can be applied separately to the input image, to produce separate measurements of the gradient component in each orientation (detector uses two convolution kernels, one to detect changes in vertical contrast (Gx) and another to detect horizontal contrast (Gy). These can then be combined together to find the absolute magnitude of the gradient at each point and the orientation of that gradient [11]. The gradient magnitude is given by: |
 |
| The angle of orientation of the edge relative to the pixel grid giving rise to the spatial gradient is given by |
 |
SIMULATION RESULTS AND DISCUSSIONS |
| The GLCM is analysed on the sample image (8 bit gray scale image having a dimension of 64×64 with gray scale values ranging from 0 to 255. This is the image of the Ashoka Chakra present in the National Emblem of a one rupee Indian coin captured with a Basler A631f camera) along four possible directions (θ= 00; 450; 900 and 1350) with an offset of 1. |
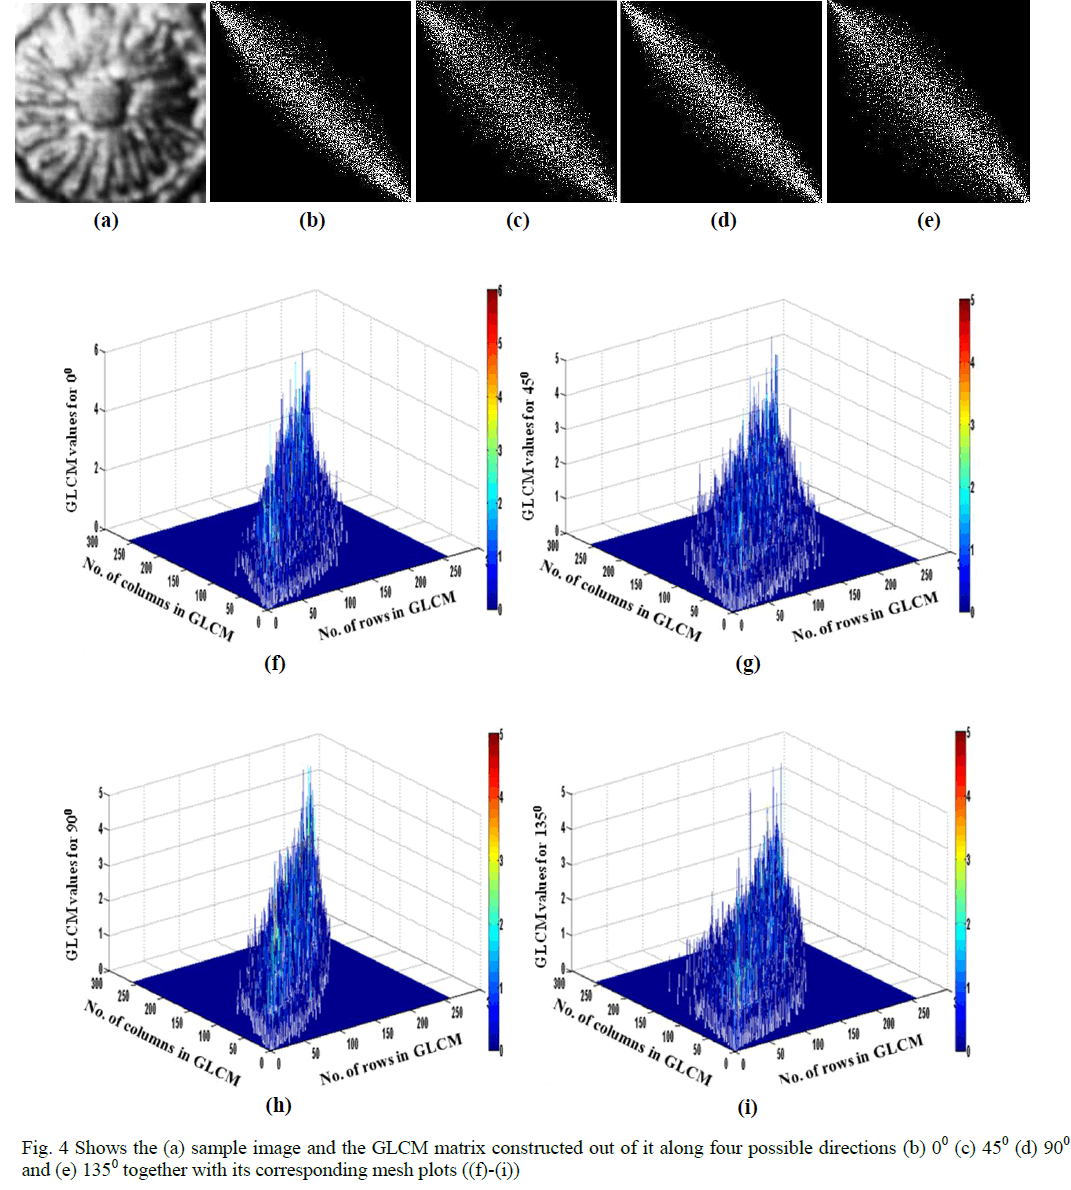 |
| The co-occurrence matrix plots obtained are shown in Fig. 4 (b-e). The corresponding mesh plots for the aforementioned directions are illustrated in Fig. 4 (f-i) to have a better view of the spreading of the co-occurrence matrix from its principal diagonal. It is obvious from the above figures that whenever a high variation between two adjacent pixel values is present, it produces high values far away from the principal diagonal of the matrix whereas in a low variation, only appreciable values of the matrix appear near to the diagonal. Here, 900 analysis of the GLCM shows lower spreading in comparison to other orientations. |
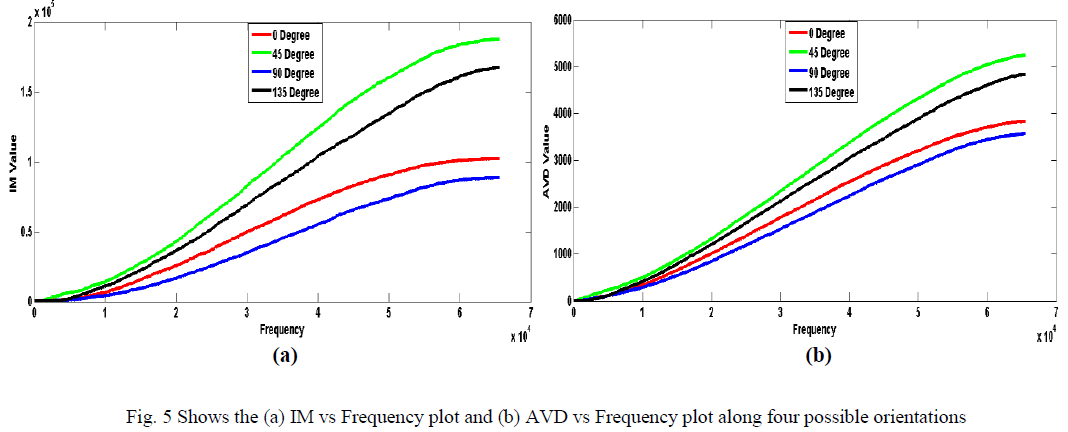 |
| The graph in Fig. 5(a) and Fig. 5(b) shows IM versus frequency and AVD versus frequency plot wherein all the four possible directions are taken into considerations. These first-order and second-order statistics measure the spatial frequencies of an image. Here, it is clear that among the four possible directions, 00 and 900 shows comparable result and can be used for GLCM processing. However, 900 is the more preferred one. It is also evident that AVD is more effective and may be used as an alternative to IM calculation when the pixel information is present in the lower frequency domain as IM may amplify the variations of pixel values in the image and subsequently distort the results. |
 |
| Fig. 6 Shows the (a) edge enhanced image obtained using Sobel operator on the sample image, which on further application gives image (b) and its corresponding co-occurrence matrices are illustrated in (c)-(d). |
| On implementing the Sobel edge-detector operator on the original sample image (Fig. 4(a)) by emphasizing on horizontal edges using the smoothing effect and approximating a vertical gradient, we obtained Fig. 6 (a). To detect the edges prominently or in other words, to make higher variation between adjacent pixels, Sobel operator is implemented again on Fig. 6(a) to give Fig. 6(b). Further, Fig. 6(a) and Fig. 6(b) are processed using GLCM considering 900 as the preferred direction. This results in Fig. 6(c) and Fig. 6(d), wherein Fig. 6(c) corresponds to Fig. 6(a) and Fig. 6(d) corresponds to Fig. 6(b). The above results, clearly demonstrate that for a surface with more peaks and valleys or ups and downs (high variations in pixel intensity values), co-occurrence matrix will show more spreading from the principal diagonal of the matrix. Whereas, with a smooth surface having lesser peaks and valleys (low variations in pixel intensity values) will result in lesser spreading from principal diagonal of the matrix. |
CONCLUSION |
| From the present work, it can be concluded that distance (d) and direction (θ) parameters are important for construction of co-occurrence matrix. Although we simulated the above results with d =1 and d =2 but presented the results only for d =1 as it shows comparatively better results than d =2. This conclusion is justified, as a pixel is more likely to be correlated to a closely located pixel than the one located far away. θ = (00 and 900) show comparable results for GLCM processing with 900 showing lesser spreading from the principal diagonal of the GLCM and may be considered as one of the preferred directions. Further, we showed that the first-order statistic moment, AVD could be used as a reliable alternative to IM computing in image processing, mainly when information of pixel values is not present in high frequencies. In addition, we may conclude that the use of Sobel edge-detector operator together with GLCM prove to be an effective method to quantify the surface texture of an image. |
ACKNOWLEDGMENT |
| The authors would like to offer their utmost gratitude to Dr. Bosanta R. Boruah for providing the sample image used in analysis and Mr. B. Pathak would also like to acknowledge IIT Guwahati for the hospitality rendered by the latter. |
References |
|