ISSN ONLINE(2278-8875) PRINT (2320-3765)
ISSN ONLINE(2278-8875) PRINT (2320-3765)
L.Devi, C.H. Saibabu, S.Sivanagaraju
|
| Related article at Pubmed, Scholar Google |
Visit for more related articles at International Journal of Advanced Research in Electrical, Electronics and Instrumentation Engineering
The effect of tapping station on interconnected AC/DC transmission system is presented in this paper. Reliability values of AC and bipolar VSC-HVDC transmission systems are developed by using Markov modelling. The reliability indices are evaluated by DC line without tapping station and with tapping station. Reliability models of bipolar VSC-HVDC and AC systems are developed. A contingency enumeration technique with equivalent approach is used to determine the reliability indices.
Keywords |
| Tapping station, VSC-HVDC, reliability indices, enumeration technique. |
INTRODUCTION |
| Operation of DC links in parallel with AC lines has economical and technical advantages of supplying intermediate loads located between the sending and receiving ends through the AC facilities[1]. The first step in calculating the reliability of HVDC transmission systems by developing the appropriate models for all the components in the system[3,5] . The reliability model of DC line and AC lines are combined by a contingency is defined as a combination of generating unit and transmission line outages [ 2 ]. This paper examines the effect of tapping station on interconnected AC/DC line. A wide range of reliability indices are calculated at load level without and with tapping station on DC link. |
TEST SYSTEM |
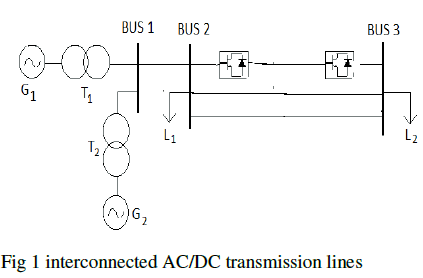
| The system used for investigations described in the paper as shown in Fig 1. It consists two load points L1 and L2 connected by a AC/DC transmission lines each load point with different peak load values [7]. |
 |
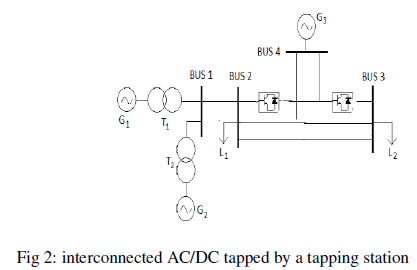 |
| Fig 2 shows the interconnected AC/DC transmission system tapped by a VSC tapping station represented by G3. In this paper comparing the reliability indices of Fig 1 and Fig 2 and the effect of tapping station on interconnected system is investigated. |
METHODOLOGY |
| In this paper the basic Markov modelling approach is used to take account the distribution of component failure over time. It is possible to compute the reliability parameters as the long term probability of the system being in a given state by solving a linear differential equations of the system. The graphical model constructed to display all possible transition paths between states is called state space diagram[ 6]. |
| A Markov model can be applied to systems whose random behaviour varies either discretely or continuously with time. In this paper Markov modelling has been adapted. fig 3 shows a basic example of two state system. |
 |
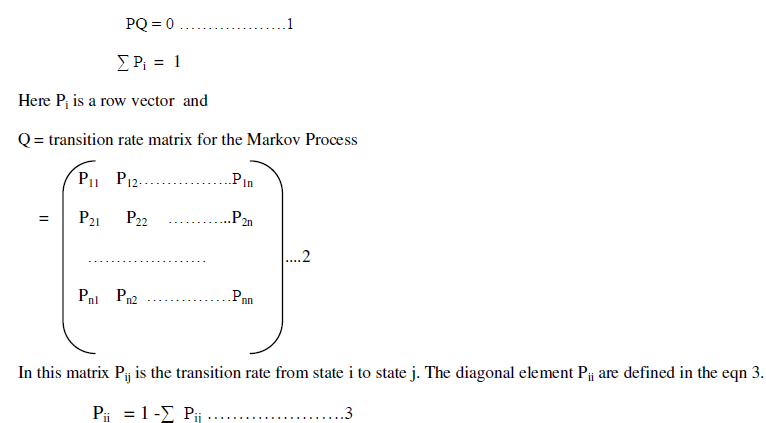
| In Fig 3 there are two states up state (state 1) and down state (state 2). There are two transitions associated with each component, the first L representing the failure process and the second M representing the repair process [10,11]. This model implies that the component becomes operational and in service immediately following the repair acting. The duration of the failure is limited to the time it takes to install the spare unit rather than to repair of the equipment itself.In this paper, only the equations for calculating the steady state solution of the system are presented. This solution gives the probability of being in a certain state after an infinite time in the system. It can be shown that this steady state solution can be found by solving the eqn 1. |
 |
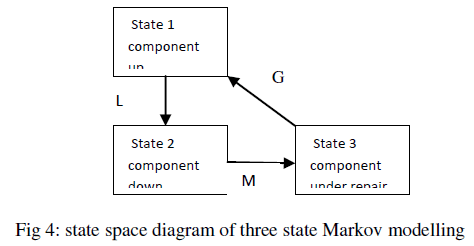
| Consider the half capcity states or repair process of the component another one more state is included to the state model Fig 3 is converted into three state model as shown in Fig 4. In Fig 4 State 3 is known as repairable state. |
 |
COMPONENT RELIABILITY MODEL |
| availability and reliability of any system depending upon the Performance of each component within the system. The failure rate and repair time of individual components are therefore essential parameters in evaluated the system reliability [5].Using Markov modelling the reliability values of each component of the system is evaluated. The reliability models associated with some of the components of Fig 1 are illustrated in the following section [9 ]. |
A Generating unit model |
| All the generating units are represented by two or three states. Fig 3 shows a state model of generating unit in which state 1 is the operating state with a maximum capacity available or in the down state 2 with a zero capacity. Large modern generating plants consists large quantity of auxiliary equipment. In Such a case failure of any one does not completely shutdown, it can operated at a reduced output level. This concept is known as a partial output state or reduced state of a unit. |
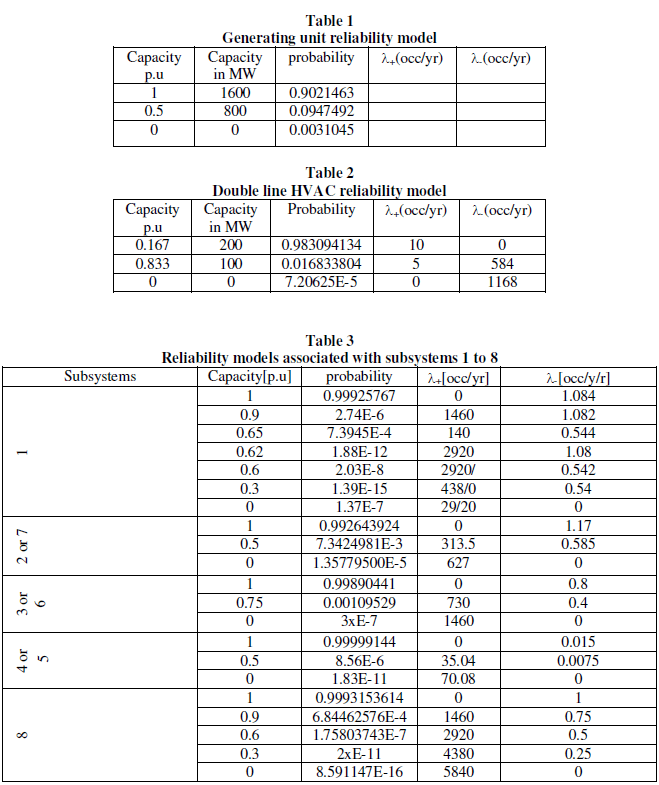
| The modified generating unit three state model is as shown in the Fig 4. State 1 is maximum capacity level, state 2 is half capacity level, state 3 is a zero capacity level. The reliability model of generating unit capacity outage table is as shown in the table 1. |
B Transmission lines |
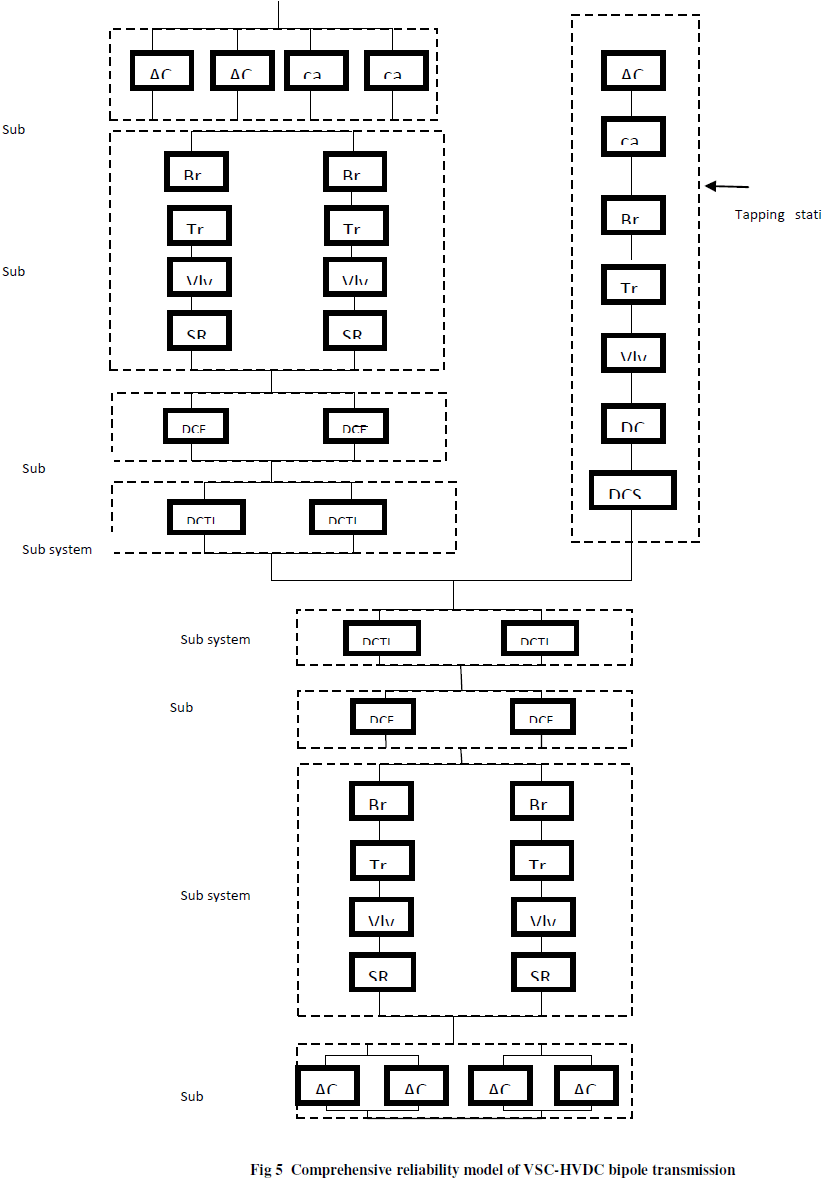
| AC transmission lines and the transformers are represented by a two state model as shown in the fig 3. The capacity outage table of two line AC transmission system is as shown in table 2 The reliability model associated with voltage source converter HVDC transmission system is as shown in the Fig 5. In Fig 5 AC side of the rectifier each pole has a capacitor (Cap) and bank of filters (ACFs) these elements are placed in parallel and associated reliability model is as shown in table 3. The AC side inverter consists four banks of AC filters, placed in parallel in the model. The associated capacities of four ACFs are as shown in table 3. Each pole of HVDC consists smoothing reactor (SR), Breakers (Brk), Transformers (Trns) and Valves (Vlvs). Two poles are placed in parallel in the model [ ] . The forced outage data associated with the reliability model of HVDC is shown in Fig 5 are given in APPENDEX-B. Using the given data the capacities associated with the bipolar DC link is as shown in table 3. |
C Tapping station |
| The components of the tapping station consists VlVs, Brk, Trn, ACFs, DCFs, and DCSW. The schematic diagram of tapping station is as shown in the Fig 6. And the corresponding reliability model of tapping station is shown in the Fig 7 [12]. |
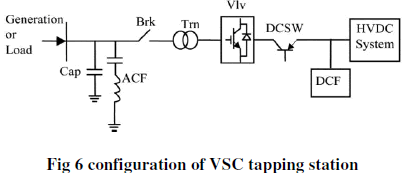 |
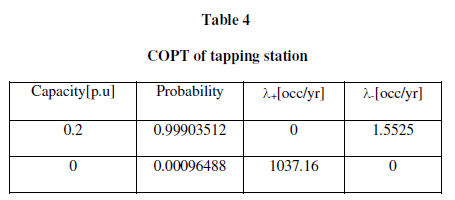
| Tapping station has series connected components, since a failure of any one of these components results in the failure of the entire tapping station, the reliability model is composed of series blocks, as shown in Fig 7. reliability model of tapping station is as shown in table 4 [ 13 ]. |
 |
ANALYSIS AND PROCEDURE |
| Reliability values of each component of AC and DC lines are evaluated by Markov modelling two state or three state models. For components which has large repair time such as converter, converter transformers and reactors are considered three states as shown in fig 5. Each reliability model of HVDC table 3 are cumulated one by one by contingency enumeration technique to get the final COPT of the HVDC .The test system consists two areas A and B interconnected through two AC lines and bipolar DC line[8]. The reliability indices are calculated by using contingency enumeration technique. The number of contingencies increases, as the number of components in the system are increased. One way to reduce the computation time and to consider more possible cases is to use a reduction technique to determine the equivalent model for each area up to load points 1 and 2 equivalent model at bus 3 is determined by combining the generating unit and transmission lines both AC and DC units. |
DESCRIPTION OF TABLES |
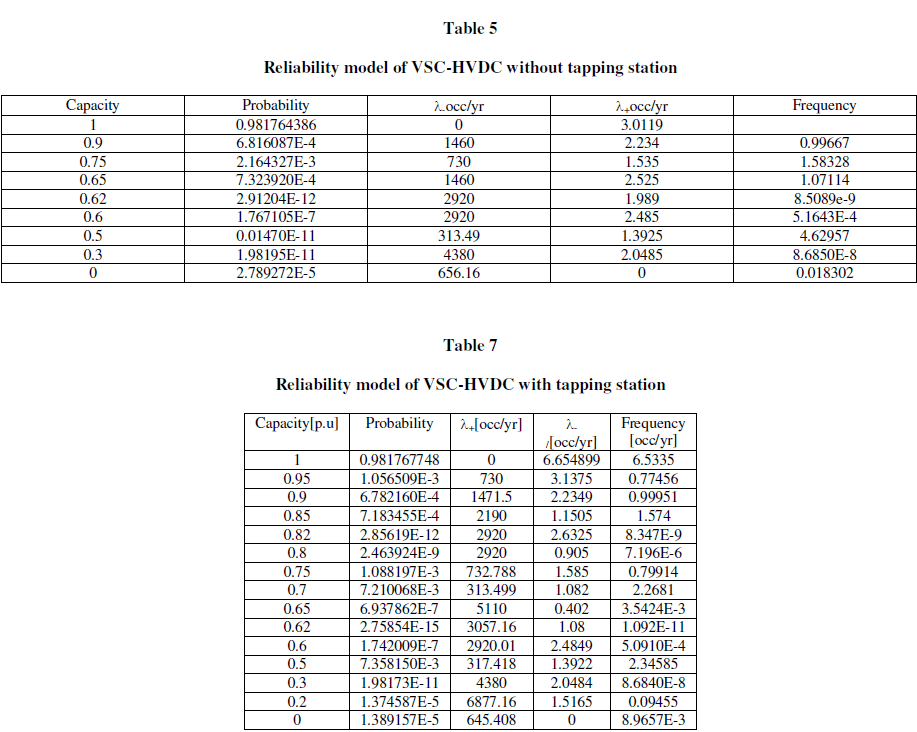
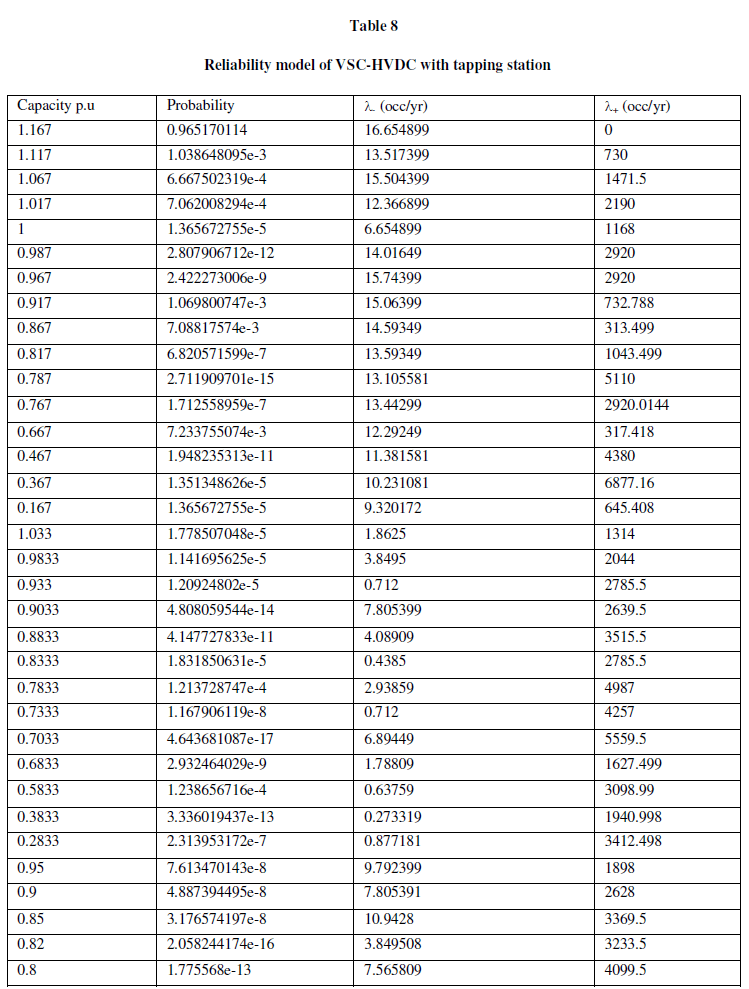
| In first step combine the reliability models of two parallel AC line ( table 2 ) with the DC link without tapping station is as shown in table 5 obtained equivalent model obtained model is as shown in table 6. In second step combine equivalent model of table 2 with the reliability model of DC link with tapping station as shown in table 7 obtained final COPT is as shown in table 8. Comparing the tables 6 and table 8 reliability indices are evaluated at 0.8p.u load level by using cumulative probability approach. Comparison between the reliability indices of interconnected system without and with tapping station is as shown in table 9. |
 |
 |
 |
 |
EVALUATION PROCEDURE |
| In base case system transferring capacity of two parallel connected HVAC is 200MW capacity is considered as 0.167p.u and VSCHVDC bipole link capacity 1200MW is taken as 1p.u base case. Generating power 1600MW as 1.167p.u, with load levels L1 with 200MW (0.167p.u) and L2 with 960MW(0.8p.u)[ ]. Combining the reliability models of transmission line table 2 and VSC-HVDC bipole link model table 5 obtained equivalent model is as shown in table 6. In equivalent model first condition is the case in which all the components in the system are operating is considered as 1p.u. The same transferring capacity of the each line is combined as equivalent capacity level. Example o.5p.u capacity of generating state is combined with 0.5p.u capacity of line state. Reliability indices at load point L2 at 0.8p.u are calculated from table 6 by adding the states below 0.8p.u capacity. From table 6 |
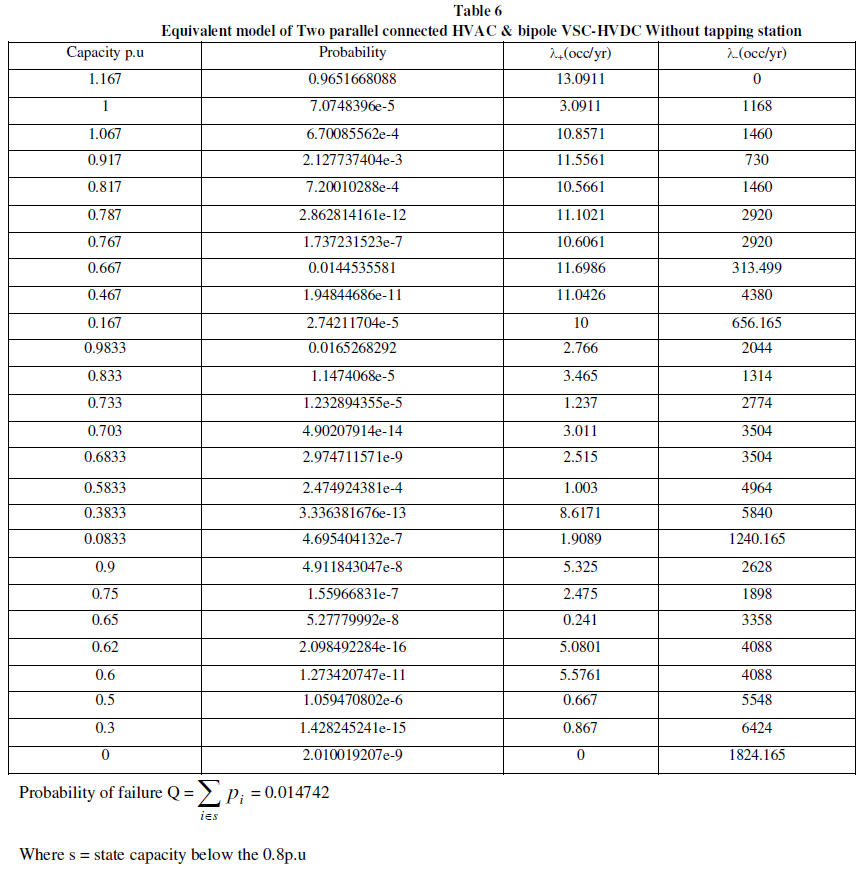 |
| Similarly frequency of failure is evaluated by cumulating the individual frequency failure of each state from 0p.u to 0.75p.u.of table 4.17. |
 |
 |
| Expected load curtailment is obtained by cumulating the product of individual frequency per failure of each capacity with load curtailment at that state. |
 |
 |
 |
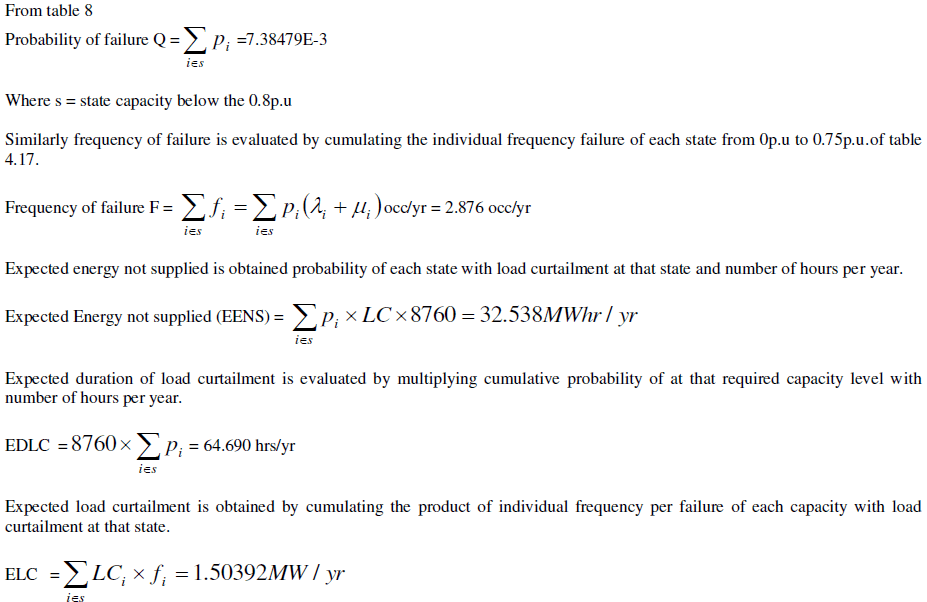 |
| Similarly combing the table 7.3 with reliability model of HVDC with tapping station, table 7.7 obtained equivalent reliability model is represented by table 7.8. Reliability indices at load point L2 are calculated from the table 7.8. |
RESULTS AND DISCUSSION |
| Due to generating unit deficiency or fault in any DC line does not meet the load demand at load point L2. Due to fault in any AC line or two AC lines will not affect the load demand at the load point L1. In such a case DC bipole transmission system is tapped by a tapping station with 0.2p.u capacity value, which will compensate the load curtailment at the load point L2 and meet the load demand. |
 |
| From the results table 9 probability of failure is reduced from 0.014742 to 7.38479E-3 with % reduced by installation of tapping station on AC/DC interconnected system. Similarly frequency of failure is 5.98869occ/yr to 2.8769occ/yr with reduced percentage of % , expected duration of load curtailment from 129.319MW/hr to 64.690MW/hr with %. Expected energy is not supplied from 64.865MWhr/yr to 32.538MWhr/yr with %. Expected load curtailment is 3.10096hrs/yr to 1.5092hrs/yr with % are reduced by installation of tapping station on interconnected AC/DC transmission system. Comparing the reliability indices of two cases of table 9 all indices are reduced by 50% by provision tapping station on of DC link of interconnected AC/DC transmission system. Hence provision of DC link with tapping station improves the reliability indices. |
 |
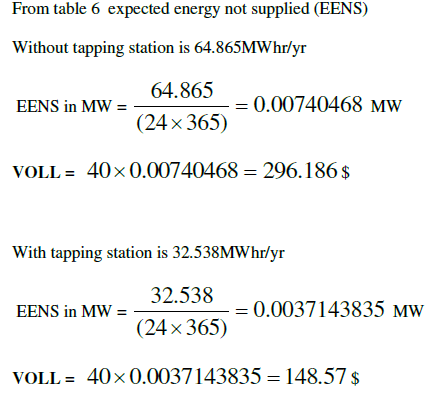 |
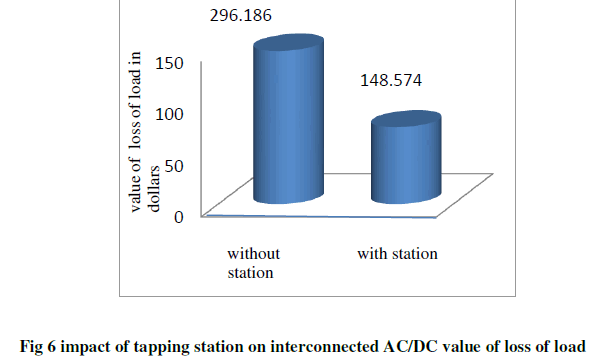
| Fig 6 shows the value of loss of load of interconnected AC/DC system without and with installation of tapping station. From Fig 6 it is observed that value of loss load, DC link with installation of tapping station is reduced to 147.616$ as compared with the DC link without tapping station. |
CONCLUSIONS |
| Interconnection of HVDC transmission system with HVAC improves the reliability, transmit the bulk amount of power to load. Tapping stations are share the load whenever the load demand exceeds the generating capacity. In this paper the effect of installation of tapping station on reliability of interconnected AC/DC lines are investigated and compared. |
| From this it will be concluded that the effect of installation of tapping station improves the reliability indices as compared to without installing the tapping station. |
References |
|