ISSN ONLINE(2320-9801) PRINT (2320-9798)
ISSN ONLINE(2320-9801) PRINT (2320-9798)
Mamta Sharma1 , Manish mahajan2
|
| Related article at Pubmed, Scholar Google |
Visit for more related articles at International Journal of Innovative Research in Computer and Communication Engineering
Grid computing is a type of computer network, in this each computer shares the various resources with the other one. Grid computing is used to coordinate and share the information among many user. In case of grid computing, many tasks are provided to the user, and user has to fulfill that tasks on time. For this purpose many scheduling algorithms come into picture. These scheduling algorithms helps to maintain the every task of grid computing that had to be performed. In our purposed work, we use the various scheduling algorithms in grid computing and then we choose the best scheduling algorithms on the basis of simulation result. We can also overcome the many problems of grid computing like: complexity and so on.
Keywords |
| Grid computing, scheduling, security, reliability. |
INTRODUCTION |
| A grid is a collection of computing resources that perform tasks. Grid appears to users as a large system, it provides a single point of access to powerful distributed resources. Grid can provide many access points to users. The users treat the grid as a single computational resource. The software uses resource management policies to schedule jobs to be run on appropriate systems in the grid. Users can submit millions of jobs at a time without being concerned about where the jobs run. Two grids are not the same.[1] The size if one grid may or may not fit all the situations. |
| Types of Grids: |
| Cluster grids: These are the simplest grids. Cluster grids are made up of a set of computer hosts. These hosts are work together. A cluster grid provides a single point of access to users in a single project. |
| Campus grids: These grids enable multiple projects within an organization to share computing resources. Organizations can use campus grids to handle a variety of tasks. |
| Global grids are a collection of campus grids that cross organizational boundaries to create very large virtual systems. |
 |
Architecture of grid Computing: |
| A grid's architecture is often described in terms of layers, where each layer has a specific function. The higher layers are generally user-centric, whereas lower layers are more hardware centric, focused on computers and networks.[2] |
| The lowest layer is the network, which connects grid resources.The network layer lies the resourcelayer. |
| The middleware layer provides the tools that enable the various elements to participate in a grid. |
| The highest layer of the structure is the application layer, which includes applications in science, engineering, business, finance and more, as well as portals and development toolkits to support the applications. This is the layer that grid users see and interact with. The application layer often includes the service ware, which performs general management functions like tracking who is providing grid resources and who is using them. The grid users need not be aware of the computational resources that are used for executing their jobs and storing their data. Grid computing is an emerging technology. |
Evolution Of grid Computing: |
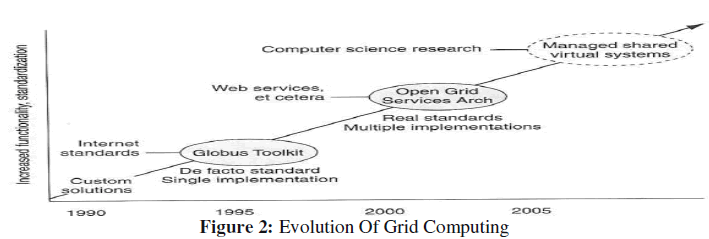
| In the early 90’s the custom solutions are used. in this the Meta computing is discuss, which is used to explorative work. In these days the applications are built directly on Internet protocols (TCP/IP) and it has the limited functionality, security, scalability, and robustness. |
 |
Grid Applications: |
| There are some basic applications of grid computing as: |
| Application partitioning that involves breaking the problem into discrete pieces |
| Discovery and scheduling of tasks and workflow |
| Data communications distributing the problem data where and when it is required |
| Provisioning and distributing application codes to specific system nodes |
| Results management assisting[3] in the decision processes of the environment |
| Autonomic features such as self-configuration, self-optimization, self-recovery, and self-management |
| Schedulers |
| Schedulers are types of applications responsible for the management of jobs, such as allocating resources needed for any specific job, partitioning of jobs to schedule parallel execution of tasks, data management, event correlation, and servicelevel management capabilities. [4] These schedulers then form a hierarchical structure, with meta-schedulers that form the root and other lower level schedulers, while providing specific scheduling capabilities that form the leaves. These schedulers may be constructed with a local scheduler implementation approach for specific job execution, or another metascheduler or a cluster scheduler for parallel executions. |
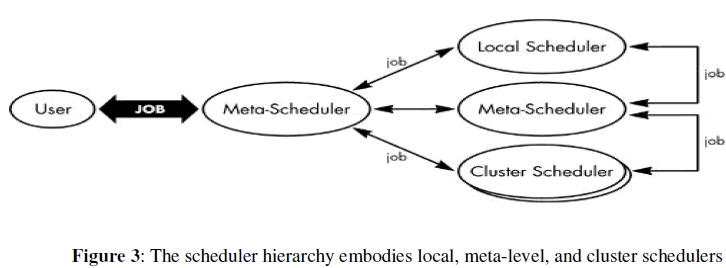 |
| The jobs submitted to Grid Computing schedulers are evaluated based on their service-level requirements, and then allocated to the respective resources for execution. |
Load Balancing |
| The Grid Computing infrastructure load-balancing issues are concerned with the traditional load-balancing distribution of workload among the resources in a Grid Computing environment. This load-balancing feature must always be integrated into any system in order to avoid processing delays and over commitment of resources. This level of load balancing involves partitioning of jobs, identifying the resources, and queueing of the jobs.[5] There are cases when resource reservations might be required, as well as running multiple jobs in parallel. |
RELATED WORK |
| Fangpeng Dong and Selim G. Akl discuss about the grid computing. As popularity of the Internet and the availability of powerful computers and the high speed networks as low-cost commodity components are changing the way we use computers today. These technical opportunities have led to the possibility of using geographically distributed resources to solve large-scale problems in science, engineering, and commerce. Recent research on these topics has led to the emergence of a new paradigm known as Grid computing. Grid computing is used to aggregate the power of widely distributed resources, and provide non-trivial services to users. To achieve this goal, an efficient [4] Grid scheduling system is an essential part of the Grid. In this paper author discuss the lots of things. First, the architecture of components involved in scheduling is briefly introduced to provide an intuitive image of the Grid scheduling process. Then various Grid scheduling algorithms are discussed from different points of view, such as static vs. dynamic policies, objective functions, applications models, adaptation, QoS constraints, and strategies dealing with dynamic behavior of resources, and so on. |
| Stefka Fidanova, et.al discuss about the ant colony optimization technique used in the grid computing. Grid computing is a form of distributed computing that involves coordinating and sharing computing, application, data storage or network resources across dynamic and geographically dispersed organizations. The goal of grid task scheduling is to achieve high system throughput and to match the application needed with the available computing resources. This is matching of resources in a non-deterministically shared heterogeneous environment. The complexity of scheduling problem increases with the size of the grid and becomes highly difficult to solve effectively. To obtain good methods to solve this problem a new area of research is implemented. This area is based on developed heuristic techniques that provide an optimal or near optimal solution for large grids. In this paper, author introduce a tasks scheduling algorithm for grid computing. The algorithm is based on Ant Colony Optimization (ACO) which is a Monte Carlo method. The paper shows how to search for the best tasks scheduling for grid computing. |
| Ryan J. Wisnesky, discuss about the heterogeneous computation of grid computing. Now days, computational grids are becoming more prevalent as the cost of bringing together disparate computing resources declines. However, a number of challenges remain before these grids can be utilized efficiently. This paper explores the results of using several well known scheduling algorithms to schedule work on a grid under probabilistic work arrival rates and varying task completion times. This paper presents the results of a simulation study of a heterogeneous computational grid using different scheduling algorithms. After a definition of robustness based on the concept of work completion latency is discussed, a method to simulate grids based on estimated time to compute matrices is presented. Three well known scheduling algorithms are then evaluated against each other, and the highest-performing scheduler is then analyzed in detail. The notion of ETC perturbation is presented, and this high-performing scheduling algorithm is found to be relatively robust against uncertainties in estimated task completion times. |
SCOPE OF THE STUDY |
| We provide a brief summary of literature search in above section. Our literature survey indicates that efforts are made to to minimize the total power consumptions in computing system. Power consumption has become the major challenge to system performance and reliability. Scheduling algorithms like MCT,MET and PFM helps in achieving the goal of power savings and performance maximization. We can implement the MCT( minimum completion time) and MET ( Minimum execution time ) algorithm to increase the performance in terms of their speed of execution. Along with we can implement the PFM algorithm to reduce the power consumption, reduce its waiting time and improved its execution with the help of MCT or MET algorithm. |
PROPOSED METHODOLOGY AND DISCUSSIONS |
Methodology: |
| In this work, a Grid resource refers to a processor and the term is used interchangeably. And the terms job, task, and Grid lets are used interchangeably to refer to a request made by a user to run a given application with QoS requirements or a given inputs. The following assumptions are: |
| Each job is non-pre-emptive, requiring one and only one machine at a time. |
| Tasks have no deadlines or priorities associated with them. |
| Each machine can process at most one job at a time. |
| The power consumption of the processor is proportional to execution time of jobs on that processor when the frequency or voltage is fixed. |
| The execution sequence of tasks on a processor is based on MCT (Minimum Completion Time). |
| In this work, we have presented Power aware job scheduling with Minimum completion time (MCT) algorithm and Minimum Execution Time (MET) algorithm to reduce the power consumption, reduce its waiting time and improved its execution and to improve Quality of Service (QOS). |
| The implemented algorithms are compared in terms of Average Waiting Time, Completion Time and Power Consumption of our proposed algorithm i.e PFM algorithm along with MCT and MET algorithm. We use GridSim version 5.2 toolkit to perform our simulations. Interactive software is developed in java using Eclipse IDE and also implemented in GridSim to execute three scheduling algorithms. |
| To evaluate the PFM scheduling algorithm, we use the following parameters: |
| Makespan: the total running time of all jobs. |
| Average waiting time: the average waiting time spent by a job in the grid. |
| Success rate: the percentage of jobs successfully completed in the system. |
| Power consumption: the power consumed by the jobs. |
Objectives: |
| To reduce the power consumption and improving its success rate |
| (a) PFM .(Power aware and feedback mechanism ) |
| (b) MCT (Minimum Completion time ) |
| (c) MET (Minimum Execution time ) |
| To implement code in GridSim |
| To compare scheduling algorithms on the basis of following parameters: |
| Makespan (Avg completion time) |
| Average waiting time |
| Scheduling success rate |
| Power consumption |
| As per demand, best scheduling algorithm will be selected. Also, it will find which is better in which situation. |
| Scheduling algorithms used in grid computing : |
| PFM (Power aware Feedback Mechanism ) : |
| In the power aware feedback mechanism, at the beginning of a job scheduling round, the scheduler chooses the average value of previous performance data as the controlled variable for our simple feedback mechanism. The average value is only the initial value for the future scheduling and it is a heuristic setting which can provide a minimum guarantee for QoS satisfactions. |
| MCT (Minimum Completion Time): |
| Minimum Compilation Time algo helps in reducing the waiting time for the scheduling jobs . |
| MET (Minimum Execution Time) : |
| Minimum Execution Time (MET) assigns jobs to the resources based on their minimum expected execution time without considering the availability of the resource and its current load.MET assigns each task, in arbitrary order, to the machine with the best expected execution time for that task, regardless of that machine's availability. |
EXPERIMENTAL RESULTS |
| Following are the snapshots of results which describe the implemented algorithms in terms of Makespan, Average waiting time and Power Consumption with grid environment. |
| Simulation results for power consumption of PFM algorithm with grid environment for 5 gridlets |
 |
| In figure 5.1, for PFM (Power aware and feedback mechanism) algorithm, power consumption reduces with the increase in number of jobs i.e. gridlets. Figure 5.2 shows the screenshot for the power consumption of PFM algorithm for the five gridlets that are scheduled for PFM algorithm in grid environment. Power consumption is power consumed by the jobs which reduces with the increase in the number of jobs. In the above figure, x-axis represents the Gridlets i.e. no. of jobs and y-axis represents power consumption that is consumed by number of jobs and units of power consumption is Kw.h. |
| Simulation results for Makespan of MCT algorithm with Grid environment for five numbers of jobs. |
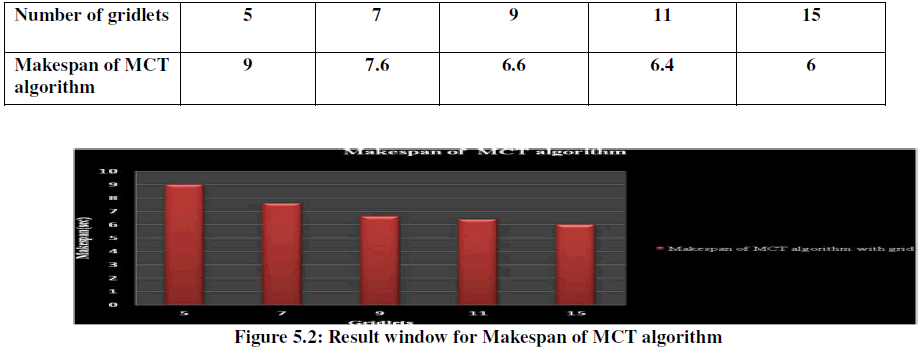 |
| Figure 5.2 shows the result window for makespan of MCT (Minimum Completion time) algorithm .This screenshot describes that makespan decreases with the increase in number of jobs for this algorithm in grid environment. Makespan is the maximum time taken for the completion of all the tasks in a given application. In the above figure, x-axis represents the number of jobs and y-axis represents the total running time of all jobs in seconds. |
| Simulation results for Makespan of MET algorithm with grid environment for five Gridlets. |
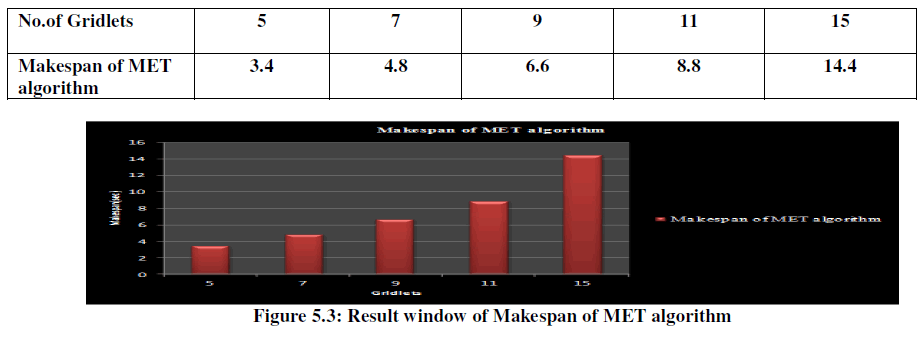 |
| Figure 5.3 shows the result window of Makespan of MET (Minimum Execution Time) algorithm. This result shows the completion time of five gridlets on grid environment which increases with the increase in the number of jobs. Makespan is the maximum time taken for the completion of all the tasks in a given application. In this result window, makespan increases with the increase in the number og gridlets. In the above figure, x-axis represents the number of jobs and y-axis represents the total running time of all jobs in seconds |
| Simulation results for Average Waiting Time of MCT algorithm with grid environment for 5 Gridlets |
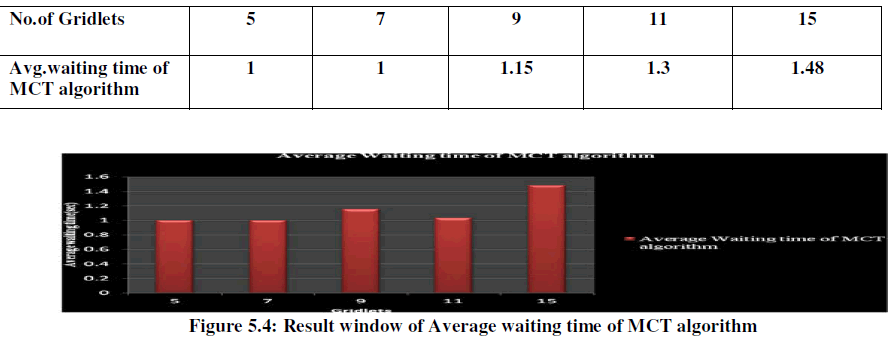 |
| Figure 5.4 represents the screenshot of average waiting time of MCT (Minimum Completion time algorithm).This result shows that average waiting time slightly increases with the increase in the number of jobs i.e., five gridlets in grid environment. Average waiting time is therefore, calculated as the average of all the waiting times calculated for all the processes. On the axis, x-axis represents the number of five gridlets and y-axis represents the average waiting time in seconds. |
| Simulation results for Average Waiting Time of MET algorithm with grid environment for 5 Gridlets |
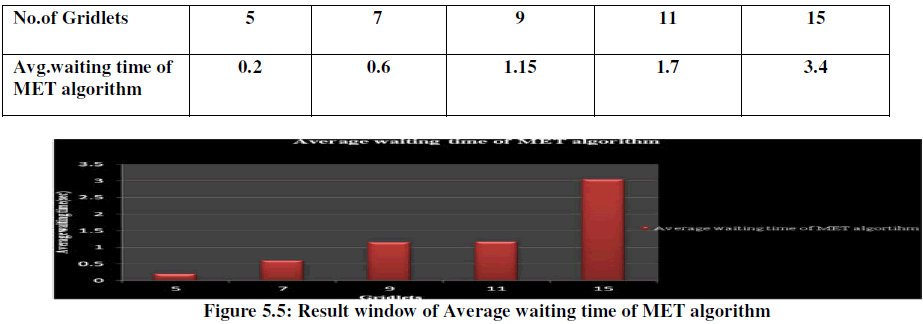 |
| Figure 5.5 represents the screenshot of average waiting time of MET (Minimum Execution time algorithm). This result shows that average waiting time gradually increases with the increase in the number of jobs i.e., five gridlets in grid environment. Average waiting time is therefore, calculated as the average of all the waiting times calculated for all the processes. On the axis, x-axis represents the number of five gridlets and y-axis represents the average waiting time in seconds. |
Comparison of Average waiting time of MET algorithm |
| Simulation results for Comparison of Average waiting time of MET algorithm with grid environment and with local environment having five gridlets i.e. number of jobs. |
 |
| Figure 5.6 shows the result window for Comparison of Average waiting time of MET (Minimum Execution time) algorithm with grid environment and on local environment. This result basically describes the comparison of average waiting time for MET which shows that There is negligible difference of waiting time of MET algorithm between grid and on local environment. Average waiting time is the amount of time a process has been waiting to get the resource allocated to it which is improved in grid environment as compared to local environment. It is the sum of periods spent by the processes waiting in ready queue. On the axis, x-axis represents the number of five gridlets and y-axis represents the average waiting time in seconds. |
 |
| Figure 5.6: Result window for Comparison of Average waiting time of MET algorithm with grid environment and with local environment |
Comparison of Average waiting time of MCT algorithm |
| Simulation results for Average waiting time of MCT (Minimum Completion Time) algorithm in Grid environment and in local environment having five gridlets i.e number of jobs. |
 |
| Figure 5.7 shows the result window for Comparison of Average waiting time of MCT (Minimum Completion time) algorithm with grid environment and on local environment. |
 |
| Figure 5.7: Result window for Comparison of Average waiting time of MCT algorithm with grid environment and with local environment |
| This result basically describes the comparison of average waiting time for MCT which shows that there is a huge difference of waiting time of MCT algorithm between grid and on local environment. Waiting time is the amount of time a process has been waiting to get the resource allocated to it. It is the sum of periods spent by the processes waiting in ready queue. On the axis, x-axis represents the number of five gridlets and y-axis represents the average waiting time in seconds. |
Comparison of Makespan of MET algorithm |
| Comparison of Makespan of MET algorithm with grid environment and with local environment for five gridlets. |
 |
 |
| Figure 5.8: Result window of Comparison of Makespan of MET algorithm with grid environment and with local environment |
| Figure 5.8 shows the result window for Comparison of Makespan of MET (Minimum Execution time) algorithm with grid environment and on local environment.This result basically describes the comparison of completion time for MET which shows that there is slightly difference of completion time of MET algorithm between grid and on local environment. This result shows the completion time of five gridlets on grid environment. On the axis, x-axis represents the number of five gridlets and y-axis represents the makespan in seconds. |
Comparison of Makespan of MCT algorithm |
| Simulation results for Makespan of MCT algorithm in Grid environment and in local environment having 5 gridlets i.e number of jobs. |
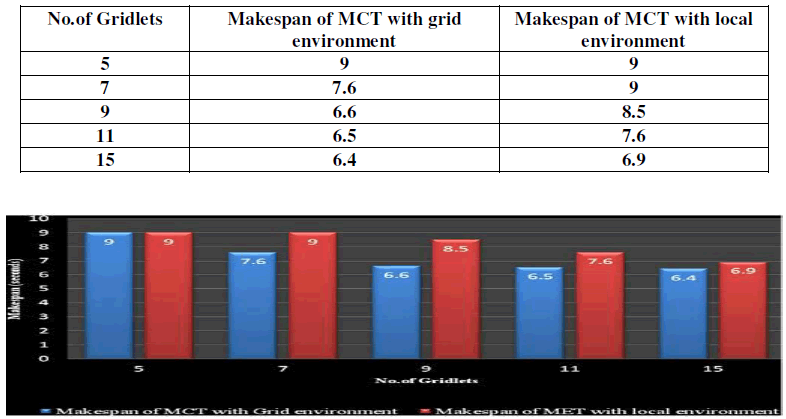 |
| Figure5.9 : Result window of Comparison of Makespan of MCT algorithm in Grid environment and in local |
| Figure 5.9 shows the result window for Comparison of Makespan of MCT (Minimum Completion time) algorithm with grid environment and on local environment. This result basically describes the comparison of completion time for MET which shows that completion time of MCT algorithm is improved in grid environment as compared to local environment. This result shows the completion time of five gridlets on grid environment. On the axis, x-axis represents the number of five gridlets and y-axis represents the makespan in seconds. |
Comparison of Power Consumption of PFM algorithm |
| Comparison of Power Consumption for PFM algorithm in Grid environment and in local environment for 5 numbers of gridlets. |
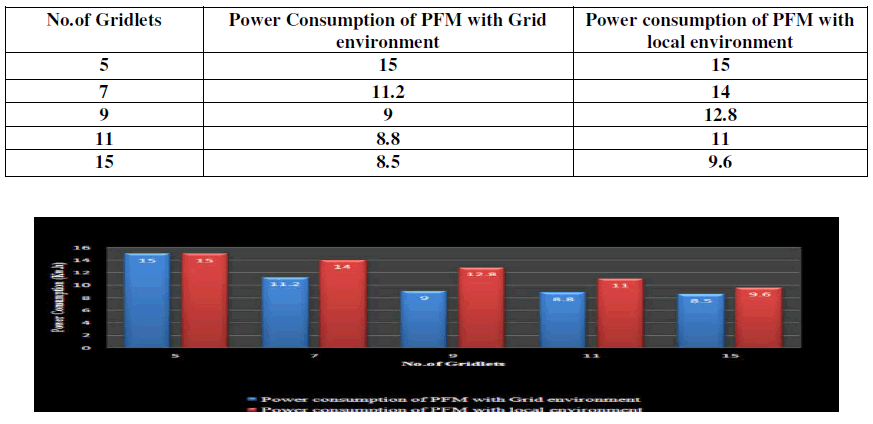 |
| Figure 5.10:Result snapshot for Comparison of Power Consumption of PFM algorithm in Grid environment and in local environment. |
| Figure 5.10 shows the result window for Comparison of Power consumption of PFM (Power aware and feedback mechanism) algorithm with grid environment and on local environment. This result PFM (Power aware and feedback mechanism) algorithm, power consumption reduces with the increase in number of jobs i.e. gridlets. |
CONCLUSION |
| Conclusion 1: In local environment , completion time of MCT decreases with the increase in number of gridlets and for MET algorithm ,completion time increases with the increase in the no.of gridlets . Whereas In Grid environment, time for MCT and MET improves and vary for the number of gridlets. |
 |
| Conclusion 2: For PFM (Power-Aware and Feedback Mechanism) ,power consumption reduces using Gridsim as compared to power consumption in without gridsim i.e on local environment. In PFM algo, Power consumption reduces with the increase in number of jobs i.e No.of gridlets, and Minimum Completion time also decreases with the increase in average waiting time in this algorithm . Comparison of Power Consumption for PFM algo in Grid environment and in local environment. |
PFM (Power-Aware and Feedback Mechanism): |
 |
| Conclusion 3: In local environment, average waiting time in MCT and MET algorithm increases with the increase in the no.of gridlets. Whereas In Grid environment average .waiting time for MCT and MET reduces for the number of gridlets as compared to above . |
 |
| Conclusion 4: In Gridsim , completion time of MCT algorithm reduces with the increase in number of gridlets as compared to MCT in local environment. |
 |
ACKNOWLEDGEMENT |
| I would like to thank the Mr. Manish Mahajan for providing me the data for my project. Also, I would like to acknowledge my friends for helping me in my work and for answering my many questions about grid computing. |
References |
|