Keywords
|
| RBTS,LOEE,DPLVC |
INTRODUCTION
|
| Electrical energy is vital in meeting the day to day needs of modern society and ensuring the future development of mankind. The purpose of an electrical power system is to generate electrical energy and then to transmit and distribute it through an extensive network to supply its customers with electrical energy as economically as possible and with a reasonable degree of continuity and quality [1]. Electricity has been the driving force for economies of the world and provides day-to-day necessity for the population in the world. Due to the nature of electricity systems, the variable demand at every moment needs to be met by consistent electricity supply to make sure the continuous availability of the resources. Not meeting the demand in any case will lead to a huge loss of income to the generators as well as to the consumers. People in modern societies have difficulty appreciating how life would be without electricity. It is expected that demands for high quality, and reliable power supply will continue to increase. In this context, the assessment of reliability of the systems is of very importance. Reliability studies and the development of reliability models and tools are important activities in the design and operation of reliable power systems. Reliability is considered to be a key element in power system operation and planning. The term „power system reliability? can be defined as a measure of the ability of an electric power system to provide acceptable electricity supply. A modern power system is complex, highly integrated and very large. Fortunately, the system can be divided into appropriate subsystems or functional areas that can be analyzed separately [1]. These functional areas are generation, transmission and distribution. The function of the generation system is to make sure that enough capacity is available to meet the load demand at any time. Transmission and distribution systems need to be reliable in making sure the electricity generated can be delivered to the consumers. System planners have been assigned the role of planning, for forecasting the load into the future and plant capacity addition to meet the load and provide a level of reliability in case some of the plants are out on maintenance or breakdown. Probabilistic method is often used to determine the system reliability and the system reliability can be summed up into a single value. Reliability studies are conducted for two purposes. Longterm evaluations are performed to assist in system planning and short-term evaluations to assist in day to day operating decisions. In short, these reliability indices (for long-term evaluations) are used by system planners and the authorities to decide on and advice for new investments in building new generation capacities.The work presents generation system reliability evaluation, which is a part of power system. Reliability evaluation can be done by determining the reliability indices using the two approaches viz, analytical technique and simulation technique usually called as Monte Carlo Simulation. The evaluation is illustrated by application to the Roy Billinton Test System (RBTS). [7]The term reliability has a broad meaning. The overall performance of the system in a desirable manner is often quantitatively designated as the reliability. A useful definition that illustrates the different dimensions of the concept is as follows: „Reliability is the probability of a device or system performing its function adequately, for the period of time intended, under the operating conditions intended?. Reliability can be measured through the mathematical concept of probability by identifying the probability of successful performance with the degree of reliability. Generally, a device or system is said to perform satisfactorily if it does not fail during the time of service. On the other hand, a broad range of devices are expected to undergo failures, be repaired and then returned to service during their entire useful life. In this case a more appropriate measure of reliability is the availability of the device, which is defined as; the availability of a repairable device is the proportion of time, during the intended time of service, that the device is in, or ready for service. |
| The aim of this paper is to analyze and look into the effect of increased load demand on the system reliability and decreased load demand on system reliability and also the effect of increase in failure rates of generating units on the system reliability. The effect of increase in the load on the system results increase in reliability indices, which in turn decrease the system reliability. On the other hand, if the load on system decreases the reliability indices are decreased and results the generating system reliability is increased. And increase in the failure rates also decreases the generating system reliability |
FUNCTIONAL ZONES AND HIERARCHICAL LEVELS
|
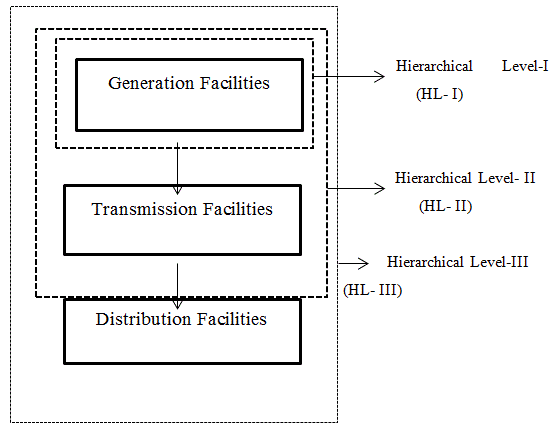
| Modern electric power systems are very complex, highly integrated. It is very difficult and impractical to attempt to analyze the whole power system as a single entity in a completely realistic and exhaustive manner. The overall power system can be divided into the three main functional zones of generation, transmission, and distribution. These functional zones can be combined to create the three hierarchical levels shown in Figure 1. [2] Reliability assessment at Hierarchical Level I (HL-I) is only concerned with the generation facilities. At this level, the total system generation including interconnected assistance is examined to determine its ability to meet the total system load demand. Reliability assessment at HL-? is normally defined as generating capacity adequacy evaluation or generation system reliability evaluation. The transmission network and the distribution facilities are not included in an assessment at the HL-? level. In HL-I studies, the transmission system and its ability to move the generated energy to the customer load points is ignored. The only concern is in estimating the necessary generating capacity to satisfy the system demand and to have sufficient capacity to perform corrective and preventive maintenance on the generating facilities. The historical technique used for determining this capacity was percentage reserve method. |
| Adequacy evaluation at Hierarchical Level ?? (HL-??) includes both the generation and transmission facilities in an assessment of the ability of the composite system to deliver energy to the bulk load points. HL-II studies can be used to assess the adequacy of an existing or proposed system including the impact of various reinforcement alternatives at both the generation and transmission levels. This analysis is usually termed as composite system reliability evaluation or bulk power system reliability evaluation. The basic objective was to assess the ability of the system to satisfy the real reactive power requirements at each major load point within acceptable voltage levels. This evaluation domain involves the joint reliability problem of generating sources and transmission facilities and is sometimes called bulk system analysis.Adequacy evaluation at Hierarchical Level ??? (HL-???) is an overall assessment that includes all three functional segments. The overall problem of HL-III evaluation can become very complex in most systems because this level involves all three functional zones, starting at the generating points and terminating at the individual consumer load points. For this reason, the distribution functional zone is usually analyzed as a separate entity. The HL-III indices can be evaluated, however, by using the HL-II load point indices as the input values at the sources of the distribution functional zone being analyzed. The objective of the HL-III study is to obtain suitable adequacy indices at the actual consumer load points. The work described in this thesis is conducted at the HL-? level. |
GENERATION SYSTEM RELIABILITY EVALUATION
|
| Generation system reliability is an important aspect in the planning for future system capacity expansion. It provides a measurement of reliability or adequacy to make sure that the total generation system capacity is sufficient to provide adequate electricity when needed. Reliability has been and always is one of the major factors in the planning, design, operation, and maintenance of electric power system. The total problem can be divided into two conceptually different areas designated as static and operating capacity requirements. The operating capacity area relates to the short-term evaluation of the actual capacity required to meet a given load level. Both these areas must be examined at the planning level in evaluating alternative facilities; however, once the decision has been made, the short-term requirement becomes an operating problem [1]. |
| A. Generating System Adequacy Assessment |
| Generation system reliability evaluation is also termed as generating capacity adequacy assessment. Reliability of the generation system is divided into adequacy and security. System adequacy relates to the existence of sufficient generators within the system to satisfy consumer load demand or system operational constraints. System adequacy is associated with the static conditions of the system and do not include system disturbances. System security on the other hand relates to the ability of the system to respond to disturbances arising within the system. Therefore system security is associated with the response of the system to whatever perturbation it is subjected to. System security refers to the ability of the power system to withstand disturbances arising from faults or equipment outages. Security assessment involves system transient responses and cascading sequences after a disturbance. Transient responses include the fluctuations of both the system frequency and bus voltages. If the fluctuations exceed certain operating limits, cascading sequences, such as line and generator tripping, may occur and persist until the system completely separates or collapses. These effects may not be properly accounted for in adequacy studies and must be captured in security evaluations. Although most research has been devoted to the adequacy assessment of bulk power system reliability, some concerns have recently shifted to security evaluations that also integrate the adequacy studies. In this study, the reliability equations will be focused on the generation system adequacy. |
| B. Basic Concepts and Techniques for Generating System Adequacy Assessment |
| Different techniques are used by electric power utilities to estimate the appropriate reserve required to maintain an acceptable level of system reliability. The two main reliability methods are the deterministic and the probabilistic methods. [1]The earliest techniques used to determine the required level of capacity reserve were deterministic methods. The common deterministic approaches include: |
| C Capacity Reserve Margin (CRM) |
| The capacity reserve margin is the excess generation capacity over the peak system demand. A reserve margin equal to a fixed percentage of the total installed capacity is required in this approach to avoid load loss due to the uncertainty with the load growth, or generating unit failures. The percentage value is chosen based on past experience. This method is easy to understand and apply. Reserve margin is the percentage of additional installed capacity over the annual peak demand. It is a deterministic criteria used to evaluate system reliability by defining a target generation margin. [12] |
| The formula to calculate the reserve margin is given by |
 |
| The forecasted peak demand and the expected capacity in planning need to be extracted from planning data to calculate the future system reserve margin. The assumptions used in the calculation of Reserve Margin is that Installed Capacity or the Nameplate Capacity is used instead of derated Capacity, and therefore does not give a true representation of the actual available margin the system will operate with. This method compares the adequacy of reserve requirements in totally different systems on the sole basis of their peak load, mainly used in the past for generation system expansion planning of small and established systems. Based on past experience, a certain percentage of reserve is set to be available to meet the peak demand, usually ranges from 15% to 20%. Plant addition is done when the Reserve Margin goes below the expected level. This method is very easy to use and understand in quantifying reliability and generation system adequacy. |
| However, as the power system grows in sizes and complexities, Reserve Margin aloe is not sufficient to provide the reliability assessment. The basic weakness of Reserve Margin is that it does not respond to, nor reflect, the probabilistic or stochastic nature of system behavior, of customer demands, or of component failure. For example, it does not consider the failure rate of different plant types and sizes. Deterministic analysis using just Reserve Margin calculation could lead to overinvestment in generation expansion or insufficient system reliability. Therefore, most of the utilities and system planner have been using the probabilistic indices rather than Reserve Margin criteria. |
| D Loss of the Largest Unit (LLU) |
| A capacity reserve equal to the capacity of the largest unit is required in this approach. This method simply compares system peak demand with the generation capacity when the largest generation unit is unavailable. In larger system however, more than one generating unit is assumed to be unavailable when carrying out the reliability study. The remaining capacity after the loss of largest generating unit is then known as the firm capacity. This can be given by equation |
 |
| Where, Cl ≥ Ci and i=1….n This method suffers from many drawbacks. Firstly, it does not take into account the probability availability of the generating units. It also takes no account of the actual size of the system as it treats the units in sets depending on their capacity. Last but not least, any few additions of larger unit(s) only mean that the firm capacity increases by the size of the largest set before the capacity expansion. As a result, the loss of largest unit approach is very inadequate and can be misleading. It is however used in some developing countries. A better indicator of system reliability can be obtained from indices generated through probabilistic analysis. |
| E System Modeling in Probabilistic Methods : The most basic conventional technique used to determine the capacity requirement was the percentage reserve or reserve margin method. This technique is explained in detail in section. Another conventional method used is a loss of largest unit. These two deterministic approaches have now been replaced by probabilistic methods which respond to and reflect the actual factors that influence the reliability of the system. The need for probabilistic evaluation of system behavior has been recognized since 1930s, and it may be questioned why such methods have not been widely used in the past. The main reasons were lack of data, limitations of computational resources, lack of realistic techniques, aversion to the use of probabilistic techniques and a misunderstanding of the significance and meaning of probabilistic criteria and indices. None of these reasons would need be valid today as most utilities have relevant reliability databases, computing facilities are greatly enhanced, evaluation techniques are highly developed and most engineers have a working understanding of probabilistic techniques. Therefore, most modern large power utilities use probabilistic methods in generating capacity adequacy assessment. |
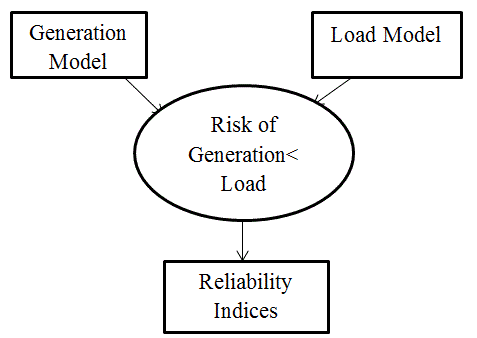
| In short, adequacy evaluation of generation systems consists of three general steps: |
| 1. Create a generation capacity model based on the operating characteristics of the generating units. |
| 2. Build an appropriate load model. |
| 3. Combine the generation capacity model with load model to obtain a risk model. |
| F Generation Model |
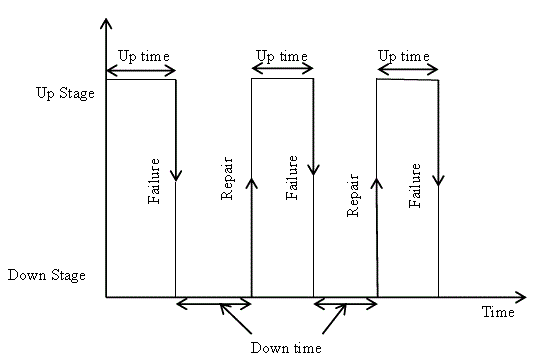
| A generating unit may be either “up” or “down”, i.e., available or not for service respectively. When it is in upstate, it may enter into the down state due to a fault. Similarly, from the downstate, upstate is entered through repair. The graphical representation of the availability of the generating capacity of a given unit on the basis of historical data is represented as shown in Fig 3 |
| The long-term average of power generation unit up time expressed as a fraction of the average cycle time gives the probability that the generation capacity of the unit will be available, also called the unit availability. In the same way, the long term average of the down time gives the probability that the generating capacity of the unit will be unavailable, also called as the unit forced outage rate (FOR). The probability values p and q are probability of the unit being in the up-state at any time t and the probability |
| A generating unit in a power system can be represented by a two-state or a multi-state Markov model. A two-state model represents a generating unit that can reside either in the fully functional state, or in the forced out of service state, as shown in Figure 4. The generating unit transits between the two states, and the transition rates λ and μ are shown in Figure 4. Here λ is the failure rate and μ is the repair rate of the generating unit. The mean time to failure (MTTF) is the average time a unit spends in the “Up” state. The failure rate λ is equal to the reciprocal of the MTTF, and can be calculated for a generating unit using (1). The mean time to repair (MTTR) is the average time taken to repair a unit. The repair rate μ is equal to the reciprocal of the MTTR, and can be calculated for a generating unit using (2). |
 (1) (1) |
 (2) (2) |
| The probability of finding a unit on forced outage at some distant time in the future is known as the unavailability (U). This term is conventionally known as the generating unit forced outage rate (FOR), and is a key reliability parameter in power system reliability studies [1]. Equation (3) can be used to obtain the unavailability or the FOR of a generating unit if the unit failure rate λ and the repair rate μ are known. Similarly, the availability (A) of the generating unit can be obtained using (4). Equations (5) and (6) are obtained from the two-state Markov model shown in Figure 4. The generating unit FOR is usually calculated from the unit operational data using (2.7) [1]. |
 (3) (3) |
 (4) (4) |
 (5) (5) |
 (6) (6) |
| G Load Model |
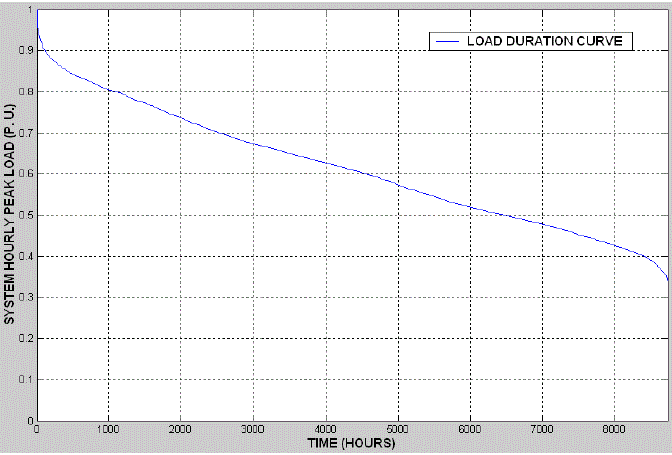
| There are different types of load models that can be used to represent the system energy demand over a specific period of time. The simplest load model is to use a fixed load for the entire period under study, and in these situations the system peak load is usually taken as the fixed load.The daily peak load variation curve (DPLVC) and the load duration curve (LDC) are widely used load models in adequacy evaluation of generation systems. The DPLVC is created by arranging the individual daily peak load data, usually collected over a period of one year, in descending order. The LDC is created when the individual hourly peak loads are used, and in this case the area under the curve represents the total energy demand for the system in the given period [1]. The LDC provides a more complete representation of the actual system load demand than the DPLVC. A sample load duration curve is shown in Figure 5. The Roy Billinton Test System is a published test system that is widely used in reliability studies. |
| H System Risk Model |
| The system risk model is obtained by combining the generation model with the load model. The risk model thus obtained can provide the system risk indices, such as loss of load expectation (LOLE) and loss of energy expectation (LOEE). The LOLE and LOEE are the most widely used reliability or adequacy indices. |
RELIABILITY INDICES
|
| The most widely used reliability indices in the generating system adequacy assessment are the Loss of Load Expectation (LOLE) and Loss of Energy Expectation (LOEE). |
| A ) Loss of Load Expectation: The LOLE is the average number of days on which the daily or hourly peak load is expected to exceed the available generating capacity. It therefore indicates the expected number of days or hours on which the load loss or deficiency will occur. It does not indicate the severity of the deficiency and neither does it indicate the frequency nor the duration of loss of load. Despite these shortcomings, it is the most widely used probabilistic criterion in generation planning studies. [2] |
| B ) Loss of Energy Expectation: The LOEE is the expected energy that will not be supplied by the generating system due to those occasions when the load demand exceeds available generating capacity. This is a more appealing index for two reasons. Firstly it measures the severity of deficiencies rather than the just number of occasions. Consequently the impact of energy short falls as well as their likelihood is evaluated. Secondly, because it is an energy based index, it reflects more closely the fact that a power system is an energy supply system. It is therefore likely that it will be used more widely in the future particularly for those cases when alternative energy replacement sources are being considered. The complimentary value of energy not supplied, i.e. energy actually supplied, is sometimes divided by the total energy demanded. This gives a normalized index known as the energy index of reliability (EIR) which can be used to compare the adequacy of systems that differ considerably in size. [2] |
| C )Probabilistic Adequacy Evaluation Methods |
| There are generally two fundamental approaches used to calculate the risk indices in a probabilistic evaluation, the analytical method and the simulation method commonly known as Monte Carlo Simulation (MCS) . Analytical techniques use mathematical and statistical models to represent the system elements. The system risk indices are obtained by solving mathematical models. Monte Carlo Simulation, on the other hand, simulates the actual process and the random behavior of the system. The reliability indices are obtained by observing the simulated operating history of the system. There are both advantages and disadvantages in each approach. The selection of the proper approach should be based on the desired type of evaluation and the particular system problems. |
| D) Algorithm for Generation System Reliability Evaluation |
| Following steps present the method of calculating reliability indices of generation system: |
| Step 1 : Input N, λ, μ, and capacity of units (Cj) for j = 1 to N, Max load. |
| Step 2 : Calculate the COPT & Read max load for year and load duration curve to develop appropriate load model. |
| Step 3 : Calculate the different values of Tj for different values of Oj. |
| Step 4 : Calculate LOLP & LOLE. |
| Step 5 : Calculate the expected energy lost for each capacity outage from load model. |
| Step 6 : Calculate LOEE. |
| Step 7 : Stop. |
| (1).The basic models and techniques for generating system adequacy evaluation are briefly described in this chapter. There are two broad categories of adequacy evaluation methods used in power system planning: the deterministic methods and the probabilistic methods. Although deterministic methods are easy to apply, they cannot recognize the random system behavior, and therefore, cannot provide a consistent measure of system risk. Probabilistic methods have therefore replaced deterministic methods in adequacy evaluation at the HL-I level. |
| (2)The different generation models, load models and risk models that are used in basic probabilistic methods for HL-I adequacy evaluation are described. Probabilistic methods include direct analytical techniques and MCS techniques. The evaluation methodologies for both techniques are described. The two widely used probabilistic reliability indices Loss of Load Expectation (LOLE) and the Loss of Energy Expectation (LOEE) are discussed in detail. |
PROBLEM FORMULATION
|
| A ) Capacity Outage Probability Table |
| The generation model required in the loss of load as well as in loss of energy approach is sometimes known as a capacity outage probability table. As the name suggests, it is a simple array of capacity levels and the associated probabilities of existence. If all the units in the system are identical, the capacity outage probability table can be easily obtained using the binomial distribution. It is extremely unlikely, however, that all the units in a practical system will be identical, and therefore the binomial distribution has limited application. The units can be combined using basic probability concepts and this approach can be extended to a simple but powerful recursive technique in which units are added sequentially to produce the final model [1]. These concepts can be illustrated by a simple numerical example. |
| The COPT is a table contains all the capacity states in an ascending order of outages magnitude. Each outage (capacity state) is multiplied by its probability. If the system contains identical units, Binomial distribution can be used. If the units are not identical, the procedure deals with all the states. |
| B ) Recursive Algorithm |
| In case of large system, more practical approach is recursive technique which is described as follows. The recursive expression for a state of X MW on forced outage after the addition of a generating unit of MW with forced outage rate U is given by, |
| P X = 1 − U P′ X + U P′(X − C) (A) |
| where, P?(X) and P(X) denote the cumulative probabilities of a capacity outage level of X MW before and after the unit of capacity C is added respectively. Equation is initialized by setting P?(X) =1.0 for X≤0 and P?(X) =0 otherwise. [1]Equation (A) is illustrated using the simple system shown in Table1. Each unit in Table .1 has an availability and unavailability of 0.98 and 0.02 respectively. |
| Capacity Outage Probability Table (COPT) for above example is as fallows. |
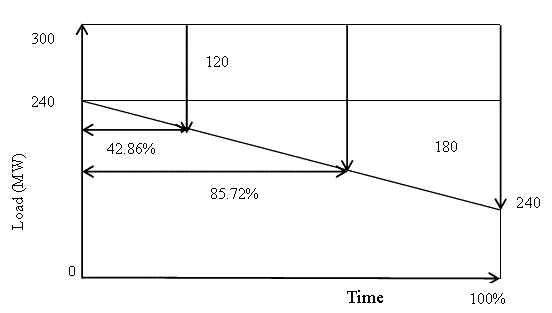
| C )Determination of Reliability Index: Consider a system having 5 x 60 MW units, each with an FOR of 0.03. The load model can be assumed as linear with a maximum load (Lmax ) of 240 MW, and a minimum load (Lmin) of 60 MW. Evaluate the system LOLE. The COPT and the loss of load expected can be convolved as follows: |
RELIABILITY INDICES EVALUATION WITH NON-CHRONOLOGICAL LOAD
|
| D ) Simulation procedure |
| The process of simulation as follows: |
| Step 1: Initialize H = 0, N = 0. E= 0 (H = hours of trouble, N = hours simulated, E = energy not supplied). |
| Step 2 : Generate a uniform random number U1. |
| Step 3 : If U1 < FOR, then unit is deemed to be in the down state (Ci = 0) otherwise unit 1 is available with full capacity (Ci = Capacity). |
| Step 4 : Repeat Steps 1-2 for units Ci to Cn. |
Step 5 : Cumulate available system capacity,  |
| Step 6 : Generate a uniform random number U2. |
| Step 7 : Compare the value of U2 with the cumulative probabilities representing the load model (figure 3.2). If Pi-1 < U2≤ Pi then load level L = Li. |
| Step 8 : If C< L. then H = H+ 1 and E = E + (L−C) else go to step 9 |
| Step 9 : N=N+1. |
| Step 10: Calculate LOLP=H/N. |
| Step 11: Calculate LOLE=LOLP×8760 and LOEE= (E×8760)/ N. |
| Step 12: Repeat Steps 1-11 until acceptable values of LOLP/LOLE and LOEE or stopping rule is reached. |
| E ) Reliability Test System |
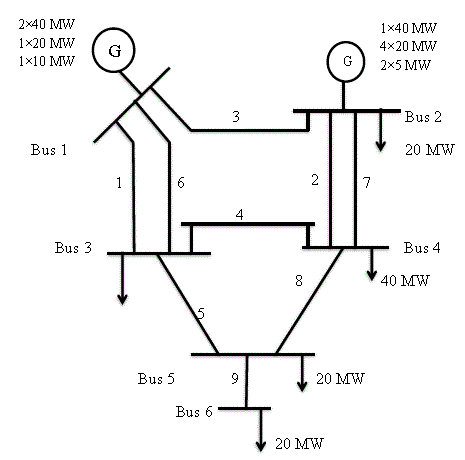
| The RBTS is a basic reliability test system developed at the University of Saskatchewan for educational and research purposes. The RBTS has an installed capacity of 240 MW from 11 conventional generating units. The single line diagram for the RBTS is shown in Figure 4.1. The detailed reliability data for the generating units in the test system is shown in Appendix A. The chronological hourly load model shown in Figure 2.6 is utilized, and the system peak load is 185 MW. The small size of this test system makes it a suitable test system to conduct large number of reliability studies in reasonable time. The RBTS comprises of 6 buses; 2 generator buses and 4 load buses. The 2 generator buses consist of 11 generators. The buses are connected via 9 transmission lines. The minimum and maximum ratings of the generating units are 5MW and 40MW respectively. The total installed capacity is 240MW and the system peak load is 185 MW. The voltage level on transmission line is 230kV.The annual peak load for the system is 185MW. The data on weekly peak loads in percent of the annual peak load, daily peak load in percent of the weekly peak, and hourly peak load in percent of daily peak are the same as that given in tables B.1, B.2, B.3 of the IEEE Reliability Test System. [7] The LOLE is the most widely used generating system reliability index, and the LOEE is an energy based index that provides useful information on the amount of energy curtailed. The LOLE and LOEE indices for the RBTS generating system are 0.1469 days/year 1.09161 hours/year, and 9.83 MWh/ |
RESULTS AND DISCUSSION
|
| The basic studies of this paper describe the generating capacity reliability or adequacy evaluation by using the probabilistic techniques. The analytical technique in which the system is represented by the mathematical models and evaluates the reliability indices from this model using the direct numerical solutions. The analytical technique uses the standard technique in which the COPT is created using a recursive algorithm for the generation models. The load models used are DPLVC and load duration curves. The reliability indices are obtained by combining the generation and load models. Simulation techniques estimate the reliability indices by simulating the actual process and the random behavior of the system. The studies are illustrated by the application to reliability test system designated as RBTS. Table 3.5 shows the RBTS reliability indices using the analytical and simulation techniques. It shows the two methods produce near results for the LOLE and LOEE reliability indices. |
CONCLUSION
|
| The generation system reliability is an important aspect of planning for the future development of the electricity system. The reliability evaluation methodologies for the generation systems have been developed and matured over many decades. The aim of this work is to analyze and look into the effect of increased load demand on the system reliability and decreased load demand on system reliability and also the effect of increase in failure rates of generating units on the system reliability.The effect of increase in the load on the system results increase in reliability indices, which in turn decrease the system reliability. On the other hand, if the load on system decreases the reliability indices are decreased and results the generating system reliability is increased. And increase in the failure rates also decreases the generating system reliability. Hence, we conclude from this basic study that, the generating capacity in excess of the peak demand, called the capacity reserve, is required to ensure against excessive load curtailment situation. An extremely high level of reserve can provide a high level of generating system reliability; On the other hand, a low reserve cheaper may not provide acceptable system reliability. The failure rates of generating units should also be low to expect the acceptable system reliability. |
| |
Tables at a glance
|
 |
 |
 |
 |
| Table 1 |
Table 3.2 |
Table 2 |
Table 3 |
|
| |
Figures at a glance
|
 |
 |
 |
 |
| Figure 1 |
Figure 2 |
Figure 3 |
Figure 4 |
 |
 |
 |
| Figure 5 |
Figure 6 |
Figure 7 |
|
| |
References
|
- Roy Billinton, R.N.Allan, “Reliability Evaluation of the Power Systems”, Second Edition, Plenum Press, New York, 1996
- Roy Billinton, R.N.Allan, “Reliability Assessment of Large Electric Power Systems”, Kluwer, Boston (1988).
- Roy Billinton, Mahmud Fouthi-Firuzabad, “Bibilography on the Application of Probability Methods in Power System Reliability Evaluation 1996-1999”, IEEE Transactions on Power Systems, Vol 16, No. 4, November 2001.
- R.N. Allan, Sen, “ Basic Concepts in Reliability Evaluation ”, IEEE Transactions on Power Systems
- Task Force on Bulk Power System Reliability of the IEEE-PES Application of Probability Methods Subcommittee, “Bulk Power System Reliability Concepts and Applications”, IEEE Transactions on Power Systems, Vol 3, No. 1, February 1988.
- IEEE Task Force on Predictive Indices, APM Subcommittee, ” Bulk System Reliability- Predictive Indices”, IEEE Transactions on Power Systems, Vol 3, No. 5, November 1990.
- R. Billinton, S. Kumar, N. Chowdhury , K. Chu, K. Debnath, L. Goel, E. Khan, P. Kos, G. Nourbakhsh, J. Oteng-Adjei, “A Reliability Test System For Educational Purposes- Basic Data”, IEEE Transactions on Power Systems, Vol. 4, No. 3, August 1989.
- RoyBillinton, Dange Huang, “Basic Concepts in Generating Capacity Adequacy Evaluation”, 9th International Conference on Probabilistic Methods Applied to Power Systems KTH, Stockholm, Sweden-June 11-15, 2006.
- Hagkwen Kim, Chanan Singh, “Composite Power System Reliability Modeling and Evaluation Considering Aging Components”, IEEE
- Roy Billinton, Dange Huang, “Basic Considerations in Generating Capacity Adequacy Evaluation”, IEEE CCECE/CCGEI, Saskatoon, May 2005.
- Nahid-Al-Masood, Md. KhurramMonirRabby, MamunRabbani, Mafruha Ahmed, ProteetiPeya, “An effective simulation technique to evaluate loss of load expectation”, Journal Electrical and Electronic Engineering 2013; 1(1): 29-34
- Hilal Al-Nasseri, Brian Wood, Amer Al-Hinai. “Generation System Reliability -Overview”, Oman Power & Water Procurement CO.
- L Goel, R. Gupta, “A Windows-based Simulation Tool for Reliability Evaluation of Electricity Generating Capacity”, Int. J. Engng Ed. Vol. 13, No.5 p. 347-357, 1997
- Kueck, J.D. et al. “Measurement Practices for Reliability and Power Quality – A Tool kit of Reliability Measurement Practices”. Oak Ridge National Laboratory, U.S. Department of Energy. Report No. ORNL/TM-2004/91, 2004.
- CiprianNeme, Florin Munteanu, “A Probabilistic Model for Power Generation Adequacy Evaluation”, Rev. Roum. Sci. Techn.–Électrotechn. etÉnerg., 56, 1, p. 36–46, Bucarest, 2009.
- Abdullah M. Al-Shaalan, “Reliability evaluation in generation expansion planning based on the expected energy not served”, Journal of King Saud University – Engineering Sciences (2012) 24, 11–18.
- Pillai, N. V. “Reliability and rationing cost in a power system”. Centre for Development Studies, Working paper No. 325, 2002, Thirivananthapuram, India.
- Okwe Gerald Ibe, InyamaKelechi, “Adequacy Analysis and Security Reliability Evaluation of Bulk Power System”, IOSR Journal of Computer Engineering (IOSR-JCE) e-ISSN: 2278-0661, p- ISSN: 2278-8727Volume 11, Issue 2 (May. - Jun. 2013), PP 26-35
- Roy Billinton, Dange Huang, “Peaking Unit Considerations in Generating Capacity Adequacy Assessment”, IEEE CCECE/CCGEI, Ottawa, May 2006.
- A. Ehsani, A. Karimizadeh, H. Fallahi and A. Jalali, “A Comparison of Deterministic and Probabilistic Methods for Determining the Required Amount of Spinning Reserve”, World Academy of Science, Engineering and Technology 60 2009
- Armando M. Leite da Silva, Reinaldo A. G. Fernandez, and Chanan Singh “Generating Capacity Reliability Evaluation Based on Monte Carlo Simulation and Cross-Entropy Methods” IEEE Transactions on Power Systems, Vol. 25, No. 1, February 2010
- AdamuMurtalaZungeru , AdegboyeBabatundeAraoye , BajogaBubaGaregyAmbafi James Garba , Omokhafe James Tola, “Reliability Evaluation of Kainji Hydro-Electric Power Station in Nigeria”, ISSN 2224-3232 (Paper), Vol.2, No.2, 2012.
- L.B Rana and N. Karki, “Analysis and Comparison of Risk and Load Point Indices of Power System Model HL-I and HL-II”, International Conference on Advancements in Electrical and Power Engineering (ICAEPE 2012) March 24-24, 2012 Dubai.
|