ISSN ONLINE(2278-8875) PRINT (2320-3765)
ISSN ONLINE(2278-8875) PRINT (2320-3765)
P. Senthil Kumar1, R. Gowrishankar2
|
Visit for more related articles at International Journal of Advanced Research in Electrical, Electronics and Instrumentation Engineering
By developing and implementing the distribution line management in various transmission line sectors using sensory data collection in mobile sinks and power stations by wireless communication. The goal of the concept is to provide uninterrupted load from power house to consumer; to achieve significant and immediate improvement in reliability and hence improved service to the electricity consumers. It indicates the fault occurred area to the power house and line patrol staffs. The fault location can be found out effectively and efficiently after a fault had occurred and prevent the theft of current in load lines. This concept can be used in isolated urban and rural areas to recognize the faults in load lines by formation of clusters, cluster head and rendezvous nodes in wireless sensor networks. The Zigbee and GSM technology were used in this sensor network for communication purpose. Fault indicator sensor is used for analysing the faults in load lines and retrieving the associated parameters.
Keywords |
| RNs, MSs, load acting point |
INTRODUCTION |
| The transmission lines and distribution system plays important role in current distribution to the consumers without interruption. The survey indicates that 80% of the consumerâÃâ¬ÃŸs service interruptions are due to failures in distribution networks. To improve the reliability of distribution, the sensory data collection in transmission line is essential. The present distribution automated system includes substation automation, feeder automation, automatic meter reading and automated build-up of geographic information system and so on. But the idea introduces the concept called automatic transmission line monitoring from power house. The feature of this concept is that the power house staff or line patrol staff can retrieve the parameters like amount of current flowing or voltage level in any load acting point. Hence the theft current in load lines can be recognized. The distance from power house to consumers is subdivided into clusters. Here a load acting point can act as either node or cluster head based on the energy consumption. |
| For each cluster there is a cluster head which collects the data from all the nodes. The rendezvous node is a stationary node which can communicate to the power house when required. If the fault occurs in any node it automatically updates the power station about the fault. The sensors sense the faults and intimate to the node device. The information about the fault includes the location and number of the pole, substation, and what kind of fault was occurred on the transmission line. The Zigbee technology is used for communication among the cluster head, various nodes and rendezvous node in the clusters. The GSM technology can be used to transmit the information to the power house or Mobile Station [MS]. The line patrol staffs will have a hand held device to receive the data from rendezvous. Here we use multi-hop technology that assesses the energy consumption of each node in the cluster to elect the cluster head. The main aim is to sense the fault with the help of sensors and updating the information about load line parameters, topology formation, cluster head election and rendezvous node selection. |
LOSSES IN TRANSMISSION LINES |
| If 100 MWh is generated at the power plant, on average only 93 MWh of that energy gets through the transmission and distribution system. |
| Average line loss = 1-2% for EHV transmission and 2-4% overall lines and substations. |
| Average line loss = 4-6% for distribution. Line losses at peak power are higher and can be up to 10-15% due to higher resistance and reactive power consumption. |
| JouleâÃâ¬ÃŸs Law states that the energy loss is directly proportional to the square of the current; higher voltages reduce current and thus in turn reduce the resistive losses. Line losses are dissipated as heat; hot conductors sag, which is why transmission lines have certain thermal constraints. |
SENSING THE FAULTS BY POWER STATION |
A.TYPES OF FAULTS : |
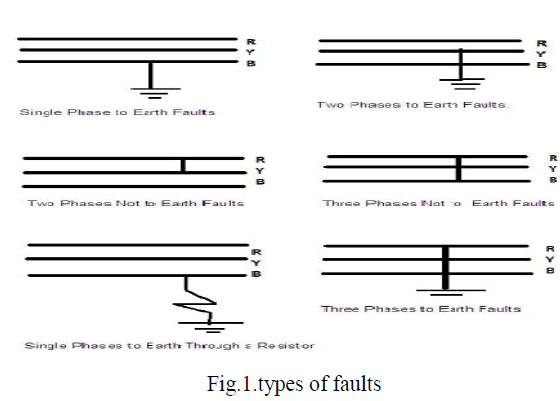
| Several faults that occurr in transmission lines as shown in the figure 1. |
 |
B.FAULT DETECTION AND LOAD SENSING: |
1. FAULT DETECTION: |
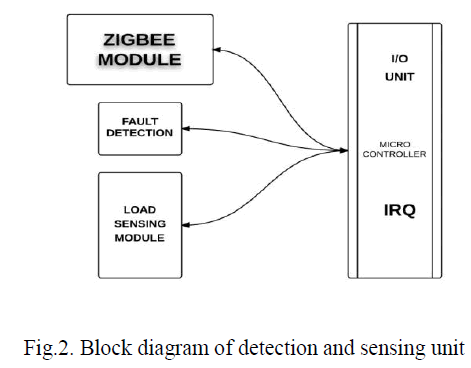 |
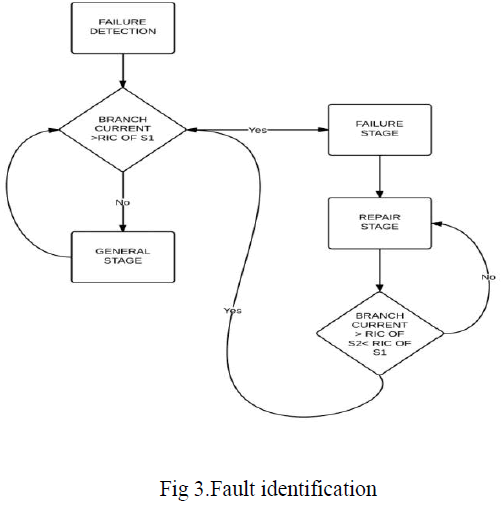
| The intelligent fault indicator and sensors can be divided into four parts: Load sensing module, fault current detecting module, Zigbee module and Micro-Controller Unit (MCU). The RF transceiver used in the Zigbee module is Microchip MRF24J40MB which is compatible with IEEE 802.15.4 standard and has the transmitting range up to 4000 fts. The microcontroller used in the MCU is Microchip PIC18LF4620 which features 10 MIPS performance, C compiler, optimized RISC architecture, 8 x 8 single cycle hardware multiply, lower power consumption in idle state, 13 ADC channels with 10-bit resolution and 100k samples per second, SPI and I2C peripherals. The failure detection module is composed of two magnetic reed switches and alarm LED. The magnetic reed switches with higher and lower rated interrupting currents, abbreviated as SW1 and SW2, are used to detect the abnormal and normal currents of the distribution branch. In general, the higher rated interrupting current is set approximately the rated short-circuit current , such as 1000A or 600A, of a distribution branch, and the lower rated interrupting current is set the minimum recovery current (12A as usual). Three stages can be classified according to the status of these two magnetic reed switches. General Stage: If the branch current, which is monitored by intelligent fault indicator, is smaller than the rated interrupting current of S1, S1 will remain OFF (open circuit) and the intelligent fault indicator is in the normal condition. Note that the status of S2 can be ignored in the general stage. |
| Failure Stage: When the branch current exceeds the rated interrupting current of S1, S1 will be ON (short circuit) and a fault has occurred on the branch. The fault condition will be detected by the external interrupt of the MC module for S1 and the fault information including the branch number and location will then be transmitted to the rear-end processing system by the wireless network constructed by the Zigbee modules. The MC will also enable the „alarm LEDâÃâ¬ÃŸ due to the failure of the current detecting module. The external interrupt for S2 and the fault indicator will return to repair stage. |
| Repair Stage: After fault has occurred, the fault indicator will be in repair stage. While the fault has been cleared completely or the power of the branch section has been restored, the branch current will be smaller than the rated interrupting current of S1 and higher than the rated interrupting current of S2, S2 will be ON. The condition will be checked by the external interrupts of the MC module for S2 and then be transmitted to the rearend processing system. The alarm LED will be turned off and the proposed intelligent fault indicator will return to general stage. |
 |
2. LOAD SENSING SENSOR: |
| The load sensing sensors are wireless sensors that indicate the amount of load in the transmission line. The sensors are mounted at the load acting point of the transmission line. The sensing details of load and distance can be forwarded to the microcontroller using Zigbee. The microcontroller calculates the following parameters using the formula programmed earlier. The parameters are: |
| Load in kVA |
| Length in km |
| Cumulative load in kVA |
| Moment |
| Regulation constant (pre-defined) |
| Percentage of voltage regulation. |
| Size of the conductor (pre-defined) |
3. FORMULA: |
| Moment=length*Cumulative load[3] |
| Voltage regulation=Moment*Reg. constant[3] |
| The below table shows the sample calculation.[3] The percentage of voltage regulation for L.T. line should be less than 6% and for H.T line it should be less than 8%. |
 |
CLUSTER FORMATION AND RNs NODE SELECTION |
| Clustering of data is a method by which large sets of data are grouped into clusters of smaller sets of similar data. In ordinary wireless networks, routing in sensor networks will either be from sensor nodes to the base station (many to one) or from the base station to sensor nodes (one to many). Routing in a sensor network can therefore be divided into three main categories, namely, direct transmission, planar routing and cluster-based routing. The main problem in deriving a cluster-based routing algorithm is the formation of clusters. Cluster formation techniques were first studied by researchers in data mining and data clustering, and the main process is to divide a set of data into partitions so that data having similar features are grouped in the same partition. Cluster formation techniques such as fuzzy C-mean algorithm, K-mean algorithm, subtractive clustering algorithm, mountain method, genetic algorithm and particle swarm optimization for applications in sensor networks for prolonging network lifetimes. However, all these methods require knowledge of sensor nodesâÃâ¬ÃŸ geographical locations which may not be available in many practical situations. |
A. FUZZY C-MEAN ALGORITHM: |
| Fuzzy C-Mean (FCM) is a method of clustering which allows one piece of data to belong to two or more clusters. This method was developed by Dunn in 1973 and improved by Bezdek in 1981 and it is frequently used in pattern recognition |
| Select an initial fuzzy pseudo-partition, i.e., assign values to all wi ; j |
| Repeat |
| Compute the centroids of each cluster using the fuzzy partition |
| Update the fuzzy partition, i.e., the wi ;j |
| until the centroids don't change |
1. ADVANTAGES: |
| Gives best result for overlapped data set and comparatively better then k-means algorithm. |
| Unlike k-means where data point must exclusively belong to one cluster center here data point is assigned membership to each cluster center as a result of which data point may belong to more than one cluster center. |
2. DISADVANTAGES: |
| A priori specification of the number of clusters. |
| With lower value of β we get the better result but at the expense of more number of iteration. |
| Euclidean distance measures can unequally weight underlying factors. |
B. K-MEAN ALGORITHM: |
| K-Means clustering generates a specific number of disjoint, flat (non-hierarchical) clusters. It is well suited to generating globular clusters. The K-Means method is numerical, unsupervised, non-deterministic and iterative. |
1. K-MEANS ALGORITHM PROPERTIES |
| There are always K clusters. |
| There is always at least one item in each cluster. |
| The clusters are non-hierarchical and they do not overlap. |
| Every member of a cluster is closer to its cluster than any other cluster because closeness does not always involve the 'center' of clusters. |
2. THE K-MEANS ALGORITHM PROCESS: |
| The dataset is partitioned into K clusters and the data points are randomly assigned to the clusters resulting in clusters that have roughly the same number of data points. |
| For each data point: |
| Calculate the distance from the data point to each cluster. |
| If the data point is closest to its own cluster, leave it where it is. If the data point is not closest to its own cluster, move it into the closest cluster. |
| Repeat the above step until a complete pass through all the data pointsâÃâ¬ÃŸ results in no data point moving from one cluster to another. At this point the clusters are stable and the clustering process ends. |
| The choice of initial partition can greatly affect the final clusters that result, in terms of inter-cluster and intra cluster distances and cohesion. |
3. ADVANTAGES: |
| With a large number of variables, K-Means may be computationally faster than hierarchical clustering (if K is small). |
| K-Means may produce tighter clusters than hierarchical clustering, especially if the clusters are globular. |
4. DISADVANTAGES: |
| Difficulty in comparing quality of the clusters produced (e.g. for different initial partitions or values of K affect outcome). |
| Fixed number of clusters can make it difficult to predict what K should be.q |
| Does not work well with non-globular clusters. |
| Different initial partitions can result in different final clusters. It is helpful to rerun the program using the same as well as different K values, to compare the results achieved. |
C. LEACH PROTOCOL: |
| Low Energy Adaptive Clustering Hierarchy ("LEACH") is a TDMA-based MAC protocol which is integrated with clustering and a simple routing protocol in wireless sensor networks (WSNs). The goal of LEACH is to a find way for low consumption of energy in the cluster and to improve the life time of the wireless sensor network. LEACH is a hierarchical protocol in which most nodes transmit data to cluster heads, and the cluster heads aggregate and compresses the data and forwards it to the base station. Each node uses a stochastic algorithm at each round to determine whether it will become a cluster head in this round. LEACH assumes that each node has a radio powerful enough to directly reach the base station or the nearest cluster head, but that using this radio at full power all the time would waste energy. |
| Nodes that have been cluster heads cannot become cluster heads again for P rounds, where P is the desired percentage of cluster heads. Thereafter, each node has a 1/P probability of becoming a cluster head in each round. At the end of each round, each node that is not a cluster head selects the closest cluster head and joins that cluster. The cluster head then creates a schedule for each node in its cluster to transmit its data. |
| All nodes that are not cluster heads communicate with the cluster head in a TDMA fashion, according to the schedule created by the cluster head. They do so using the minimum energy needed to reach the cluster head, and only need to keep their radios on during their time slot. LEACH also uses CDMA so that each cluster uses a different set of CDMA codes, to minimize interference between clusters. |
1. PROPERTIES: |
| ` Cluster based |
| Random cluster head selection each round with rotation |
| Communication done with cluster head via TDMA |
| Cluster membership adaptive |
| Data aggregation at cluster head |
| Cluster head communicate directly with sink or user |
| TDMA within clusters |
| CDMA across clusters |
| The clustering algorithm [5] constructs a multi sized cluster, where the size of each cluster decreases as the distance of its cluster head from the base station increases. We slightly modify the approach of the algorithm [5] to build clusters of two different sizes depending on the distance of the CHs from the MSâÃâ¬ÃŸs trajectory. Specifically, SNs located near the MS trajectory are grouped in small sized clusters while SNs located farther away are grouped. |
| In clusters of larger size the CHs near the MS trajectory are usually burdened with heavy relay traffic coming from other parts of the network. By maintaining the Clusters of these CHs small, CHs near the MS trajectory are relatively relieved from intra cluster processing and communication tasks and thus they can afford to spend more Energy for relaying inter cluster traffic to RNs. During an initialization phase, the MS moves along its fixed trajectory broadcasting periodically a BEACON signals to all SNs at a fixed power level. All nodes near the MS trajectory receive the BEACON message and thus they know that the clusters in their region will be small sized. Then, these nodes flood the BEACON message to the rest of the network. A detailed description of the clustering algorithm (Algorithm CH_ELECTION) which is executed Right after the MS completes its first trip, can be found. The clustering phase finalizes each CH proceeds to the selection of the appropriate cluster member to serve as RN. As discussed in the following section, not every CH can find such a set of RNs. |
RENDEZVOUS-BASED DATA COLLECTION |
| RNs guarantee connectivity of sensor islands with MSs and power houses. Hence, their selection largely determines network lifetime. RN lie within the range of travelling sinks and their location depends on the position of the CH and the sensor field with respect to the sinks trajectory. Suitable RNs are those that remain within the MSâÃâ¬ÃŸs range for relatively long time, in relatively short distance from the sinkâÃâ¬ÃŸs trajectory and have sufficient energy supplies. In practical deployments, the number of designated RNs introduces an Interesting trade-off: |
| A large number of RNs implies that the latter will compete for the wireless channel contention as soon as the mobile robot appears in range, thereby resulting in low data throughput and frequent outages. A small number of RNs implies that each RN is associated with a large group of sensors. Hence, RNs will be heavily used during data relays, their energy will be consumed fast and they will be likely to experience buffer overflows. Direct-contact data collection has great advantage for energy savings. However it significantly increases data collection latency because of sinksâÃâ¬ÃŸ low moving speed. Rendezvous-based data collection is proposed to achieve trade off of energy consumption and time delay. Sensors send their measurement to a subset of sensors called rendezvous points (RPs) by multi-hop communication; a sink moves around in the network and retrieves data from encountered RPs. The use of RPs enables the sink to collect a large volume of data at a time without travelling a long distance and thus greatly decreases data collection delay. Relevant research focuses mainly on RP selection. Note that, since RPs are static, data dissemination to RPs is equivalent to data dissemination to static sinks, which has been intensively studied in traditional static WSN. |
DYNAMIC SOURCE ROUTING |
| 'Dynamic Source Routing' (DSR) is a routing protocol for wireless mesh networks. It is similar to AODV in that it forms a route on-demand when a transmitting computer requests one. However, it uses source routing instead of relying on the routing table at each intermediate device. Determining source routes requires accumulating the address of each device between the source and destination during route discovery. The accumulated path information is cached by nodes processing the route discovery packets. The learned paths are used to route packets. To accomplish source routing, the routed packets contain the address of each device the packet will traverse. This may result in high overhead for long paths or large addresses, like IPv6. To avoid using source routing, DSR optionally defines a flow id option that allows packets to be forwarded on a hop-by-hop basis. This protocol is truly based on source routing whereby all the routing information is maintained (continually updated) at mobile nodes. It has only two major phases, which are Route Discovery and Route Maintenance. Route Reply would only be generated if the message has reached the intended destination node (route record which is initially contained in Route Request would be inserted into the Route Reply). To return the Route Reply, the destination node must have a route to the source node. If the route is in the Destination Node's route cache, the route would be used. Otherwise, the node will reverse the route based on the route record in the Route Request message header (this requires that all links are symmetric). In the event of fatal transmission, the Route Maintenance Phase is initiated whereby the Route Error packets are generated at a node. The erroneous hop will be removed from the node's route cache; all routes containing the hop are truncated at that point. Again, the Route Discovery Phase is initiated to determine the most viable route. For information on other similar protocols, see the ad hoc routing protocol list Dynamic source routing protocol (DSR) is an on-demand protocol designed to restrict the bandwidth consumed by control packets in ad hoc wireless networks by eliminating the periodic table-update messages required in the table-driven approach. The major difference between this and the other ondemand routing protocols is that it is beacon-less and hence does not require periodic hello packet (beacon) transmissions, which are used by a node to inform its neighbours of its presence. The basic approach of this protocol (and all other on-demand routing protocols) during the route construction phase is to establish a route by flooding Route Request packets in the network. The destination node, on receiving a Route Request packet, responds by sending a Route Reply packet back to the source, which carries the route traversed by the Route Request packet received. Consider a source node that does not have a route to the destination. When it has data packets to be sent to that destination, it initiates a Route Request packet. This Route Request is flooded throughout the network. Each node, upon receiving a Route Request packet, rebroadcasts the packet to its neighbours if it has not forwarded it already, provided that the node is not the destination node and that the packetâÃâ¬ÃŸs time to live (TTL) counter has not been exceeded. Each Route Request carries a sequence number generated by the source node and the path it has traversed. A node, upon receiving a Route Request packet, checks the sequence number on the packet before forwarding it. The packet is forwarded only if it is not a duplicate Route Request. The sequence number on the packet is used to prevent loop formations and to avoid multiple transmissions of the same Route Request by an intermediate node that receives it through multiple paths. Thus, all nodes except the destination forward a Route Request packet during the route replies to the source node through the reverse path the Route Request packet had traversed. Nodes can also learn about the neighbouring routes traversed by data packets if operated in the promiscuous mode (the mode of operation in which a node can receive the packets that are neither broadcast nor addressed to itself). This route cache is also used during the route construction phase. |
ZIGBEE CHARACTERISTICS |
| The focus of network applications under the IEEE 802.15.4 / Zigbee standard include the features of low power consumption, needed for only two major modes (TX/Rx or Sleep), high density of nodes per network, low costs and simple implementation. These features are enabled by the following characteristics: |
| 2.4GHz and 868/915 MHz dual PHY modes. This represents three license-free bands: 2.4-2.4835 GHz, 868-870 MHz and 902-928 MHz the number of channels allotted to each frequency band is fixed at sixteen (numbered 11- 26), one (numbered 0) and ten (numbered 1-10) respectively. The higher frequency band is applicable worldwide, and the lower band in the areas of North America, Europe, Australia and New Zealand. |
| The modulation techniques are of two kinds. They are direct sequence and the spread spectrum sequence. For enabling a new network it takes only 30ms. By using BECON the transmission rate will increase from 200 Kbits/sec to 1000 Kbits /sec and also transmission range of the network. |
| Maximum data rates allowed for each of these frequency bands are fixed as 250 kbps @2.4 GHz, 40 kbps @ 915 MHz, and 20 kbps @868 MHz |
| High throughput and low latency for low duty cycle applications (<0.1%) |
| Channel access using Carrier Sense Multiple Access with Collision Avoidance (CSMA - CA) |
| Addressing space of up to 64 bit IEEE address Devices, 65,535 networks |
| 50m typical range |
| Fully reliable “hand-shacked” data transfer protocol. |
| Different topologies as illustrated below: star, peer-to-peer, mesh. |
GSM TECHNOLOGY |
| The digital nature of GSM allows the transmission of data (both synchronous and asynchronous) to or from ISDN terminals, although the most basic service support by GSM is telephony. Speech, which is inherently analog, has to be digitized. The method employed by ISDN, and by current telephone systems for multiplexing voice lines over high-speed trunks and optical fibre lines, is Pulse Coded Modulation (PCM). From the start, planners of GSM wanted to ensure ISDN compatibility in services offered, although the attainment of the standard ISDN bit rate of 64 Kbit/s was difficult to achieve, thereby belying some of the limitations of a radio link. The 64 Kbit/s signal, although simple to implement, contains significant redundancy. Since its inception, GSM was destined to employ digital rather than analog technology and operate in the 900 MHz frequency band. Most GSM systems operate in the 900 MHz and 1.8 GHz frequency bands, except in North America where they operate in the 1.9 GHz band. GSM divides up the radio spectrum bandwidth by using a combination of Time- and Frequency Division Multiple Access (TDMA/FDMA) schemes on its 25 MHz wide frequency spectrum, dividing it into 124 carrier frequencies (spaced 200 KHz apart). Each frequency is then divided into eight time slots using TDMA, and one or more carrier frequencies are assigned to each base station. The fundamental unit of time in this TDMA scheme is called a „burst periodâÃâ¬ÃŸ and it lasts 15/26 ms (or approx. 0.577 ms). Therefore the eight „time slotsâÃâ¬ÃŸ are actually „burst periodsâÃâ¬ÃŸ, which are grouped into a TDMA frame, which subsequently form the basic unit for the definition of logical channels. One physical channel is one burst period per TDMA frame. |
COMMUNICATION WITH POWER HOUSE |
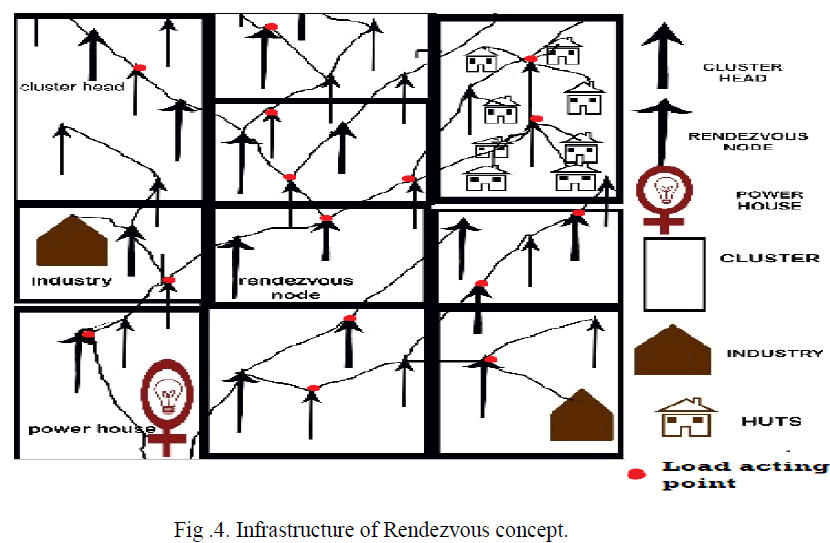 |
| The RN node frequently communicates with power house. The diagram shows the infrastructure of the topology. |
| The rendezvous node can communicate with power house or line patrol staffâÃâ¬ÃŸs (MSs). The GSM Technology is used to communicate with both RN and Power house. |
SIMULATION RESULT |
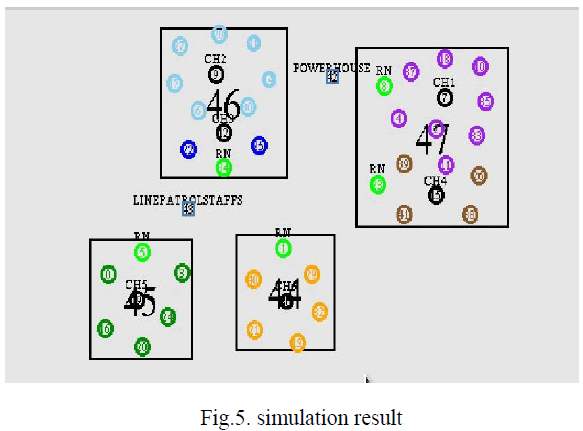
| The figure shown below gives the simulation result of this concept. |
 |
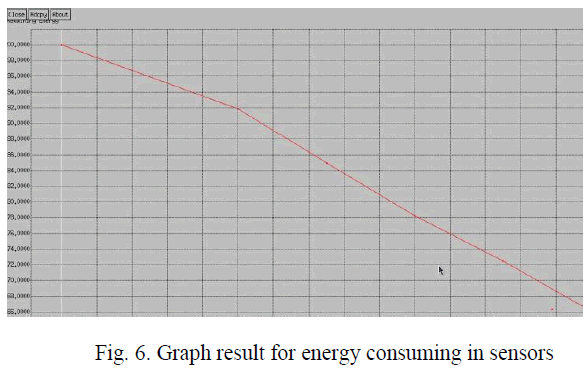
| The graph shows the energy consumption of sensor devices: |
 |
CONCLUSION |
| In this concept retrieving and updating the load parameters to the power house can efficiently identify the theft current and load interruption in transmission lines. The fault indication technology is effectively find out the fault current by the line patrol staff in the field and rectified. By formation of clusters and rendezvous node to prolong the life time of the sensor network and communication. |
References |
|