Research & Reviews: Journal of Material Sciences
ISSN:2321-6212
ISSN:2321-6212
Omoyeni OP1*, Atuanya CU1, Maddulety K2, Aigbodion VS3
1Department of Metallurgical and Materials Engineering, Nnamdi Azikiwe University, Nigeria
2National Institute of Industrial Engineering (NITIE), India
33Department of Metallurgical and Materials Engineering, University of Nigeria, Nigeria
Received date 10/01/2016; Accepted date 29/02/2016; Published date 03/03/2016
Visit for more related articles at Research & Reviews: Journal of Material Sciences
The compressive properties of developed maize husk/recycled low density polyethylene particulate composites (MHRLDPEpC) were investigated. The composites were produced by compounding and compressive moulding method. Emphasis was made to achieve a set of MHRLDPEpC process parameters that may yield optimum compressive properties. Thermogravimetric analyzer was used for the thermal analysis while Scanning electron microscope (SEM) was used for the morphology of the optimal compressive sample. The effect of the selected process parameters on the compressive properties of MHRLDPEpC and the subsequent optimal settings of the parameters were obtained via Taguchi method of experimental design for four factors to three levels. The result indicates that the maize husk/recycled low density polyethylene (MH/ RLDPE) composition is the most significant parameter in deciding the compressive strength while pressure has the most insignificant parameter. The predicted optimal value of the compressive strength was 17.689 N/ mm2 with the confirmation experiment giving 17.901 N/mm2. The overall results obtained from the thermal analysis and morphology of the optimal compressive sample were found to be favorable, satisfactory and of good predictability.
Maize husk; Compressive property; Thermal analysis; SEM and Taguchi method
Nowadays Research and Development(R and D) are focusing on the use of agro-waste and recycled wastes in developing composites, because of their renewable and available in large quantity and ecofriendly. Recent investigations of polymer-based composite materials have opened new routes for polymer formulations and have allowed the manufacture of new products with optimal properties for special applications. In most cases, these composites improve the product design and reduce the material and energy consumption [1-3]. Polymer composite materials are being used in a wide range of structural applications in the aerospace, construction and automotive industries due to their lightweight and high specific weight, high durability, stiffness and strength, which fulfill the requirement for many designs in manufacturing components [4-6]. Natural fibers/particles are being used in the production of sustainable composites for national development, due to the tremendous characteristics in the quality of natural fibers, such as durability, maintenance and cost effectiveness; they are fast emerging as a reinforcing material in composites. The high performance standards in the applications of natural fiber reinforced composites in industries hold the enormous potential and are critical for achieving sustainability. Natural fibers such as jute, flux, hemp, sisal, banana, bamboo, etc. have been used to reduce the cost of the composites [3]. Natural fibers are also great possible reinforcement for polymer structures in comparison with manmade fibers [7]. It is expected that natural fiber/polymer composites will expand their usage in the near future due to the advantages offered by these materials [8-10]. The compounding of fillers obtained from various sources into polymer matrices has been a well-accepted process to enhance the thermal properties of materials. Most of the polymer composites are generally subjected to thermal degradation at elevated temperatures. It is important to understand the effects of the processing temperature on the thermal degradation process, since there is constant thermal stress during the manufacturing of filler reinforced composites. Fundamental information regarding the thermal stability of natural fiber reinforced composites will be obtained from thermogravimetric analysis [11,12].
Liu [13] examined the compressive strength of fiber composites with random fiber waviness using a finite element model for fiber composites, including the role of fiber bending resistance, to investigate the compressive strength of composites containing a 2D random distribution of fiber misalignment. Hence the strength of the composite was given by the failure stress associated with the weakest such patch. For random distributions of waviness, the predictions using this engineering approach was in good agreement with the direct calculations of strength using the finite element method. They concluded that the research provided formalism for interpreting experimental data and guiding developments to improve the compressive strength of composites.
Hassan [14] studied the use of coconut fiber in the production of structural lightweight concrete waste. They observed that the compressive strength of the concrete decreased as the fibers volume increased in the concrete mix, it was concluded that the use of coconut fiber has a great potential in the production of structural lightweight concrete especially in the construction of low-cost concrete structures. Gammal [15] conducted experiments on the compressive strength of concrete utilizing waste tire rubber; they observed that although there was a significant reduction in the compressive strength of concrete utilizing waste tire rubber than normal concrete, concrete utilizing waste tire rubber demonstrated a ductile, plastic failure rather than brittle failure.
Chigondo et al. [16] studied maize stalk as reinforcement in natural rubber composites, determining the curing and physicmechanical properties of the composite as a function of filler loading and comparing with the values obtained using commercial grade hydrated silica. The natural rubber-maize stalk filled composites showed good processing safety in terms of torques and scorch. Based on mechanical properties and statistical treatment of data, composites filled with 20 phr treated maize stalk had the optimum set of mechanical properties (tensile strength of 22.4 MPa, elongation at break 404% and hardness Shore A of 55) that were closely comparable with commercial hydrated silica filled composites. Maize stalk demonstrated its potential to be used as filler in natural rubber with chemical modification resulting in enhancement of interfacial adhesion between the fiber and natural rubber matrix. Alomayri et al. [17] examined the compressive properties in the synthesis and characterization of mechanical properties of cotton fiber-reinforced geopolymer composites. The 28-day average values of compressive strength of the composites were given along with their corresponding stress/strain curves. They observed that geopolymer composite with 0.5% cotton fibers had the highest compressive strength. This was attributed to the possibility that the higher loads transferred from the matrix to the fibers resulting in a higher load been carried by the fibers. Another reason for such favorable behavior could have been good dispersion of cotton fibers throughout the matrix that increased the bonding strength between the fiber and the matrix. Geopolymer composites displayed some non-linearity during fracture whereas a linear fracture behavior was observed for geopolymer. This implies the feasibility of using cotton fibers to mitigate the brittle failure in geopolymers. However, the geopolymer composites cast with cotton fiber in the amount of about 0.7 and 1% fiber content by weight yielded a weak compressive strength. The reason for the reduction in compressive strength instead of an improvement with the addition of cotton fibers could have been attributed to a greater probability of these fibers balling together and leaving voids in the matrix [18]. Other reasons for this weakness may be that the cotton fibers had absorbed too much water, denying the geopolymer around the fibers enough water for geopolymerization, which in turn decreased the bonding strength between the fiber and the matrix. The compressive strength of the neat geopolymer paste increased from 19.1 to 46.0 MPa after the addition of 0.5 wt.% cotton fibers. However, adding more cotton fibers (0.7 and 1.0 wt%) led to a reduction in compressive strength. The reason for the reduction in compressive strength instead of an improvement with the addition of cotton fibers may be attributed to a greater probability of these fibers balling together and leaving voids in the matrix [18].
Other reasons for this weakness may be that the cotton fibers had absorbed too much water, denying the geopolymer around the fibers enough water for geopolymerization, which in turn decreased the bonding strength between the fiber and the matrix. Similar results were reported by Li [19], who investigated the compressive properties of hemp fiber-reinforced concrete. They found that compressive strength improved slightly when the fiber content by weight was lower than 0.6%, and continuously decreased when the fiber content was greater than this value. In the present study, the compressive strength of the neat geopolymer paste increased from 19.1 to 46.0 MPa after the addition of 0.5 wt.% cotton fibers. However, adding more cotton fibers (0.7 and 1.0 wt%) led to a reduction in compressive strength. They concluded that optimum enhancements in compressive strength were achieved for composites containing up to 0.5 wt.% cotton fibers. However, further increase in cotton fiber content beyond 0.5 wt.% led to fiber agglomerations with a concomitant reduction in mechanical properties by virtue of increased viscosity, voids formation and poor dispersion of fibers within the matrix. Hassan [20], in studying the potentials of maize stalk ash as reinforcement in polyster composites concluded that the maize stalk ash could be used to improve the strength of polymer matrix composites for use in automobile and building applications. Rajesh [21] investigated the erosive wear performance of hybrid composites utilizing Taguchi approach. Using Taguchi experimental design method to investigate the effects of the silk fiber on the erosion wear resistance of hybrid (silk-jute-glass) composite and also the comparison between the traditional and natural fiber erosion resistance. They observed from their initial investigation that the traditional fiber gives the best erosion resistance. They also observed that as the silk fiber percentage increased, the erosion resistance also increased. The results of natural hybrid fiber composites under consideration revealed that erosion wear resistance is 90% in traditional fibers given. The results of S/N ratio also proved that the natural fibers are giving almost equal erosion resistance given by traditional fibers.
Sutharson [22] studied the optimization of natural fiber/glass reinforced polyester hybrid composites laminate using Taguchi methodology, to obtain the optimum strength. A combination of Taguchi’s experimental analysis was developed. The influence of processing parameters on the extension of composites strength was examined by conducting the number of experiments as per the design of experiments, and analysis of variance techniques of Taguchi. Therefore, it was necessary to understand the relationship among the various controllable parameters and to identify the important parameters that influenced the quality of the composites. The results showed that for shear strength and compression strength, the stacking sequence produced maximum role. For hardness, the oven curing times contributed more than the sequence. The concentration of NaOH showed a good result for compression strength and hardness. The least contribution for shear strength was the NaOH percentage. Kiran [23] carried out a study on the influence of hot press forming process parameters on mechanical properties of green composites using Taguchi experimental design. The experimental results showed that the processing temperature had the most significant effect on all the three performance measures considered in their work. Mahapatra [24] studied the modelling and analysis of abrasive wear performance of composites using Taguchi approach. Their study was to characterize tensile strength, hardness and abrasive wear behavior of chopped untreated sugarcane fiber reinforced (oriented randomly) composites. The effect of various process parameters and their interaction on the abrasive behavior of the composite was been studied using Taguchi method. Results of composites under consideration revealed that abrasive wear (weight loss) increased with increasing load because high temperature was generated at higher load causing degradation of the composite surface. The factor and sliding velocity did not have significant contribution on weight loss. However, the size of the chopped sugarcane fiber played an important role on surface damage by abrasive wear. Chaulia [25] studied process parameter optimization for fly ash brick by Taguchi experimental method, to find out the optimum mix design for making bricks so as to achieve the maximum compressive strength. The experiments were designed using an L9 standard orthogonal array considering the process parameters such as water/binder ratio, fly ash, coarse sand, and stone dust, each with three levels. Results derived from statistical analysis of the experimental data showed that among the four process parameters, the water/binder ratio and stone dust had the most significant effect on the compressive strength. Moreover, water/binder ratio was having the highest contribution of the order of 82.62%. The optimal levels of the process parameters were found to be A3, B3, C1 and D2 corresponding to water/binder ratio of 0.4, fly ash of 39%, coarse sand of 24% and stone dust of 30%. The optimized value of the compressive strength for a 95% confidence interval was predicted as 166.22 ± 10.97 kg/cm-2, from the confirmation experiments. The mean value of the compressive strength corresponding to the optimum conditions was obtained as 160.17 kg/cm-2, which fell within the predicted range. In the research work of Pour [26], by studying the effects of the nano calcium carbonate production parameters on the production rate using the Taguchi method, the optimum level of production parameters and their priority for achieving optimum production rate was investigated. The most important parameters that governed production process of nano calcium carbonate were discovered to be the solution flow rate, gas flow rate and the solution concentration. For optimization of the nano calcium carbonate production rate, the effects of process parameters studied by using Taguchi method showed that the optimum levels of process parameters are: solution flow rate of 9 lit/min, gas flow rate of 20 lit/min and solution concentration of 70 gr/lit. The ANOVA results revealed that the process parameters in terms of impact significance were gas flow rate, solution concentration and solution flow rate. By using the optimum level of the process parameters, the production rate was enhanced by 168% in comparison to the mean value of the experimental results. Based on the forgoing literatures, there is no research of composites produced with maize husk and recycled polyethylene. Hence this present research is timely and novel. The aim of this present work is to produce a composite material with enhanced properties for engineering applications using Taguchi method of experimental design to optimize its process parameters that will meet sustainable development.
Materials/Equipment
The raw materials used in this research are: Maize husks were collected from around the surroundings in Benin City, Nigeria, where they have been dumped after usage. They were then washed and sun dried and crushed using a medium two flywheel plastic crushing machine to crush them into smaller sizes. They were afterwards grounded using Wiley laboratory grinding machine into powdered form Figure 1.
The recycled low density polyethylene (RLDPE) used in this research was obtained by collecting low density polyethylene films (pure water sachet) from refuse dump site in Onitsha, Anambra State, Nigeria (Figure 2). The low density polyethylene film (pure water sachets) was then washed and sun dried to remove dirt’s. They were afterwards shredded using a pulverizing machine to smaller particle sizes (Figure 3). Some of the equipment’s used in this research are: Metal mould, hydraulic press, two flywheel plastic crushing machine, Wiley laboratory grinding machine, Scanning electron microscope (SEM) and two Roll mill, Enerpac universal materials testing machine and TGA Q50 thermogravimetric analyzer.
Method
Taguchi Technique: For the optimization process in this work Taguchi technique was used. Taguchi technique is a powerful methodology to contract with the response controlled by the number of parameters. Taguchi design is applied to devise the experimental layout, examine the effect of each parameter and to determine the optimal level of each identified parameter. Taguchi design utilizes an orthogonal array to study the whole space with minimum number of experiments and hence it is achievable to condense time and cost of the experimental research. Taguchi method consists of plan of experiments, in which the factors are situated at different rows in an intended orthogonal array [27-32]. An orthogonal array provides more consistent estimates of factor effects with little number of experiments when compared to conventional methods. Depending on number of factors and identified levels of each factor, an appropriate array is chosen. Each column of the orthogonal array delegates a parameter and its setting levels in each experiment and each row entrusts an experiment with the level of several parameters in that experiment. After performing the experiments as per orthogonal array (OA), the results are converted into signal to noise (S/N) ratio data [33]. Taguchi technique is also a powerful tool for the design of high quality systems. It provides a simple efficient and systematic approach to optimize designs for performance, quality and cost. The methodology is valuable when design parameters are qualitative and discrete. Taguchi parameter design can optimize the performance characteristics through the setting of design parameters and reduce the sensitivity of the system performance to source of variation. This technique is a multi-step process, which follow a certain sequence for the experiments to yield an improved understanding of product or process performance. An outline procedure for Taguchi approach is shown very clearly with the help of flowchart as shown in Figure 4. This design of experiments process made up of three main phases: The planning phase, the conducting phase and analysis interpretation phase. The planning phase is the most important phase and one must give a maximum importance to this phase. The data collected from all the experiments in the set are analyzed to determine the effect of various design parameters. Figure 4 indicates an outline procedure for Taguchi approach. This approach is to use a fractional factorial approach and this may be accomplished with the aid of orthogonal arrays. Analysis of variance is a mathematical technique, which is based on a least square approach. The treatment of the experimental results is based on the analysis of average and analysis of variance [34].

Figure 1: Maize husk particles.

Figure 2: Low density polyethylene films.

Figure 3: RLDPE flakes.

Figure 4: An outline procedure for Taguchi approach [34].
Selection of Orthogonal Array (OA): This involves the number of factors and interaction. The number of levels for the parameters (factors of interest). Each process parameter was analyzed at three levels. The number of process parameters and their level values are given in Table 1 below. The DOF (degrees of freedom) of the OA selected for this analysis is represented in Table 2. This OA has four columns and nine experimental runs, the four parameters at three levels were assigned to these four columns. To limit the study, it was decided not to study for second order interaction among the parameters. Each three level parameter has 2 DOF (number of level - 1), the total DOF required for four parameters, each at three levels is 8[=4? (3 - 1)]. As per Tagushi's method the total DOF selected OA must be greater than or equal to the total DOF required for the experiment. So the L9 OA (a standard three-level OA) having 8 (=9 - 1) degrees of freedom was selected for the present analysis (Table 1). This OA has four columns and nine experimental runs. The four parameters at three levels can be assigned to these four columns [35].
| Process parameter designation | Process parameters | Level1 | Level2 | Level3 |
|---|---|---|---|---|
| A B C D |
Temperature (°C) Time (Min.) MH/RLDPE Composition (Wt. %) Pressure (MPa) |
120 12 40 3 |
130 13 50 4 |
150 15 60 5 |
Table 1: Various process levels and manufacturing parameter for MHRLDPEpC.
| Exp. No | Temp. A(°C) |
Time B(Minutes) | Maize husk/RLDPE C(Wt.% ) | Pressure D(MPa) |
Compressive Strength(MPa) Trials |
S/N Ratio | ||
|---|---|---|---|---|---|---|---|---|
| T1 | T2 | T3 | ||||||
| 1 2 3 4 5 6 7 8 9 |
120 120 120 130 130 130 150 150 150 |
12 13 15 12 13 15 12 13 15 |
40/60 50/50 60/40 50/50 60/40 40/60 60/40 40/60 50/50 |
3 4 5 5 3 4 4 5 3 |
||||
Table 2: Various factor levels and manufacturing parameter for MHRLDPEpC.
Production of the composites: The production of the composites was conducted by compression mould technique using Tables 1 and 2 formulation. The formulations comprise 40-60 wt% of MHRLDPEpC. The maize husk particles and the RLDPE were compounded in a two roll mill at a temperature of 130°C into a homogenous mixture, using proportions of (40-60)%, (50-50)%, and (60-40)%. The mixture was placed in a 350 mm by 350 mm rectangular mould and pressed to a thickness of 4 mm, using temperature's of (120, 130 and 150)°C, times of (12, 13 and 15 minutes)and pressures of (3-5) MPa. At the end of press cycle the composites were removed from the press for cooling [27-29]. The scanning electron microscope (SEM) JEOL JSM-6480LV was used to study the surface morphology of the composites. The composites were cleaned thoroughly, air-dried and coated with 100 Å thick platinum in JEOL sputter ion and observed SEM at 20 kV. The compressive tests were conducted on Enerpac universal materials testing machine of 100 KN capacity with a strain rate of 0.002 S-1, the test was conducted as per American Society for Testing and Materials [30]. The sample was locked securely in the grips of the upper and lower crossbeams of the testing machine. A small load was initially applied to seat the sample in the grips and then the load was increased until failure occurred.
Thermal decomposition was observed in terms of global mass loss by using a TA Instrument TGA Q50 thermogravimetric analyzer (TGA) using a TGA/DSC 1-1100SF instrument (Mettler). A high purity Argon was continuously passed into the furnace at a flow rate of 60 mL/min at room temperature and atmospheric pressure. Before starting each run, the Argon was used to purge the furnace for 20 min to establish an inert environment in order to prevent any unwanted oxidative decomposition. The TG and DTA curves that was obtained from TGA runs was carefully smoothed at a smoothing region width of 0.2°C by using least squares smoothing method and analyzed by using Universal Analysis 2000 software from TA Instruments [29,31,32].
Analysis procedure of the selected orthogonal array: The analysis procedure for the selected orthogonal array (L9) is presented using the parameter A assigned to the column1 of the L9 OA (Table 2). The same step by step procedure is applicable to all the parameters assigned to the various columns of the OA. Since experiments for each trial condition of the selected OA's have been repeated three times, three responses have been recorded. Let the three responses against each trial condition of the L9 OA be xij, i=1,2,3 (Table 3). Three responses added to the error sum of squares (SS) and other analysis of variance (ANOVA) terms are modified.
| Serial No. | Parameter Trial Conditions | Responses (raw data) | Signal/Noise Ratio (dB) | |||||
|---|---|---|---|---|---|---|---|---|
| S/N | A(1) | B(2) | C(3) | D(4) | Rs1 | Rs2 | Rs3 | S/N ratio |
| 1 2 3 4 5 6 7 8 9 |
120 120 120 130 130 130 150 150 150 |
12 13 15 12 13 15 12 13 15 |
40/60 50/50 60/40 50/50 60/40 40/60 60/40 40/60 50/50 |
3 4 5 5 3 4 4 5 3 |
14.023 14.247 11.391 13.011 11.173 18.010 7.359 16.460 15.500 |
13.970 14.245 11.485 13.006 11.077 17.715 7.397 16.355 16.245 |
14.011 14.111 11.411 12.986 11.143 17.917 7.396 16.144 15.962 |
22.922 23.046 21.160 22.280 20.931 25.047 17.366 24.287 24.024 |
Table 3: Various parameter conditions, responses for MHRLDPEpC.
Pure sum of squares (SS)
For parameter A to be significant then SSA=SSA – (Ve ? fA) (1)
Similarly, for other significant parameters pure sum of squares can be calculated. The subtracted amount of sum of squares must be added to the error sum of squares in order that total sum of squares is unchanged.
Percentage contribution (P):
PA=percentage contribution of parameter A towards mean of the response= (2)
(2)
PB, PC, PD, and PE are calculated accordingly in the same manner [36].
S/N data analysis: The raw data’s are converted to S/N ratios (dB). This transformation consolidates the repeated responses (raw data) in each trial condition into a single number. Thus, 9 S/N ratios are calculated which in turn also reduces the total DOF of the experiments [36]. The quality characteristics for compressive strength are of larger-is-better type. So, the signal-to-noise ratio (S/N ratio) for the “larger-is-better” type was used and is given below.
 (3).
(3).
Where xy j=1,2. – n are the, response values for the trial conditions respected n times.
The S/N ratio (dB) was computed for compressive strength for each of the nine trial values in dB (decibel) and is a logarithmic unit of measurement. These values are also given in Table 2. With 9 data points (S/N ratios) the total DOF of the experiments becomes fT=(number of data points – 1)=9-1=8. This procedure applies to the rest of the analysis.
The performance characteristics used in this work is compressive strength (the larger the better). The mean response refers to the average value of the performance characteristics for each parameter at the three different levels. The average values of the compressive strength for each level 1, 2, and 3 were calculated for the raw data and S/N ratios (Table 3). These values were plotted in Figures 5 and 6. Where Rs1, Rs2 and Rs3 represent values for the three repetitions of each trial. The 1's, 2's and 3's of the parameters which appear at the top of the column. C=Overall mean of compressive strength (CS)=363.935 N/mm2. From Figures 5, 6 and Tables 3-6, it can be seen that the compressive strength of the polymer composites is depend on temperature, time, MH/RLDPE composition and pressure. For example as temperature increase from 120°C to 130°C, the temperature of the composite material was enough for the maize husk particles to be evenly dispersed within the RLDPE. Increased in the temperature to 150°C lead to poor bonding between MH and RLDPE, due to degradation and burning off some vital constituents of the composites. Thus this ensured that the increase in compressive strength was no longer attainable. Also as the time increased from 12 to 15 minutes, the compressive strength also raises. When the time is increased there will be enough time, for the composite material to cure properly, ensuring that the filler and RLDPE will have enough time to adhere to each other and be properly bonded [37]. Increasing the time for the composite material to cure properly would increase the activation energy of the composite material, causing the molecules in the particles of the material to become more excited and agitated, gaining more strength and momentum to accelerate and flow evenly, even to higher levels in the composite material. This overall leads to an increase in compressive strength as the time is increased. Depicts higher compressive strength as the maize husk content is decreased and the RLDPE increased intermittently. The compressive strength of the composite material decreased as the maize husk particle loading increased beyond 40 wt%. This clearly showed that addition of maize husk particle to the RLDPE decreases the load bearing capacity of the composites; similar observations have been reported by [38,39] for other reinforced polymer composites. This is attributed to the fact that there is enough RLDPE to envelope the maize husk filler leading to better wetting, thereby ensuring that the composite material would be able to adequately support load. The decrease in compressive strength as the maize husk particles increased beyond 40 wt% is due to the interference of particles in the mobility or deformability of the matrix. Higher filler loading may result to poor interfacial bonding between the particles and the RLDPE matrix. Since maize husk particles is hydrophilic in nature, its strong inter fiber hydrogen bonding allows them to cling together, thus resisting the dispersion of the fiber, leading to weak interfacial bonding with consequent problems such as small void spaces and de-bonding in the resulting composite[40,41]. Furthermore, Figures 5 and 6 indicates that the compressive strength of the composite material increased as the pressure increased from 3 MPa to 5 MPa, This is because at a pressure of 5 MPa the particles in the composite material became more aligned to each other, causing the material to become more and more compacted. This compatibility is as a result of causing the granular layer inside the composite material to be more cohesive, converting it to a more and more enhanced denser state. This increased compatibility is what leads to increased compressive strength Figure 7. The optimum value of the compressive strength is predicted at the selected levels of significant parameters Table 7. The significant process parameters and their optimum levels have already been selected as A2, B3, C1 and D1. The estimated mean of the response characteristic (compressive strength) can be computed as [42]:
| Source | SS | DOF | V | F-ratio | SS’ | P (%) |
|---|---|---|---|---|---|---|
| Temperature (°C) Time (Min.) MH/RLDPE Composition (Wt. %) Pressure (MPa) Error Total |
3.724 61.044 178.476 1.441 0.363 245.048 |
2 2 2 2 18 26 |
1.862 30.522 89.238 0.721 0.020 122.363 |
92.420 1514.94 4429.26 35.770 |
3.724 61.000 178.429 1.401 0.363 |
1.503 24.894 72.815 0.5718 0.216 100.00 |
Table 4: ANOVA raw data (compressive strength).
| Level | Temperature (°c) | Time (Min.) | Maize husk content (%) | Pressure (MPa) |
|---|---|---|---|---|
| 1 2 3 DeltaRank |
13.210 14.004 13.222 0.794 3 |
11.462 13.904 15.071 3.609 2 |
16.088 14.368 9.981 6.107 1 |
13.678 13.155 13.604 0.523 4 |
Table 5: Response Table for Means (larger is better).
| Level | Temperature (oc) | Time (Min.) | Maize husk content (%) | Pressure (MPa) |
|---|---|---|---|---|
| 1 2 3 Delta Rank |
22.38 22.75 21.89 0.86 3 |
20.86 22.75 23.41 2.55 2 |
24.09 23.12 19.82 4.27 1 |
22.63 21.82 22.58 0.81 2 |
Table 6: Response Table for Signal to Noise Ratios (larger is better).
| Process Parameter | Parameter Designation | Optimal Level |
|---|---|---|
| Temperature (°C) Time (Minutes) MH/RLDDPE Composition (Wt. %) Pressure (MPa) |
A2 B3 C1 D1 |
130 15 40 3 |
Table 7: Optimum levels of process parameters for the compressive strength.

Figure 5: Effect of process variables on Mean data.

Figure 6: Effect of process variables on S/N data.

Figure 7: SEM/EDS of the microstructure of the optimum MHRLDPEpC composite
 (4)
(4)
Where  is the overall mean of compressive strength=13.47 N/mm2 ,
  is the average compressive strength at the third level of time=15.071 N/mm2 and
  is the average compressive strength at the first level of MH/RLDDPE Composition=16.088 N/mm2 (Tables 5 and 6). Substituting the values of various terms in Equation (4)

The 95% confidence interval of confirmation experiments (CICE) and of population (CIPOP) was calculated by using the following equations
 (5)
(5)
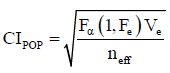 (6)
(6)
Where Ve is the error variance, F (1, fe) is the F-ratio at the confidence level of (1- α) against DOF, 1 and error degree of freedom fe.α is the confidence level
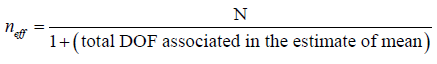
Where N is the total number of experimental results [=27 (9 x 3)] and R is the sample size for confirmation experiments=3
Ve=0.020 (Tables 4 and 5), fe=error DOF=18 (Table 4).
F0.05 (1, 18)=4.419 (tabulated F-value) [43].
So, CICE=±0.214 and CIPOP=±0.128
The predicted optimal range (for a confirmation runs of three experiments) is:
Mean CS – CICE < CS < mean CS + CICE (7)
17.475 < CS < 17.903.
The 95% confirmation interval of the predicted mean is:
Mean CS – CIPOP< CS < mean CS + CIPOP (8)
17.561 < CS < 17.817.
The confirmation experiment is a crucial step and is highly recommended by Taguchi to verify the experimental results [44]. In this study, three confirmation experiments were conducted at the optimum setting of the process parameters. The temperature was set at the second level [A2] time at the third level [B3], maize husk /RLDPE at the first level [C1] and pressure was kept at the third level [D1]. The average compressive strength was found to be 17.901 N/mm2, which was within the confidence interval of the predicated optimal compressive strength. TGA/DTA Figure 8 of the thermal decomposition for the optimum MHRLDPEpC exhibits only two dominant decline of the residual weight, indicating random scission of the RLDPE main chains as the prevailing decomposition reaction. The pronounced double endothermic effects observed in the DTA curves correspond to the oxidative degradation process and the release of matters. From the DTA curves the temperature of maximal decomposition and destruction of the MHRLDPEpC fall in between 400°C to 50°C Table 8. The presences of endothermic effects in the samples are results of three processes: intermolecular dehydrogenation, vaporization and solid state decomposition of some additives. The total burning and degradation of the residual polymer backbone (dehydrogenation RLDPE) took place at temperatures interval of 200- 500°C. Two peaks are observed from the thermal analysis, the first at 286°C, indicate the endothermic evolution of the volatile matter in the compound and RLDPE fiber degradation, while the second peak, 476°C, indicates the maximum decomposition temperature. The former is attributed to loss by dehydration, volatilization, while later effect is attributed to loss by depolymerization, delignification and oxidation [44-47]. This result is in par with [48] and is in good agreement with the theoretical stoichiometric values, based on the fact that lignocellulose materials are chemically active and decompose thermochemically between 150 and 500°C, hemicellulose mainly between 150 and 350°C, cellulose between 275 and 350°C and lignin between 250 and 500°C [40].

Figure 8: DTA/TGA analysis of the optimum MHRLDPEpC composite.
| T10%wt loss | T30%wt loss | T50%wt loss | T70%wt loss | T100%wt loss | Tmaxwt loss |
||
|---|---|---|---|---|---|---|---|
| RLDPE | 20min/°C | 275 °C | 328 °C | 398 °C | 461°C | 488 °C | 463 °C |
Table 8: Degradation temperatures of the optimum MHRLDPEpC composites as determined by DTA/TGA.
In this present work, morphology and compressive properties of RLDPE composites reinforced with maize husk particles has been investigated. From the results and discussion presented above, the following conclusions can be made;
i. This work shows the successful fabrication of RLDPE and the maize husk particles composite by compounding and compressive molding.
ii. The maize husk particles added to the RLDPE polymer improved the compressive strength of the composites.
iii. The compressive strengths of the composite increased with increasing percentage of the RLDPE to decreasing maize husk content.
iv. The test results from the compressive tests indicated the highest compressive strength of the MHRLDPEpC was 17.88 N/ mm2 and the average compressive strength was found to be 17.901 N/mm2, which was within the confidence interval of the predicated optimal compressive strength.
vi. The thermogravimetric analysis of the optimum composite gave a maximum decomposition temperature of 463°C.