e-ISSN: 2320-0812
e-ISSN: 2320-0812
Nagaraju PT*, Sreenivasa Rao M, Ravi Kumar C, Mabhasha D, K Venu Gopal and Murali Krishna NV
Department of Pharmaceutical Analysis, Nirmala College of Pharmacy, Kadapa - 516002, Andhra Pradesh, India
Received date: 10/04/2014; Revised date: 28/04/2014; Accepted date: 05/05/2014
Visit for more related articles at Research & Reviews: Journal of Pharmaceutical Analysis
A simple, precise and economical second order derivative method has been developed for the estimation of Linezolid in bulk and pharmaceutical formulations. In this method Linezolid showed sharp peak at 252 nm when n= 1 and linearity was measured at 252 nm. It obeyed Beer’s law in the concentration range of 1-6 mcg/ml. The LOD and LOQ were found to be 0.36 mcg/ml and 1.11 mcg/ml respectively. A recovery of Linezolid in tablet formulation was observed in the range of 98.30-101.09%. The proposed method is precise, accurate and reproducible and can be extended to the analysis of Linezolid in bulk and pharmaceutical formulations.
Linezolid, Spectrophotometric, Method validation.
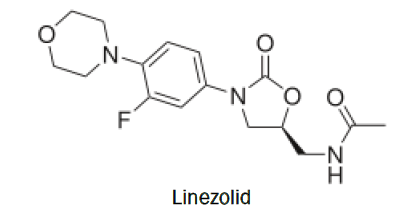
Linezolid [1] is a synthetic antibiotic, the first of the oxazolidinone class, used for the treatment of infections caused by multi-resistant bacteria including streptococcus and methicillin-resistant Staphylococcus aureus (MRSA). The drug works by inhibiting the initiation of bacterial protein synthesis.Chemical name of Linezoild is N-{ [(5S)-3- [3-fluoro-4-(morpholin-4-yl)phenyl]-2-oxo-1,3-oxazolidin-5-yl]methyl}acetamide. It has a molecular formula of C16H20FN3O4 and a molecular weight of 337.346 g/mol

Literature survey reveals that several analytical methods have been reported for the estimation of Linezolid by UV [2], LC-UV [3] , HPLC-UV [4,5], RP-HPLC [6-9] and HPTLC [10] methods. Apart from above one spectroscopic methods such as UV/Vis, difference spectrophotometric method, RP-HPLC etc., were reported for this compound.
UV spectrophotometric method was reported for the quantitative determination of Linezolid in pharmaceutical dosage forms. The developed method was simple, precise, specific and accurate and the statiscal analysis proved that method is reproducible and selective for the analysis of Linezolid in bulk drug and tablet formulations.
Instruments and reagents
A Elico-210 UV/VIS spectrophotometer was used with 1 cm matched quartz cell. All the chemicals used were of analytical grade. Hydrochloric Acid was procured from Loba Chem. Ltd., Mumbai. An analytically pure sample of Linezolid was obtained from Hetero Drugs Limited as a gift sample. Tablet of 600 mg were procured from local pharmacy.
Preparation of working standard drug solution
The standard Linezolid (100 mg) was weighed accurately and transferred to volumetric flask (100 ml). It was dissolved properly and diluted up to the mark with 0.05N Hcl to obtain final concentration of 1000 mcg/ml and the resulting solution was used as working standard solution.
Analysis of marketed formulations
For the estimation of Linezolid in tablets formulations by this method. 5 branded tablets were weighed and triturate to fine powder. Tablet powder equivalent to 10 mg of Linezolid was weighed and transfer into 100 ml volumetric flask than dissolved with 0.05N Hcl and further diluted with 0.05N Hcl. It was kept for ultrasonication for 30 min; this was filtered through Whatman filter paper No. 41 and then final dilution was made with 0.05N Hcl to get the final stock solution of 100 mcg/ml. From this stock solution, various dilutions of the sample solution were prepared and analysed.
Spectroscopic method
The spectra showed sharp peak at 252 nm when n=1 and linearity was measured at 252 nm (Fig 1). The absorbance difference at n=1 (dA/dÃâ Ãâº) is calculated which was directly proportional to the concentration of the standard solution. The standard drug solution was diluted so as to get the final concentration in the range of 1-6 mcg/ml and scanned in the spectra. The calibration curve of dA/dÃâ Ã⺠against concentration of the drug showed linearity. Similarly absorbance of sample solution was measured and amount of Linezolid was determined from standard calibration curve.
As the drug Linezolid showed a broad spectrum, the spectroscopy method applied has the advantage that it locate the hidden peak in the normal spectrum, when the spectrum is not sharp and it also eliminate the interference caused by the excipients and the degradation products present, if any, in the formulation.
The spectra showed sharp peak at 252 nm when n=1 and linearity was measured at 252 nm. The polynomial regression data for the calibration plots showed good linear relationship in the concentration range of 1-6 mcg/ml with r2= 0.997 and given in Table 1.
Precision
From stock solution (1000mg/ml) take 1-6ml and make up the dilution to 10ml with 0.05N HCL solution. The precision of the analytical method was studied by analysis of multiple sampling of homogeneous sample. The precision results were expressed as standard deviation or relative standard deviation.
Acceptance criteria
% RSD of the six replicate injections should not more than 2.0%.
Recovery Studies
Recovery studies were carried out at three different levels i.e. 80%, 100% and 120% by adding the pure drug to the previously analysed tablet powder sample and shown in Table 3 and 3A. The percentage recovery value indicates non interference of the excipients used in formulation.
The robustness of an analytical procedure is a measure of its capacity to remain unaffected by small, but deliberate variations in method parameters and provides an indication of its reliability during normal usage.
Wavelength
The solution was prepared and observed in replicate for three times with (±2) wavelength i.e. 250nm and 254nm respectively
Ruggedness
Ruggedness is a measure of the reproducibility of a test result under normal, expected operating condition from instrument to instrument and from analyst to analyst.
Acceptance criteria
% RSD should not more than 2.0%.
A spectrophotometric method for quantifying Lizoforce-600 in formulation samples has been developed and validated. The proposed method is precise, accurate and reproducible and can be extended to the analysis of Linezolid in bulk and tablet formulations.
We would like thank to Hetero Drugs Limited, Jadacherla for providing reference sample of Linezolid respectively to facilitate this work and also to the Principal Dr K. Venu Gopal, Nirmala College of Pharmacy, Kadapa for providing facilities.