International Journal of Innovative Research in Computer and Communication Engineering
ISSN ONLINE(2320-9801) PRINT (2320-9798)
ISSN ONLINE(2320-9801) PRINT (2320-9798)
Suganya1, Menaka2
|
| Related article at Pubmed, Scholar Google |
Visit for more related articles at International Journal of Innovative Research in Computer and Communication Engineering
In recent years, the use of remote sensed satellite images applications has increased rapidly. Remote sensing applications include monitoring deforestation in areas such as the Amazon Basin, glacial features in Arctic and Antarctic regions, and depth sounding of coastal and ocean depths.Image segmentation is used for analyzing function in imageProcessingand analysis.Image segmentation techniquesare used tosegment satellite images. The process of partitioning a digital image into multiple segments i.e. Set of pixels is called segmentation. The pixels in a region can be similar due to some homogeneity criteria such as color, intensity or texture.This paper surveys the different segmentationmethods is used for segmenting satellite images. Finally these papers summarize and conclude with the different segmentation methods.
Keywords |
| Remote sensed satellite images, Image Processing, Image segmentation |
INTRODUCTION |
| In recent years the urbanization has led to decrease in the use of land for agriculture and cultivation. The use of Remote sensed Satellite images to analyze the land cover is a process that is been carried out for a long time now. In order to obtain useful information from the satellite images which covers a wide area measured in several kilometers and objects that range from buildings to water-bodies to noise, clouds etc. |
| A multi-spectral image is a collection of several monochrome images of the same scene, each one taken with a different sensor. Each image is referred to as a band. In image processing, multi-spectral images are most commonly used for Remote Sensing applications.A multispectral image is one that captures image data at particular frequencies across the electromagnetic spectrum. |
| Spectral imaging can allow extraction of additionalinformation the human eye fails to capture with itsreceptors for red, green and blue. Remote Sensing imagesare frequently influenced by several changes, such ascamera viewpoints, distance and luminance, so differenttargets automatic recognition methods in remote sensingimages by using edges or gradient have attracted manyresearchers in recent years. We first need to segment the images to obtain the area of interest. The process of segmentation is the first step for any future analysis of an image. There are a large number of segmentation techniques that are available for this process. There is no particular standard technique or method that has been identified as the most suitable or best for a particular type or size of image. |
| The main goal of this paper is to explore and understand the different segmentation techniques. Segmentation refers to the process in which a digital image is divided into multiple segments(sets ofpixels,).Image segmentation can be used to find out boundaries and objects (lines, curves, etc.)inimages. The result of segmentation of image is considerably depends on the accuracy of feature measurement. Image segmentation is the computer-aided so that the computerization of medical image segmentation plays an important role in medical imaging applications. |
| This paper will help us find the most suitable technique that can be used for segmentation of satellite images. The Different types of segmentations are: |
| i) Region based segmentation |
| ii) Pixel based segmentation |
| iii) Edge based segmentation |
| iv) Model based segmentation |
| Pixel-Based Segmentation: It’s the simplest approach and is done based on pixel gray level values. It is also called as point based segmentation. |
| Edge-Based Segmentation: An edge based segmentation approach can be used to avoid a bias in the size of the segmented object without using a complex thresholding scheme. Edge-based segmentation is based on the fact of the first-order derivative that is position of an edge is given by an extreme |
| Region-based Segmentation : Region based methods are robust because they cover more pixels than edges and thus you have more information available in order to characterize your region. |
| Model-Based Segmentation :The human vision system has been able to recognize objects even if they are not completely clear or represented. It is obvious that the information that can be gathered from local neighborhood operators is not sufficient to perform this task. Instead Specific knowledge about the geometrical shape of the objects required, which can then be compared with the local information. This train of thought leads to model-based segmentation. |
LITERATURE REVIEW |
A. WAVELET TRANSFORM |
| Wavelets can be used to extract information from many different kinds of data, including –audio signals and images. A wavelet is a wave-like oscillation with an amplitude that begins at zero, increases, and then decreases back to zero. Wavelets allow complex information such as music, speech, images and patterns to be decomposed into elementary forms at different positions and scales and subsequently reconstructed with high precision. |
| The wavelets method is the one which least distorts the spectral characteristics of the data. The distortions are minima The wavelet based method is the most efficient in preserving the spectral information contained in the original multispectral images. Wavelets have the great advantage of being able to separate the fine details in a signal. Very small wavelets can be used to isolate very fine details in a signal, while very large wavelets can identify coarse details. A wavelet transform can be used to decompose a signal into component wavelets. |
B. MARKER CONTROLLED WATERSHED |
| Watershed model is a mathematical morphological approach and derives its analogy from a real life flood situation .It transforms image into a gradient image. Then, image is seen as a topographical surface where grey values are deemed as elevation of the surface at that location. Then, flooding process starts in which water effuses out of the minimum grey value. When flooding across two minimum converges then a dam is built to identify the boundary across them. This method is essentially an edge based technique. |
| The original watershed algorithm was susceptible to over segmentation so a modified marker-controlled based watershed algorithm was proposed by Beucher (1992). The marker- controlled method is used to conquer the oversegmentation problem of watershed transform. Use different scale of the marker image can produce segmentation results in different scale. Generally, small minsize value produces small-scale segmentation results, whereas large minsize value produce large-scale segmentation results. |
C. Fuzzy C-MEANS |
| The process of grouping a data set in a way that the similarity between data within a cluster is maximized while the similarity between data of different clusters is minimized .There are two main approaches to clustering. One method is crisp clustering (or hard clustering), and the other one is fuzzy clustering. A characteristic of the crisp clustering method is that the boundary between clusters is fully defined. However, in manyreal lifecases, boundaries between natural classes maybe overlapping. In such cases, the fuzzy clustering method provides a better and more useful method to classify these patterns. |
| Fuzzy C-means clustering algorithm is one of most important and popular fuzzy clustering algorithms. In fuzzy clustering (also referred to as soft clustering), data elements can belong to more than one cluster, and associated with each element is a set of membership levels. These indicate the strength ofthe associationbetween that data element and a particular cluster. Fuzzy clustering is a process of assigning these membership levels, and then using them to assign data elements to one or more clusters. |
D. K-MEANS |
| K-means is anunsupervised learning algorithm. It classifiesagiven data set through a certain number of clusters fixed priori. The main idea is to define k centroids, one for each cluster. These centroids should be placed in cunning way because of different location cause different result. So the better choice is to place them as much as possible far away from each other. The next step is to take each point belonging to a given data set and associate it to the nearest centroid .When no point is pending, the first step is completed and an early group is done. At this point we need to re- calculate k new centroids . |
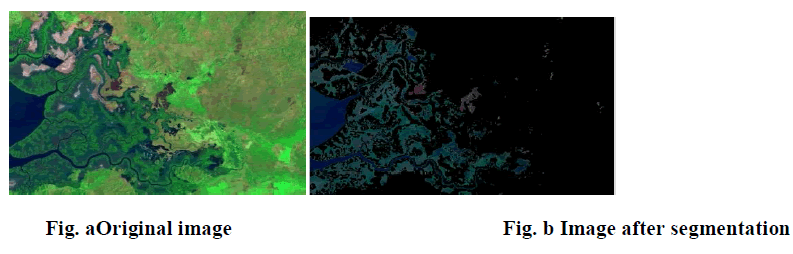
| The next step is to take each point belonging to a given data set and associate it to the nearest centroid .a new binding has to be done between the same data set pints and the nearest new centroid .A loop has been produced as a result of this loop we may notice that the k centroids change their location step by step until no more changes are done .In other word centroids do not have anymore . The Cosine distance can be used to find the centroid of cluster as it reduces computation time of the algorithm. The cosine similarity as quantified the cosine angle between vectors. Cosine similarity is one of the most popular similarity measure .Figure a is taken as original image. Figure b is an image after segmentation. |
E. THRESHOLDING |
| Thresholding is one of thesegmentationbecause of its simplicity and efficiency. If the target is clearly distinguishable from thebackground, the histogram of the image will be bimodaland then it can easier get to the threshold by choosing the valley bottom as the threshold point.However in most of real images, there are not clearly distinguishable marks between the target and the background. Ant Colony Optimization Algorithm (ACO) which is a kind of bionic evolution, one was invented by an Italian Scholar M.Dorigo. It was inspired by the observation of real antcolony and used to find an optimal path to food source inthe food searching process. |
| In the real world, ants are social insects and live in colonies. Their behavior is directed more to the survival of the colony as a whole than to that of a single individual component of the colony. An important and interesting behavior of ant colonies is their foraging behavior, and, in particular, how ants have the capability to find the shortest paths between food sources and their nest. The Ant colony optimization (ACO) algorithm is relatively a new meta-heuristic algorithm and a successful paradigm of all the algorithms which take advantage of the insect’s behavior. It has been applied to solve many optimization problems with good discretion, parallel, robustness and positive feedback. |
F. QUICK SHIFT |
| Quick Shift is a mode seeking algorithm which instead of iteratively shifting each point towards a local mean forms a tree of links to the nearest neighbor which increases the density. Quick shift arranges all of the data points into a tree where parents in the tree are the nearest neighbors in the feature space which increase the estimate of the density. By imposing a limit on the distance between nearest neighbors (maximum distance), we decrease the amount of computation required to search for the nearest neighbors. However, we also break our tree into a forest, because local modes of the density will now have no neighbor which is close enough in the feature space to form a link. |
 |
G. PARAMETERS FOR COMPARISON: |
| The parameters used for comparison of the Segmentation techniques are: |
| Mean: The standard definition of mean states Average or mean value of array. The Image is in form of a matrix |
| Variance: The Variance computes the unbiased variance of each row or column of the input, along vectors of a specified dimension of the input, or of the entire input. The Variance block can also track the variance of a sequence of inputs over a period of time. The block computes the variance of each row or column of the input, along vectors of a specified dimension of the input, or of the entire input at each individual sample time, and outputs the array y. Each element in y is the variance of the corresponding column, row, vector, or entire input. |
| Standard deviation :Standard deviation (represented by the symbol sigma, σ) shows how much variation or dispersion exists from the average (mean), or expected value. A low standard deviation indicates that the data points tend to be very close to the mean; high standard deviation indicates that the data points are spread out over a large range of values. A useful property of standard deviation is that, unlike variance, it is expressed in the same units as thedata. The measurements with percentage is unit, the standard deviation will have percentage points as unit. |
| SNR (Signal to noise ratio): Signal-to-noise ratio (often abbreviated SNR or S/N) is a measure used in science and engineering that compares thelevel of a desired signal to the level of background noise. It is defined as the ratio of signal power to the noise. |
| Power: A ratio higher than 1:1 indicates more signal than noise. |
CONCLUSION |
| In this paper, a study for various segmentation techniques out of the widely available segmentation techniques.The major aim of segmentation method is to provide the accuracy in segmented images. It has been observed that with a little modification to the existing segmentation algorithm a large improvement canbe achieved in its performance. For instance use of cosine distance in Kmeans to improve CPU time or use of Markers in Watershed to reduce oversegmentation that occurs with watershed algorithm .The study concludes with the fact that the existing segmentation methods can be applied for segmentation of Satellite Images, depends on the application |
References |
|