ISSN ONLINE(2278-8875) PRINT (2320-3765)
ISSN ONLINE(2278-8875) PRINT (2320-3765)
D. P. Mishra1, G. M. Asutkar2
|
| Related article at Pubmed, Scholar Google |
Visit for more related articles at International Journal of Advanced Research in Electrical, Electronics and Instrumentation Engineering
There is growing need to enhance the performance of contemporary vehicle surveillance technologies using the advances in Wireless Sensor Networks (WSN)Technology. It is widely proposed to use recent advances in WSN technologies for vehicle detection and classification. Traffic surveillance systems provide data for building an efficient Intelligent Transportation System (ITS). Flexibility, ease in installation and maintenance, low cost and high accuracy of WSN gives more accurate vehicle detection and classification. This paper proposes a simple, yet, powerful system for real time vehicle classification. The approach is an improvisation and advancement of already developed algorithms. Presented algorithm is used for extraction of feature vectors. The experiment detects vehicles using detection state machine (DSM) and classifies them through K-Nearest Neighbouralgorithm. This classifier classifies the vehicles, into their stipulated classes, using its magnetic signature’s shape with nearly 100% accuracy. It has been verified that the algorithm enhances the performance of vehicle surveillance with high precision and robustness.
Keywords |
| Wireless Sensor Network, traffic surveillance, K-nn classifier, Detection State Machine. |
INTRODUCTION |
| Urban traffic management is a big problem confronting the global planners [1, 2]. This is due to rapid increase in vehicular density. Traffic jam, in particular, is a headache for urban commuters, also causing great financial loss with each passing day [3]. ITS design seems to be one of the most effective approaches to deal with such problems .One of the largest obstacles to the implementation of ITSis the non-availability of accurate and reliable traffic surveillance data. Currently used traffic sensor technologies (video, sonar, radar, inductive, magnetic, capacitive, and pneumatic) pose problems during installation and subsequent maintenance and also cost several thousands of rupees [4, 5,6,7]. They suffer from low performance in classification precision. Here is a call for more information about speed, occupancy and other statistical quantities of traffic or just information about presence or absence of vehicle at a particular place (parking lot). |
| In the year 1999, Caruso et al. [8] suggested that vehicle classification is feasible using the vehicle signatures with the help of Anisotropic Magneto Resistive (AMR) sensors. Then after,Nooralahiyanet al. [9] proposed that the acoustic signature of vehicles can be used to classify them by means of neural networks. In recent past, researchers have developed numerous detection and classification algorithms [10]. Average bar and hill pattern matching are some of the important methodologies adapted in classification of vehicles. However, the accuracy of the classification is not up to the mark. In the PATH (Partners for Advanced Transit and Highways) project of university of California, Berkeley, the possibility of replacing traditional sensors, such as loop detectors, with WSN has been creatively researched. Their Adaptive Threshold Detection Algorithm (ATDA) is an efficient vehicle detection algorithm with high precision of 97%, but the classification scheme is not so efficient with low performance that overall classification rate is below 60%. The classification algorithm has three main drawbacks as follows: (1) the features of the vehicle signal used in classification are insufficient, only hill pattern and average bar is considered (2) Vehicles are classified according to the signal slopes and this set of features is not a good representative of vehicle type(3). The proposed method uses statistical measures of shapes to classify the vehicle. |
| Objective of the presented work is to design an improvised and automated vehicle detection and classification system. An AMR sensor is used to detect the disturbance in the earths’ magnetic field caused by the vehicle during its travel over/alongside the sensor. The detected signal’s shape depends on the class of the vehicle such as car, bus, truck etc. The acquired signals are then smoothed out, compressed and normalized for subsequent operations. DSM is used to detect the passing vehicle. Further, it is also used to avoid false detection due to spurious signals. Thereafter, signal statistics such as moment, skewness and kurtosis havebeencalculated and fed to classifier. The K-NN classifier classifies each passing vehicle in to its stipulated class with 100% accuracy. |
| The paper has been organized in five sections. At first WSN in ITS environment is discussed, in brief, to provide adequate background of the work. Subsequently, in the material and methods section AMR sensor along with its related theory, detection algorithm, which uses the state machine to detect the arrival of the vehicle, are presented. This section also presents the data collection, and subsequent processing of the raw data. This section concludes with details of KNN classifier. Fourth section is focused around the experimentation and associated findings. The concluding remarks, about the results, which are in agreement with hypothesis, are presented at the end of the paper. |
II. WSN IN ITS (INTELLIGENT TRANSPORTATION SYSTEM) ENVIRONMENT |
| Globalization, liberalization and privatization followed by economic boom have put a lot of disposable income in the hands of people. It has led to more number of vehicles on road. This demands more space on road. Ultimately, there is more traffic congestion resultingtrafficjams..Consequently, traffic problems lead to more delays, accidents, increased fuel wastage and associated environment pollution. Hence, the need for more and broad roads and bridges to mitigate congestions and jams is warranted. But, there are practical problems associated with availability of open space along with resources mobilization while widening of existing roads and construction of new ones are taken up. Hence, the solution lies in optimizing use of existing resources. The aim of ITS is to find solutions for transport related problems and optimize existing resources. [10]. |
| Design and execution of successful and efficient ITS system needs accurate and reliable traffic data. Traveller information system, highway and urban traffic management and parking management are some of the ITS applications which heavily rely on accurate real-time and past traffic data [11]. Large scale deployment of traffic control system is required to take maximum benefits from the ITS technologies. Presently there are various surveillance technologies in use such as: loop detector, video camera, infrared sensor, microwave radar, piezo- electric sensor, GPS etc. Their performance is acceptable but have some inherent serious defects such as: intrusive characteristics, high cost, line-ofsight, weather condition (ice, rains), operation during night or bad lights and high cost of installation and maintenance [4,12]. |
| WSN is the state-of-the-art technology, which can be used for remote information sensing, collection and dissemination. WSN has advantages such as: low cost, small size, wireless communication, scalability, flexibility in deployment configuration, multifunctional etc. Empowered with such features WSN can be a good candidate for traffic surveillance applications. The large scale deployment of ITS system is possible through the use of flexible and cost effective WSN based surveillance technology. |
III MATERIAL AND METHOD |
3.1 Anisotropic Magneto Resistive(AMR) Sensor: |
| Almost all vehicles are made-up of ferrous material such as steel, nickel, cobalt etc. Mother earth provides us with its magnetic field that permeates everything between the south and north poles. Earth’s magnetic field is nearly half gauss in magnetic flux density. Also the earth’s magnetic field gets disturbed by vehicles. A low field magnetic sensoris needed to pickup this field disturbance. Figure1 shows the lines of flux from the earth’s magnetic poles and the disturbance they receive as they penetrate a vehicle [13]. |
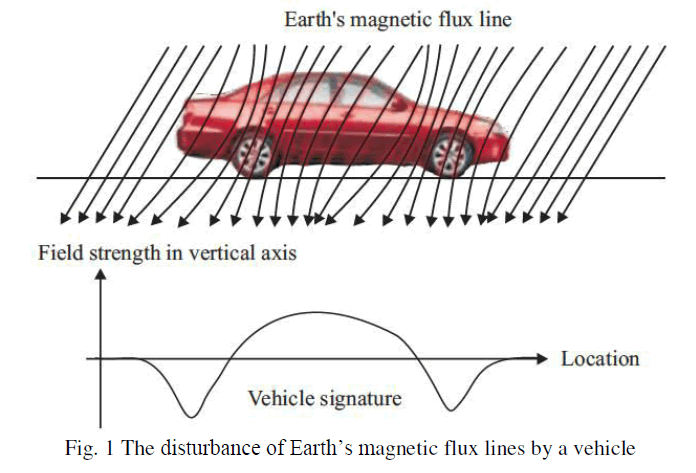 |
| The AMR sensor is able to detect such disturbance. The lines of magnetic flux get concentrated at the parts, where density of ferrous material is more, such as axles and main body,these results in distribution becoming sparser near the front and rear ends. AMR sensor is a directional sensor and provides only an amplitude response to magnetic field in its sensitive axis. By combining AMR sensors in two or three axis configuration a two or three dimensional measurement of magnetic field passing through the sensor is possible with excellent linearity.Hence such a sensor can be used in traffic surveillance applications. This sensor uses Wheatstone bridge device as shown in figure 2. |
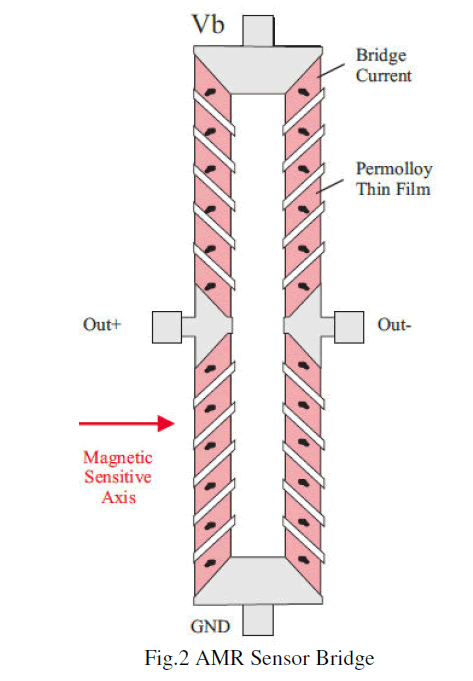 |
| The sensor is made-up of nickel-iron (Permalloy) thin film deposited on a silicon wafer and patterned as resistive strip element. A change in magnetic field leads to a change in resistance of bridge’s resistive elements, which subsequently lead to a change in bridge output voltage. If the bridge receives a positive change in magnetic field density or lines of magnetic field in sensitive axis, resistance of the vb to Out(+) and Out(-) to GND elements will slightly decrease while the resistance of other two elements will increase. As a result the voltage at the Out(+) terminal increases above Vb/2 and voltage at Out(-) terminal decreases below Vb/2.The voltage output from AMR sensor is measured between Out(+) and Out(-) terminals. |
| Differential output voltage = Out(+) - Out(-)= S xVb x Bs |
| Where S is the sensitivity of bridge in mv/v/gauss,Vb is the bridge supply voltage in volts and Bs represent the applied magnetic flux in the unit gauss. This output increases with the increasing magnetic field density in the sensitive direction. |
3.2 Vehicle Detection: |
| The AMR sensordetects the distortion of Earth’s magnetic field. As per the composition of ferrous material used in making a vehicle, its size, shape, speed and lateral distance from sensor, different magnetic signals are induced by different vehicles in AMR sensors. These particular magnetic signals for a particular vehicle is called magnetic signature of that vehicle. Vehicles of different classeshave significant variations in the amount of ferrous metals in their chassis (iron, steel, nickel, cobalt etc.). The magnetic field disturbances caused by a vehicle is sufficient to be detected by a magnetic sensor. This property of AMR sensor makes it a prospective candidate for vehicle detection, traffic surveillance, parking lot management, automatic toll collection, and law enforcement. These are the few important applications to mention that could use AMR sensors. |
| The effect of temperature on measurements from HMC1051Z magnetic sensor has been investigatedin the literature and found to beunavoidable [14].The temperature on road can change a lot in the course of day. This could pose aserious problem for traffic surveillance. This fact should be accounted for in the design of the vehicle detection algorithm. The signal available at the output of magnetic sensor has one bit of sensor noise out of ten bit signal resolution. So, there is no need of noise reduction. Signal smoothing is required to reduce unnecessary fluctuations. Adaptive Threshold Detection Algorithm (ATDA) is sufficiently robust to provide accurate detection in different working environments [15]. The “Over Threshold” Boolean flag, D (k), is generated by ATDA and passed to Detection State Machine (DSM). |
3.3 Detection State Machine: |
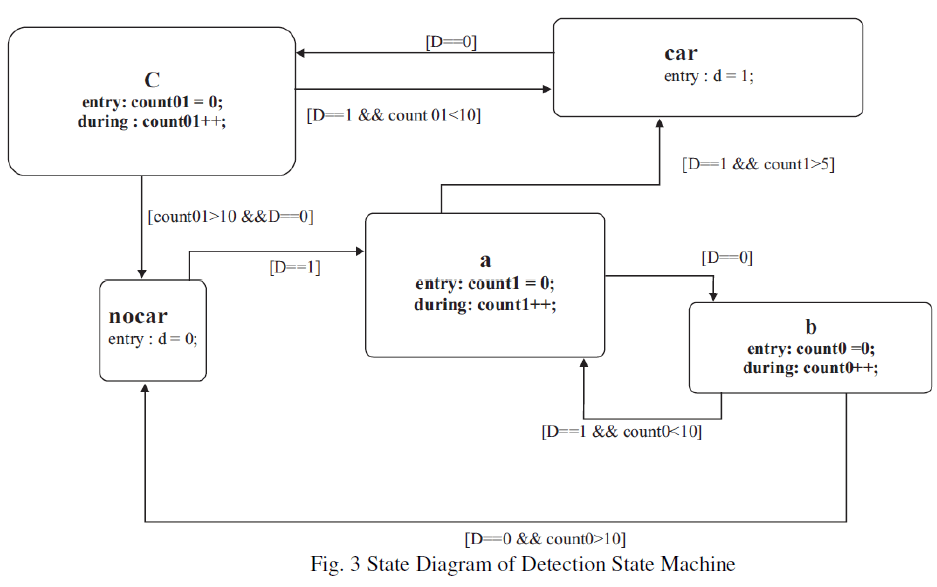
| The main objective of DSM is tofilter out spurious signals that are not generated by vehicle and to output true binary detection flagd(k). Following is description of DSM [16]. There is an uncontrollable drift in magnetic signal due to change in temperature. The rate of drift is very small. In order to remedy the drift in long term, the base line is to be made adaptive, which in turn tracks background magnetic reading. This is used to determine the adaptive threshold level of detection state machine. Input to the state machine is current time and over-threshold flag, D(k). Output of state machine is up-time, down-time and detection flag, d(k). |
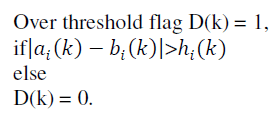 |
| Where, b(k) is adaptive base line, a(k) is smoothed magnetic signal, h(k) is threshold level and iis x, y or z axis. Following figure 3, shows the state diagram of DSM. |
 |
| State machine has following distinguished states: |
| (a) State ‘No Car’:After being reset the state machine implicitly enters this state and will start initializing the base line with background environment. After predefined initializing time it will start updating base line adaptively. Machine will jump to state ‘a’ if the magnetic measurement is larger than adaptive threshold level, i.e. if D(k) = 1. The timing of this event is recorded as prospective up-time, if this turns out to be valid vehicle detection, and saved for later use. |
| (b) State ‘a’: If vehicle magnetic signature produces continuous ones in D(k), andthe machine is in state ‘a’ then a counter, initialized with count = 00, starts counting up till D(k) =1. The state machine jumps to the state ‘car’ as soon as the counter reaches a predefined critical count value. Else, if a D(k) =0 is detected in between then the machine jumps to state ‘b’. |
| (c) State ‘b’: This state is entered to ensure that D(k) =0 is not a spurious event. This state is entered if D (k) =0 is detected in state ‘a’. When the state machine enters this state a counter, initialized with count = 00, starts counting up. From this state machine will jump to state ‘no car’, if D (k) = 0 is continuously recorded and the counter associated with state ‘b’ reaches a predefined critical count value, confirming D (k) = 0 is not an aberration. Else, if D (k) = 1 is recorded before the counter reaches predefined critical value, the state machine jumps back and again enters state ‘a’. |
| d) State ‘car’: Entry and stay in this state means vehicle is still travelling over the sensor node. Entry in this state generates the event d (k) = 1 (vehicle detection). In this state, if D (k) =0 is recorded then machine jumps to state ‘c’. |
| (e) State ‘c’: This state is entered from ‘car’ state, when D (k) =0 is recorded. At the entry of this state a separate counter, initialized at zero, starts counting up if machine receives continuous D (k) = 0. Furthermore, current time is recorded as potential, if proved true i.e. down time and saved for future use, end of detection event. When the counter reaches predefined critical value, state machine jumps to ‘no car’ state and in that state waits for next detection event to occur. Else, while in this state ‘c’ and before the counter reaches critical count value, if D (k) =1 is further recorded then the machine once again returns to state ‘car’. Further, recorded down time is erased. |
3.4 Data collection: |
| Federal Highway Administration (FHWA), of USA, classification scheme includes 13 classes of vehicles. It accounts for the main concerns of various transportation applications. Other schemes are derived by aggregating the FHWA scheme into fewer classes, with less emphasis on trucks and other commercial vehicles. FHWA scheme has following thirteen classes of vehicles: (1) Motorcycles (2) Passenger Cars (3) Four tyre single unit (4) Buses (5) Two axel six tyre single unit (6) Three axel single unit (7) Four or more axel single unit (8) Four or less axel single trailer (9) Five axel single trailer (10) Six or more axel single trailer (11) Five or less axel multi trailer (12) Six axel multi trailer (13) Seven or more axel multi trailer. |
| Some researchers encountered problems in distinguishing Passenger Car, SUV, Pickup trucks and Vans,while classifying vehicles in above thirteen classes [17]. Signals needed for classification of these categories are available in literature. The same signals and simulated ones are used in the presented work. For the signal simulation, signal builder tool of Simulink in MATLAB environment is used.It has been found, from literature, that generated vehicle signatures, of sufficient resolution, can be used for classification purpose.Furthermore, it is clarified that, the finer details of the signature are not of significant importance (10). |
3.5 Data processing: |
| A detailed signature has small short duration peaks and valleys. The signal needs to be smoothed as long as its shape, pattern and other crucial features are preserved. Data needs to be processed in order to extract most essential features of the signature required for its classification. These features are signature’s skewness, kurtosis and moment. |
3.6 Sampling rate estimation: |
| The shortest vehicle has minimum length of 2.5metre and the longest one’s length does not exceed 72 meter. Assuming vehicle can travel over sensor with minimum speed of 3 km/h and the maximum does not exceed 100 km/h. Minimum number of samples needed for classification be 10. Thus minimum time for which vehicle is over sensor comes to be 0.09 sec. Hence minimum sampling rate is 10/0.09 =111hz. |
3.7 System Organization: |
| The general process flow in the presented system is organized in four blocks: |
| (a) Signal preprocessing: In this block raw signal available at the output of sensor is smoothed. |
| (b) Signal Transformation: Using spline function the smoothed signal is interpolatedor extrapolated, so that each signature has a fixed vector size of 20 samples each. This makes the signature of the vehicle independent of variations in speed and length. |
| (c) Normalization: The signal is normalized, so that the variation in signal strength due to variation in lateral position of sensor placement vis- a-vis vehicle is eliminated. |
| (d) Feature Extraction: At this stage, features of the signature are extracted and fed to classifier. Classifier output is the class of vehicle from 1 to 5. |
3.8 Features of magnetic signature: |
| 1. Moment: Moment of the signal is defined as mk= E(x-u)^k where E(x) is the value of signal x and k is the order of central moment. Moments describe the shape of function about its mean independent of its geometric translation. |
| 2. Skewness: It is the measure of asymmetry of data around the sample mean. |
| 3. Kurtosis: it is a measure of outliers present in a distribution. |
3.9Vehicle Classification Using K-Nearest Neighbour Classifier: |
| K- Nearest Neighbour Classifier is a simple, but, powerful method for classification [18]. This algorithm is based on the principle that the test point that is close enough in instant space belongs to the same class. Given a set X of n points and a distance function D, the K nearest neighbour search allows one to find K closest point in X to a data sample. A data sample is classified as the majority class of its K nearest neighbours in training data set. The training of the algorithm means assigning the feature vectors of the training data set with their associated class labels. During actual classification distances from the test sample to all samples in training data set are computed. From this distance matrix K closest samples are selected. The class label, of the majority of the K closest sample, is assigned to the test samples. Euclidean distance, sum of absolute difference, correlation and hamming are some of the common distance calculation methods. Nearest, random and consensus are some decision making rules. Generally a large value of K reduces noise on classification, but the boundary between the classes become less distinct. |
IV. EXPERIMENT AND RESULTS |
| Representative magnetic signatures, used in the experimentation, for vehicle of different classes are shown in the table 1. |
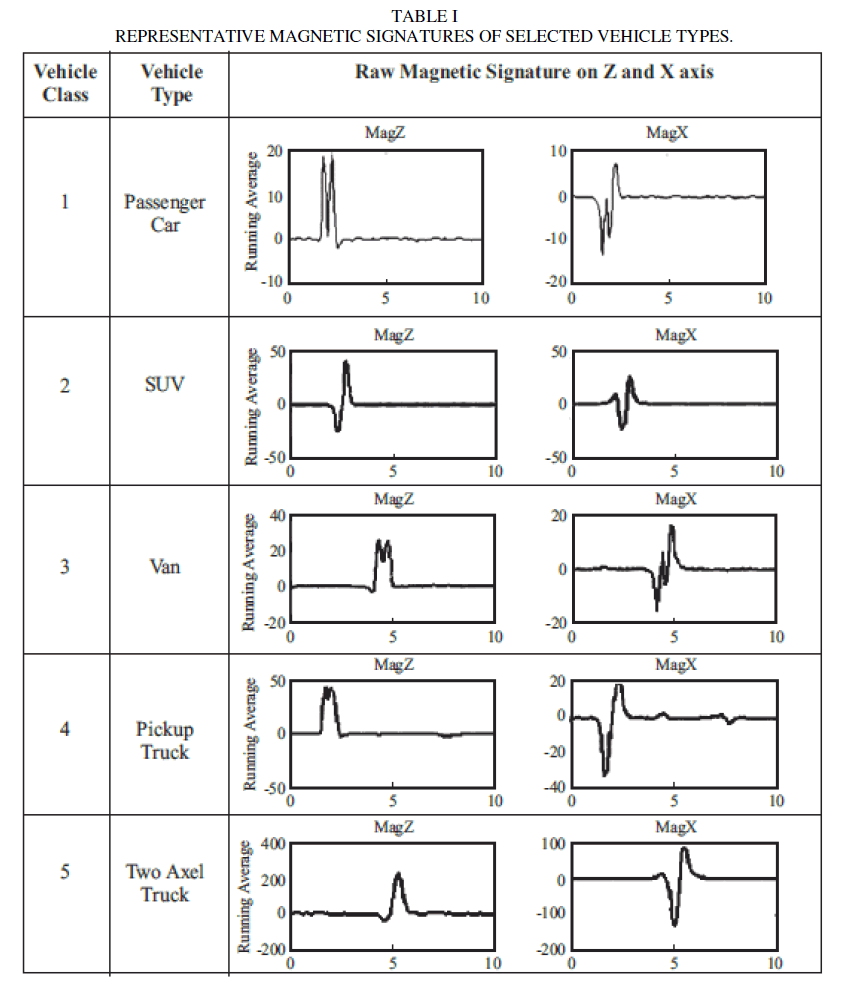 |
| As already stated that five vehicle types, namely, Passenger Car, SUV, Pickup trucks and Vans are difficult to distinguish using average bar and hill pattern algorithms. This is because such features are not sufficient enough for the purpose of classification.Hence,presentedexperimentation is zeroed in on classifying only these five vehicle types which have almost similar vehicle length, all with two axels and four tires, except length of two axel truck. Five vehicle types and their magnetic signatures on Z, and X axis are stored in the data bank. |
| In the simulation, 50 vehicle signatures from the data bank are used for the experimentation. The magnetic signatures of 25 vehicles have been generated for Z and X axis measurements. The distribution of vehicle in data set is shown in Table 2. |
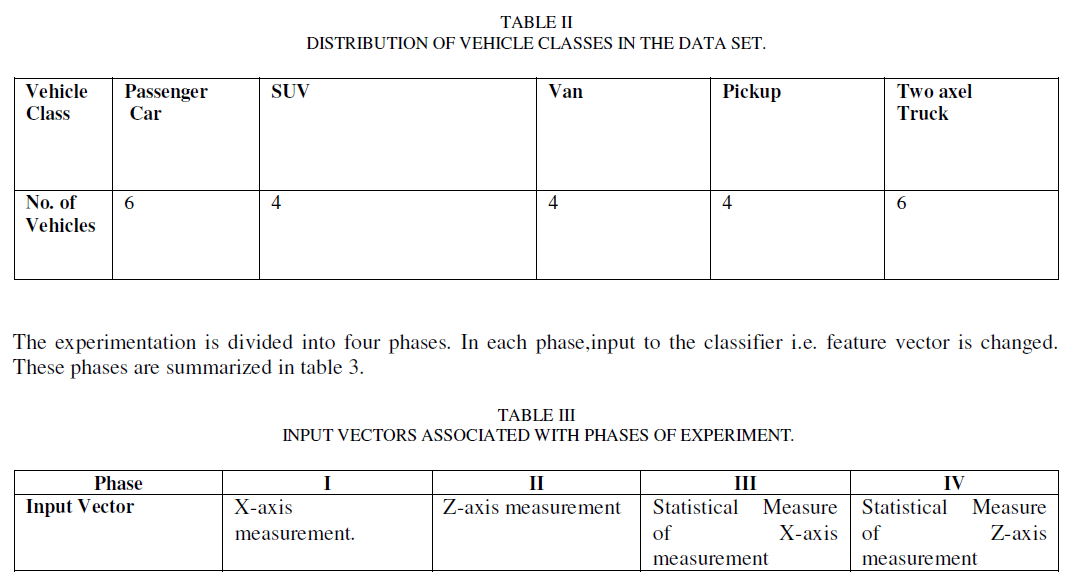 |
| The effect of this change in input of the classifier is observed and tabulated in the form of confusion matrix along with its graphical representation. |
Phase I: |
| In this phase of experiment the raw signature is smoothed, compressed or extrapolated as per requirement, and after normalization applied as input to K-NN classifier. |
| The confusion matrices for phase I of the experimentation is shown in table 4 and for the purpose of clarity, corresponding graphical output is depicted in figure 4. |
 |
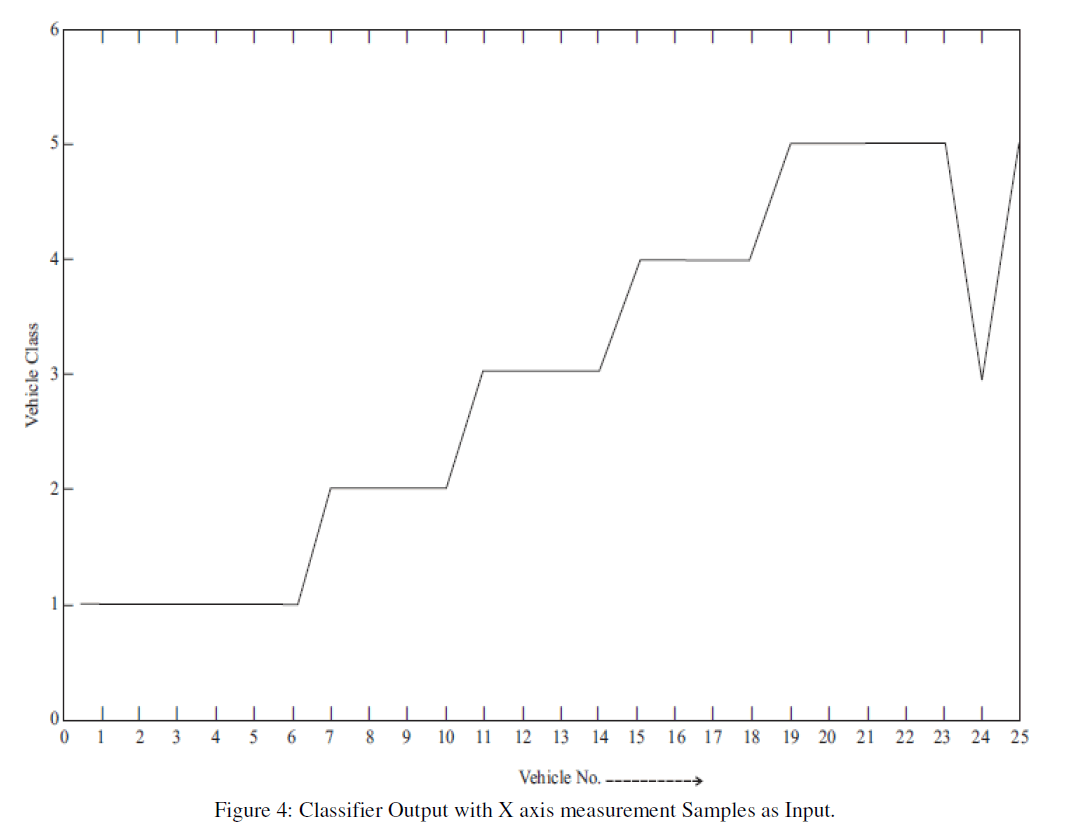 |
| The graph indicates that the output of classifier is ideal for four vehicle classes which is in the shape of ladder. Further, the confusion matrix and subsequent graph indicates that one of the six two axel trucks has been misclassified as van. From this it is possible to deduce that: |
 |
The phase II, III & IV: |
| In phase II of experiment X axis signature is smoothed, compressed or extrapolated as required, normalized and applied as input to classifier. Input vector size is kept as 20.In phase III of experiment X axis signature is smoothed, compressed or extrapolated if required and normalized. From this normalized signature kurtosis, moment, and skewnessare calculated and are fed to K-NN classifier. Input vector size is reduced to three.In phase IV of experiment Z axis signature is smoothed, compressed or extrapolated if required and normalized. From this normalized signature kurtosis, moment, and skewness are calculated and are fed to K-NN classifier. Input vector size is reduced to three. |
| The confusion matrices for phase II, III & IV of experimentation turn out to be identical. The matrix and corresponding graphical output is depicted in Table 5 and figure 5 respectively. |
 |
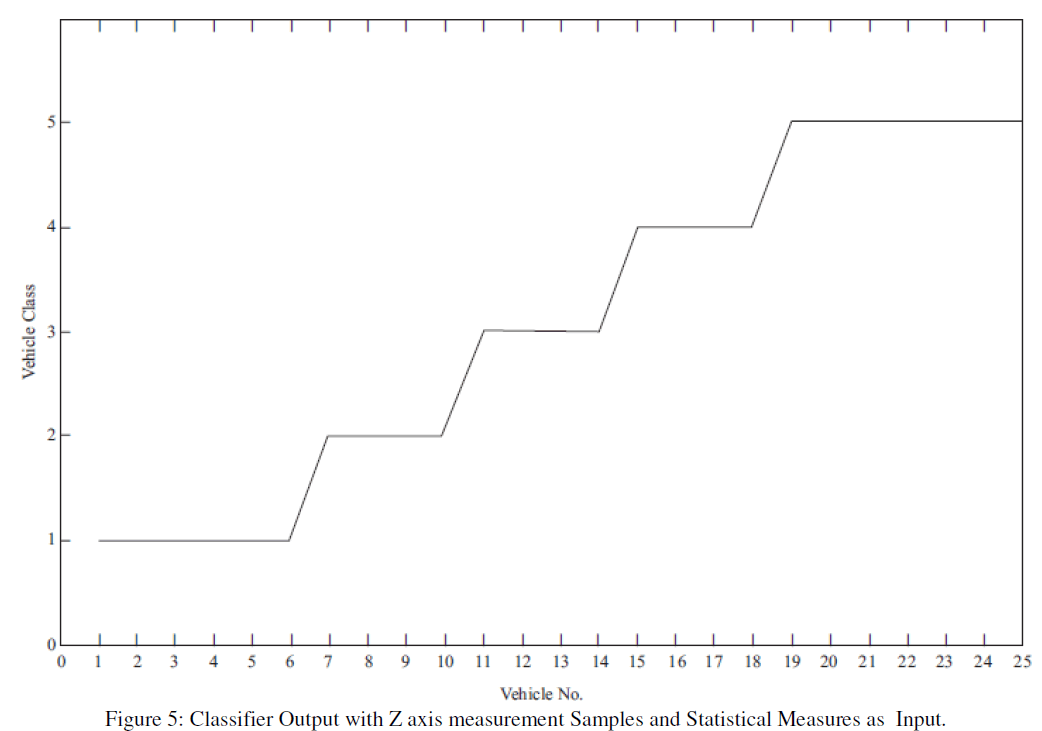 |
| It is evident from the confusion matrix and corresponding ladder diagram that, when the Z axis measurement samples and statistical measures (of Z and X axis measurement samples) are used as feature vectors, there is no misclassification of the vehicles. Further, from the confusion matrix it is possible to deduce that: |
| Moreover, it has been observed that, the length of the feature vectors gets drastically reduced, when statistical measurements are used as feature vector. . |
V. CONCLUSION |
| WSN has a potential to revolutionize ITS applications involved with information sensing, collection and dissemination. The paper developed a new vehicle detection and classification method using magnetic field distortion signals and K-nnclassifier. Presented method ismorerobust and accurate, with a potential to give way to traditional costly technologies such as loop detector in traffic surveillance. The sensor networks have higher configuration flexibility, which enables the system to be scalable and deployable everywhere in network. Vehicle class is an important factor for access management (prohibited area for some vehicle Classes, speedlimit, etc), law enforcement, research data collection, road traffic measurement and road maintenance. WSN Technology is the most attractive alternative option to vehicle detection and classification using contemporary technologies in use. WSN has inherent advantages over traditional technologies. A vehicle passing over or alongside of sensor generates a time-variant signal in measurement circuit. Signals generated by different classes of vehicles have difference in shape, magnitude, duration, and other statistical parameters. Such a magnetic signal, called magnetic signature of vehicle, is the basis for vehicle classification algorithm. |
| This paper proposes a simple, yet, powerful and automated system for real time vehicle classification. The approach is an improvisation and advancement of already developed algorithms. Presented algorithm is used for extraction of feature vectors. The experiment detects vehicles using detection state machine and classifies them through K-Nearest Neighbour algorithm. This classifier classifies the vehicles, into their stipulated classes, using its magnetic signature’s shape with nearly 100% accuracy. It has been verified that the algorithm enhances the performance of vehicle surveillance with high precision and robustness. |
References |
|