ISSN ONLINE(2320-9801) PRINT (2320-9798)
ISSN ONLINE(2320-9801) PRINT (2320-9798)
Kaushal Chauhan1, Mukta Takalikar2
|
| Related article at Pubmed, Scholar Google |
Visit for more related articles at International Journal of Innovative Research in Computer and Communication Engineering
Time Series data is a time oriented data, where each data item refers to a specific point measured typically at successive instances in time space. Streaming data is real time, potentially massive, rapid sequence of data information arriving continuously in ordered sequence of items. Various researches have been carried out that focused on representations which are processed in batch mode and visualize each value with almost equal dependability. In many domains recent information is more useful than older information. We call such incoming data as amnesic as it consists of greater value for data analysis. The dissertation proposed a novel system to monitor streaming amnesic time series data, handle data streams by using sliding window and memory management methods, summarizing the amnesic data with the help of weighted moving average algorithm. Final phase includes visualizing amnesic and summarized data streams in the form of dynamic line chart visualization and generating the reports of summarized data as snapshots, which eventually facilitates analysts to recognize various patterns underlying streaming time series data.
Keywords |
| Data Streams, Summarization, Amnesic, Time Series Data, Visualization. |
INTRODUCTION |
| Time-series data is vitally used in science, engineering and business. Visualization helps individuals interpret information by exploiting human perception and to scale the psychological feature of visuals. Statistical graphics, most notably line charts of time-value pairs, are heavily used for inspecting individual or tiny sets of time series [1]. However, understanding massive collections of time series data remains tough. We tend to elite large-scale system management as a site wherever individuals have to be compelled to perceive large sets of time-series information at multiple levels of detail and with reference to often ever-changing groupings [2] [3]. |
| Data warehouses for managed hosting services will store details regarding tens of thousands of physical and virtual servers. For every system, parameters like mainframe load and memory usage are often logged [4]. This information could also be archived for multiple years. System management employees should be ready to question elaborated information to attend to the wants of individual customers, whereas maintaining awareness of the managed environment’s global state [5]. |
RELATED WORK |
| Many infinite stream algorithms do not have obvious counterparts in the sliding window model. For instance, while computing the maximum value in an infinite stream is trivial, doing so in a sliding window of size N requires Ω (N) space; consider a sequence of non-increasing values, in which the maximum item is always expired when the window moves forward. Thus, the fundamental problem is that as new items arrive and old items must be instantaneously removed for further processing [6]. |
| Generally the time oriented data is the data that are linked to time. In the other sense we can assume that it is data generated with the time stamp. Certainly, this general description isn't sufficient once users need to select or developers need to develop applicable visualization ways. A vital demand for achieving communicative and effective visualization is to think about the characteristics of the information to be given, which, in our case, are significantly associated with the dimension of time. Various methods have been derived with respect to formulation on time in several areas of engineering, as well as AI, data processing, simulation, modelling, databases, and more [7].There exist many techniques for message type extraction and event identification. Most of these techniques make two to three scan over log file to generate message types and one pass to identify events using this message types[8]. |
| Using regular expression for each distinct token is one of these techniques. This has some disadvantages such as it requires full knowledge of system and is suited for log file containing few distinct events. As our focus is on log analysis this technique is useful as it is simple and take less time compared to other techniques [9]. |
| Traditional databases are utilized in applications that need persistent data storage and sophisticated querying. Usually, information consists of a collection of objects, with insertions, updates, and deletions occurring less frequently than queries. Queries are executed once entered and therefore the answer reflects this state of the database. Since previous few years had observed the emergence of applications that don't work this knowledge model and querying paradigm. Instead, data naturally happens within the variety of a sequence streaming values; examples embrace sensor data, net traffic, money tickers, on-line auctions, and transaction logs like internet usage logs and telephone records [10] [11]. |
| In addition to windowed sampling [14], a possible solution to computing sliding window queries in sub linear space is to divide the window into small portions called as basic windows [12] and only store a synopsis and a timestamp for each portion. When the timestamp of the oldest basic window expires, its synopsis is removed, a fresh window is added to the front, and the aggregate is incrementally recomputed. This method may be used to compute correlations between streams [12], Find frequently appearing items [15], and compute various aggregates [4] [16] are some of the operations performed on data streams. |
| However, some window statistics may not be incrementally computable from a set of synopses. The symmetric hash join and an analogous symmetric nested loop join may be extended to operate over two [19] or more sliding windows by periodically scanning the hash tables (or whole windows) and removing stale items. Interesting tradeoffs appear in that large hash tables are expensive to maintain if tuple expiration is performed too frequently [20]. Time series data can analyzed by applying various approximation methods, some of clustering techniques described in [29] gives better approaches for analysis and these streams after processing can be visualized by various visual methods to represented the time oriented data [30]. The appropriate visualization methods can be applied which are reviewed on the basis of various aspects such as visualization methods, types of variable, mapping techniques, dimensionality with reference to varying attributes of data streams [32] [33]. The dynamic and interactive visual have to be taken in consideration for user’s easy access and analytical purpose. Various visualization techniques for time series data streams present till date are briefly described and summarized in [34]. |
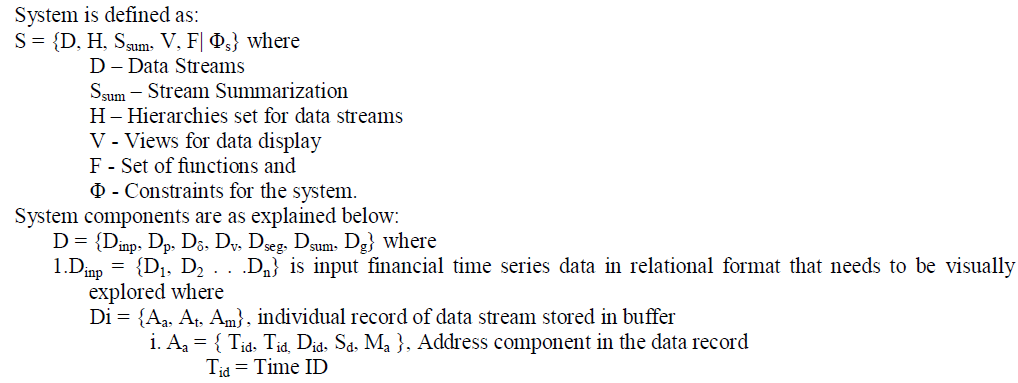
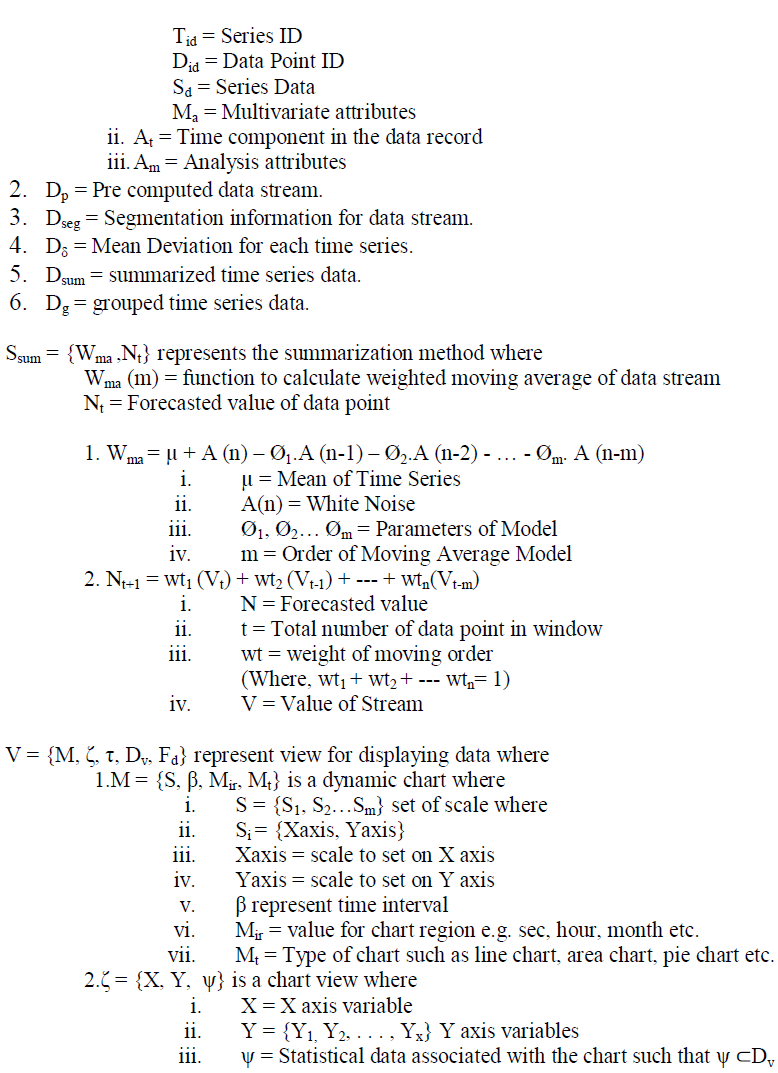
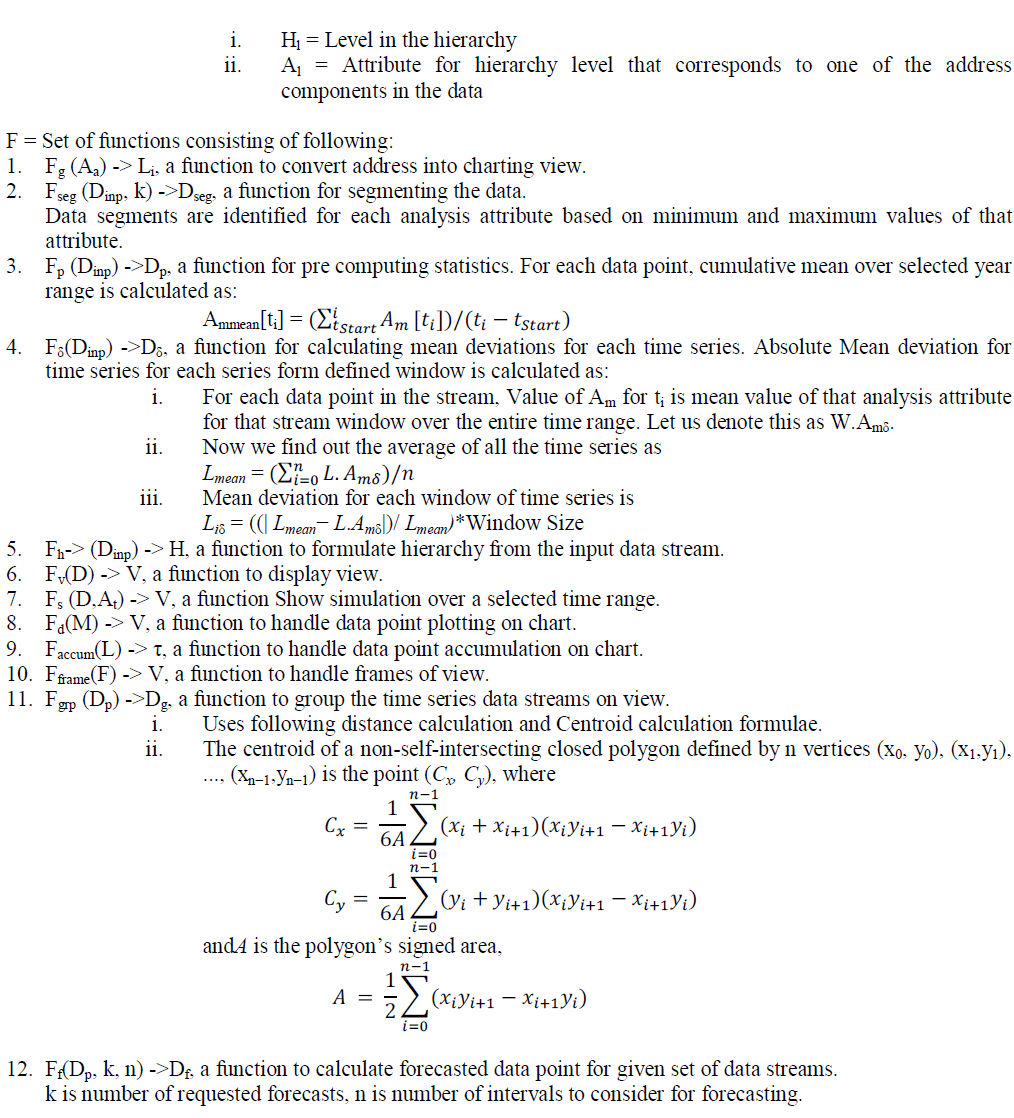
MATHEMATICAL MODELING |
 |
 |
 |
 |
Success: |
| Summarized Time Series Data Streams. |
| Interactive & Graphical Streaming Visualization in the form of dynamic Charts. |
Failure: |
| Errors in Time Series data streams beyond Threshold Level. |
| Graphical memory buffer over flow |
| Dynamic visual lags or slow in responsive. |
SIMULATION RESULTS |
| This section provides the performance and accuracy results of Time Series Visualization System. |
| 1.Display Time |
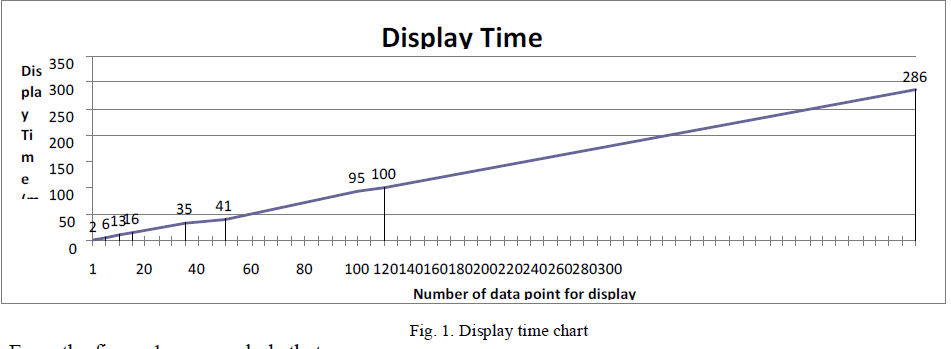 |
| From the figure 1, we conclude that: |
| To show a data point on chart, average display time is 1.2 ms. |
| As the number of data point increase, the display time per data point stabilizes and does not increase. |
| 2.Processing Time |
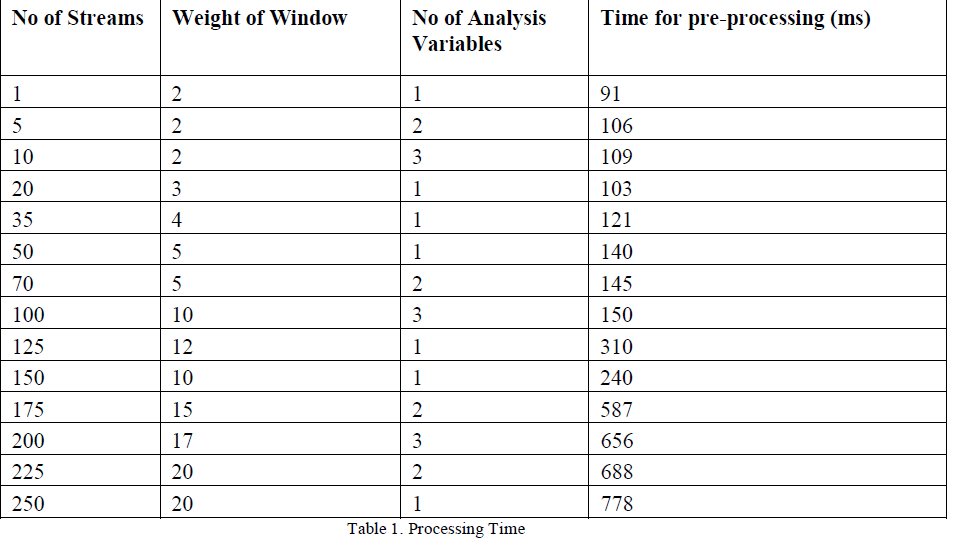 |
| From the data in table 1, we conclude that the time for pre-processing is directly proportional to the number of series and weight of window for which streaming data is present. The processing time also depends on the number of time intervals for which data is present and number of analysis variables; however number of hierarchy levels does not impact this time. |
| The performance has been tested with 360000 records with data for 200+ data streams. |
| 3.Data Point Plotting Time |
 |
| Conclusion: |
| Time for plotting depends on the number of the data points to be plotted. |
| 4.Summarization Accuracy |
| Weighted Moving Average and Exponential smoothing with trend are used for calculating summarization. MAPE (Mean Absolute Percent Error) is used to detect the accuracy. Less the MAPE % more accurate is summarization. |
| Figure 2 shows comparative analysis of both the methods. |
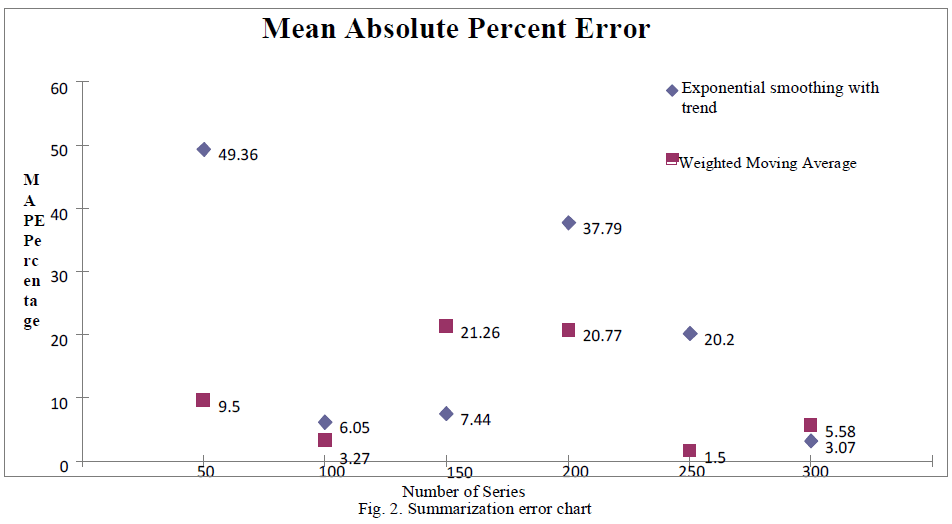 |
| From the chart above, it is observed that Weighted Moving Average has MAPE <= 20% and thus provides >= 80% accuracy. |
| Time series visualization system uses Weighted Moving Average will be able to provide 80% to 98.5% accurate summarization. If summarization is done in forward horizon, system could forecast the arriving data points with accuracy >=75%. Authors mention that 75% accurate results are acceptable [21]. |
| 5. User Interface developed for Visualization: |
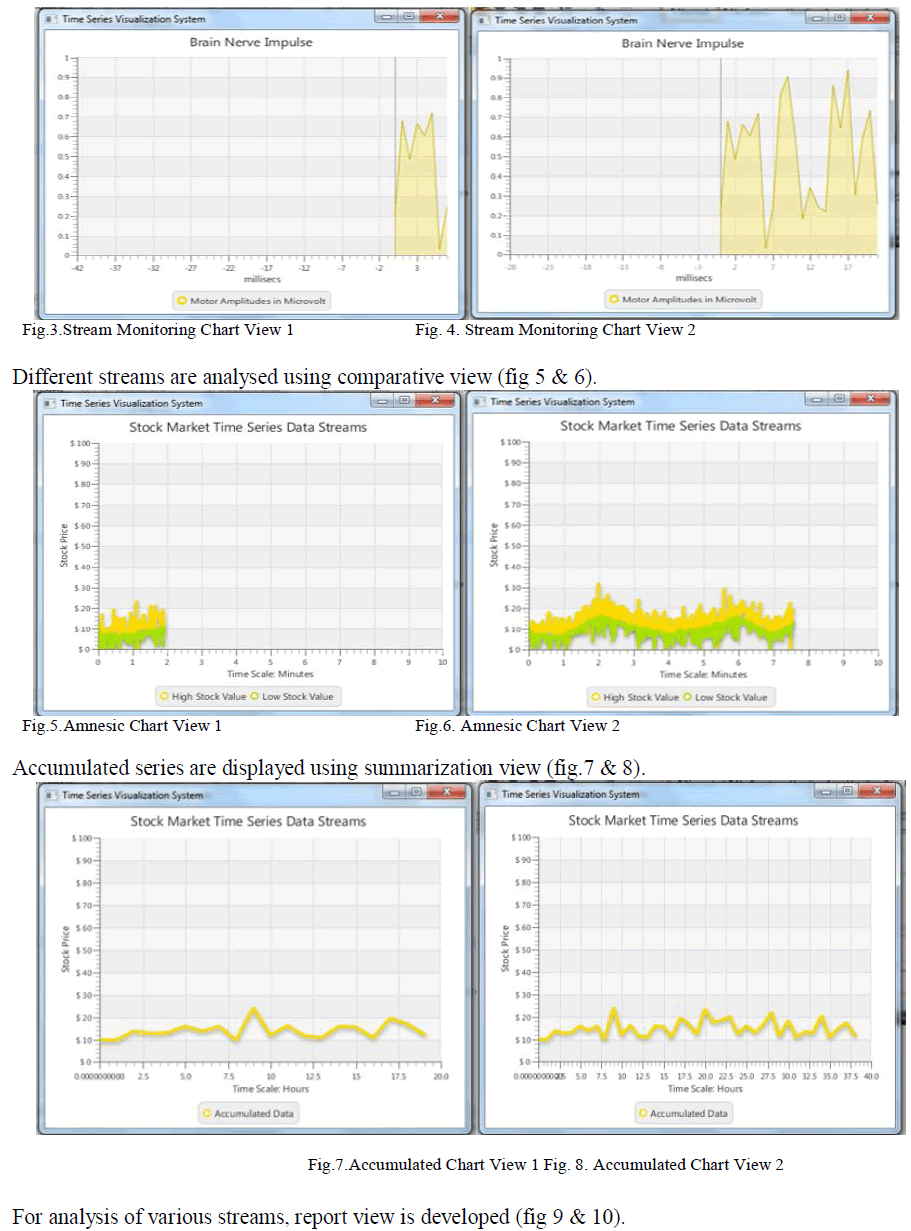
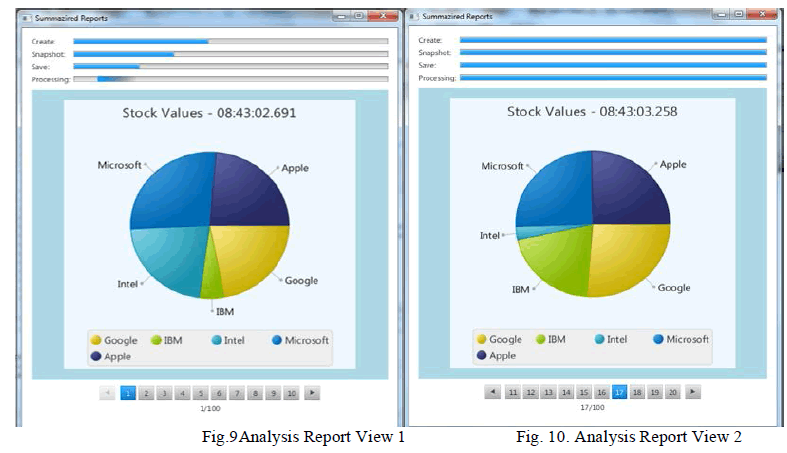
| The following charting components are developed to visualize an Amnesic data being monitored with monitoring view (fig. 3 & 4). |
 |
 |
CONCLUSION AND FUTURE WORK |
| The runtime view updating capability is lacking in many systems as these systems provide the static view in terms of charts; in contrast our system is dynamic and helps users in visual exploration. Accumulation functionality is new and not available in any other visualization systems. |
| Many tools exist for visual exploration; however our system provides capability to summarize in financial context which would be extremely useful for business analysts in decision making. Time series visualization system provides minimal display time by data pre-computing and hierarchical storage. |
| Summarization of data streams and accumulation of data points is implemented using weighted moving average with trend and such methodology is prerequisite for forecasting techniques. This is the default algorithm used by the system and user cannot select the algorithm to be used. System can be enhanced to provide the facility to choose forecasting algorithm and compare the results. |
| Future approach of the system would be to stream the visual on various portable devices such as mobile phones, tablets, desktops and personal computers. |
ACKNOWLEDGMENT |
| First Author express gratitude to his project manager Dinesh Apte for the useful comments, remarks and engagement through the learning process of this part of master thesis. This research is sponsored by SAS Research & Development (India) Pvt. Ltd. |
References |
|