Research & Reviews: Journal of Material Sciences
ISSN:2321-6212
ISSN:2321-6212
Deepika S Yawale1*, Jyoti Dawande3, SV Pakade2, Jagram Singh Yadav3, SP Yawale1
1Department of Organic Chemistry, Govt. Vidarbha Institute of Science and Humanities (Autonomous), Amravati, Maharastra, India
2Department of Organic Chemistry, Govt. Pre Indian Administrative Services Training Institute, Amravati, Maharastra, India
3Department of Organic Chemistry, Seth Ganga Sagar Jatia Government Polytechnic, Khurja, Uttar Pradesh, India
Received: 28-Dec-2022, Manuscript No. JOMS-23-84961; Editor assigned: 30-Dec-2022, PreQC No. JOMS-23-84961 (PQ); Reviewed: 13-Jan-2023, QC No. JOMS-23-84961; Revised: 27-Feb-2023, Manuscript No. JOMS-23-84961 (R); Published: 06-Mar-2023, DOI: 10.4172/2321-6212.11.2.006
Citation: Yawale DS, et al. Vogel Tamman-Fulcher (VTF) Conduction Mechanism in Polystyrene-AlCl3 Composites. RRJ Mater Sci. 2023;11:006.
Copyright: © 2023 Yawale DS, et al. This is an open-access article distributed under the terms of the Creative Commons Attribution License, which permits unrestricted use, distribution, and reproduction in any medium, provided the original author and source are credited.
Visit for more related articles at Research & Reviews: Journal of Material Sciences
The polystyrene AlCl3 composites thin films having different thickness are prepared, by using isothermal immersion technique. The dc electrical conductivity is studied in the temperature range 373 K to 319 K. The graph of log σ versus 1/T is plotted and activation energy ΔE is calculated for six different compositions AlCl3. It is found that conductivity increases, with increasing temperature and AlCl3 wt % in Polystyrene. The plots of log σ versus 1/T are non-linear and divided into two linear regions. In high temperature region Arrhenius law and in low temperature region Vogel Tamman-Fulcher (VTF) model is applied. From this model pseudo activation energy is calculated. The VTF model explains the results well. XRD spectra show that all the films are amorphous in nature. The FTIR spectra shows aromatic C=C stretching vibrations and existence of benzene rings.
Polystyrene; AlCl3; Dc conductivity; Pseudo activation energy; XRD; FTIR
Polystyrene is an aromatic polymer which commercially exploited for many day today applications. It is made from the aromatic monomer styrene, a liquid hydrocarbon. It is a thermoplastic substance, normally existed in solid state at room temperature. This would be used for preparation of electronics devices too if the electrical properties are tailored in proper manner. The electrical conductivity and Thermally Stimulated Discharge Currents (TSDC) in such types of materials can be studied. Yawale, et al., have studied Poly-Vinyl Chloride (PVC) in virgin and electret thin film. They revealed that the V-I characteristics of the films at different temperatures possess three distinct regions as Ohmic, square law and power regions. In the square law region, space charge limited conduction is observed. The possibility of Poole-Frenkel or Richardson-Schottky mechanism is also studied by them. The electrical conductivity is found to be increases with decreasing thickness. TSDC shows single relaxation peak which is due to rotation of dipolar group at peak temperature.
The development of conductive polymer composites remains an important endeavor in the light of growing energy concerns. Graphite (G), Carbon Fiber (CF) and G/CF mixtures are added to High Density Poly-Ethylene (HDPE) to discern if mixed fillers afford appreciable advantages over single fillers. The effects of filler type and composition on electrical conductivity, composite morphology and mechanical properties have been examined and correlated to establish structure property relationships [1].
Effects of anhydrous AlCl3 dopant on the structural, optical and electrical properties of PVA–PVP polymer composite films revealed that the values of optical absorption coefficient, direct and indirect optical band gaps are found to decrease with increase in AlCl3 concentration. The low conductivity relaxation time with Al doping is reported. Electrically conductive Poly-Styrene (PS) nano-composites incorporated by non-covalently surface modified Carbon Nanotubes (CNTs) with hydrophilic polymers such as Polydopamine (PDA) and Poly(3,4-Ethylene Di-Oxy Thiophene): Poly(Styrene Sulfonate) (PEDOT:PSS) has been studied by Jae Phil Song, et al. Effect of addition of Ferric Chloride (FeCl3) on electrical conductivity of polystyrene has been studied by Raheem Al-Marshedy, et al. They observed that the electrical conductivity is thickness as well as concentration dependent. The aim of the present work is to study the effect of additive AlCl3 on the electrical conduction mechanism and the structure [2].
Theory
Electrical conduction in solids depends on carrier mobility, carrier concentration, injection conditions at the electrodes, etc. In case of polymers, polar on hopping conduction, Poole Frenkel, space charge limited conduction and variable range hopping conduction are of great importance. Mostly in polymers polar on hopping conduction and space charge limited conduction has dominance [3].
Polar on hopping model
The dcconductivity for the hopping of polarons in non-adiabatic approximation is given by Mott.
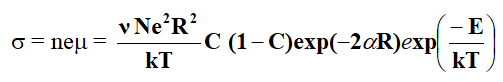
Where, N is the number of ion sites per unit volume which is the ratio of the ion concentration in the low valence state to the total concentration of metal ions, exp(-αR) represent electron overlap integral between sites and E is the activation energy. Assuming the strong electron lattice interaction exists, the activation energy E is the result of polar on formation with binding energy EH and any energy difference ED which might exist between the initial and final sites due to variations of the local arrangements of ions. Thus activation energy is Austin and Mott [4].
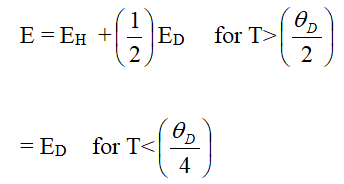
Where EH is the polar on hopping energy, ED is the disorder energy arising from the energy difference between two neighboring sites and θD is the Debye temperature.
The polar on hopping energy EH is given by,
EH=EP/2
Where Ep is the polar on binding energy.
The polar on hopping energy EH calculated from theory is given by,
Where εs and ε∞ are the static and high frequency dielectric constants of material respectively, εp is effective dielectric constant, rp is the polar on radius, which can be estimated from the site spacing R (for the crystalline solids).
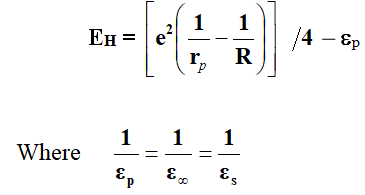
Variable range hopping
For the variable range hopping, Mott, et al., have suggested the thermally activated hopping conduction which occurs due to electrons in states near the Fermi energy. The hopping probability is given by,
Richardson-Schottky and Poole–Frenkel type conduction
In insulators or semi-insulators electrical conduction processes is described by conventional Richardson-Schottky or Poole–Frenkel mechanisms. The V-I characteristics determine these mechanisms as,
Where I signifies the steady state current.
The Richardson-Schottky (RS) and Poole-Frenkel (PF) mechanisms occur from lowering of columbic potential barrier by the applied electric field. The Schottky effect is observed at the surface of metal and semiconductor whereas PF effect in the bulk materials [5]. Assuming small dielectric relaxation time and sufficient high applied voltage, the current flowing across the barrier is given by the RS expression,
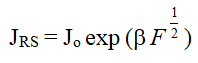
Where JRS is the current density in A/m2 and F is the electric field applied.
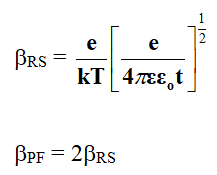
Where, ε is the dielectric constant of the film, t is the thickness of film, ε0 is the permittivity of free space and e is the charge on electron.
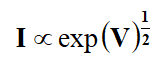
As per theory of RS and PF, the equation is only valid in square law region, where I∝V2. Initially in I-V characteristics, conduction is found to be Ohmic (I∝V) which is called first region. In the second region, a trapped square law is followed (I∝V2) and in third region, I∝Vn (n ≥ 5) is observed. The PF and RS mechanisms are always observed in a trapped square law region. The space charge limited conduction in thin film can be determined by plotting current density (J) against the thickness of the film at constant temperature which shows linear nature [6].
The ratio between free electrons no in conduction band to the total electron density (no+n1), where n1 being density of trapped electrons is given by Subbarayan, et al.
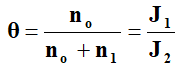
Where, J1 and J2 are current densities at the beginning and at the end of the rise in the square law region respectively. So experimentally the value of θ can be determined.
The equilibrium concentration of charge carriers in the conduction band is given by,
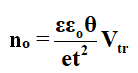
Where, Vtr is the voltage at which transition from Ohmic to square law region takes place and t is the thickness of the film.
Using this equation, no can be calculated. The relation between θ and temperature T is given by,
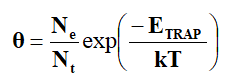
Where, Ne is the effective density of states in conduction band and Nt is the density of shallow traps positioned at the energy ETRAP below the conduction band edge.
The trap energy can be calculated from the slope of log σ against 1/T.
Ionic conductivity
Most of the polymer and their composites follow the Vogel Tamman-Fulcher (VTF) equation is given by,
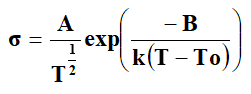
Where ‘T’ is the absolute temperature, ‘A’, ‘B’ and ‘To’ are the fitting constants and ‘k’ is the Boltzmann constant. ‘A’ is the pre-exponential factor, which is related to the number of charge carriers. ‘B’ is the pseudo activation energy related to activation energy of the ion transport. It is related to critical volume for displacement in free volume model and to the energy barrier for rotational motion of polymer segment in configuration entropy model. ‘To’ is the critical (ideal glass transition Tg) temperature usually it is 30-50 K below ‘Tg’. It is the temperature at which configuration entropy or free volume disappears [7]. In polymer electrolyte systems, the Arrhenius equation is given by
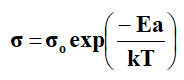
Which fits the region above Tc, where ‘Ea’ is the activation energy and σo is the pre-exponential factor.
Experimental
Preparation method (film formation): The isothermal immersion technique is used for the preparation of polystyrene film. Optically plane glass plate made of high quality glass was used. Dioxane was used as a solvent in the present work. Further slow vaporization can also be achieved by allowing the films to dry in the atmosphere of solvent itself.
The sample polymer (Polystyrene) is weighted about 4 g using a monopan balance supplied by K. Roy and Co., Varanasi, India with sensitivity of ± 0.01 mg and dissolved in 20 ml dioxane and stirred it constantly. AlCl3 is weighed about 0.01 g using monopan balance and then taken it in 10 ml acetone and stirred it constantly. Then 1 ml solution is taken from combination of AlCl3 and acetone, introduced into the 5 ml combination solution of polystyrene and dioxane. The chemically clean optically plane glass plate mounted on a stand with leveling screws is placed on a table and adjusted to be perfectly horizontal by using spirit level [8].
The solution of AlCl3 doped polystyrene so prepared is then poured uniformly on the glass plate. The solution spread over evenly on the glass plate, glass plate is left undisturbed for about 24 h at constant temperature. The film of AlCl3 doped polystyrene is formed on the glass plate. Small pieces of film are then removed simply by stripping.
The films of different thickness are prepared by changing the amount of solvent as 2, 3, 4, 5 and 6 ml. Above process is repeated for 5 ml polystyrene solution [9].
Measurements and Characterization
DC electrical conductivity: The dc electrical conductivity of polystyrene was measured by finding its resistance. The resistance of the film was measured by using a voltage drop method. The circuit consists of a dc regulated power supply and a digital picoammeter (Scientific equipment, DPA III, India) having accuracy of 1 PA. By measuring voltage and current across the sample, the resistance can directly be calculated by using Ohm’s law. Knowing the resistance and dimensions of electrode, the dc conductivity is calculated [10]. These measurements were made in the temperature range from 373 to 319 K.
The graphs are plotted between log σ and 1/T and activation energies are calculated by finding the slope of straight line.
XRD: XRD investigation of the films has been obtained from Vishveshwarayya National Institute of Technology, Nagpur. Absence of peaks shows the amorphous nature of the samples [11].
FTIR: The structural investigation of the films has been made with the help of Fourier Transform Infrared Spectra (FTIR) at VNIT, Nagpur in the wavelength range of 650 cm-1 to 4000 cm-1.
The X-ray Diffraction (XRD) spectra of the film shows that the structure of polystyrene composite is completely amorphous in nature as peak is absent in intensity versus 2θ curve. The hump at 2θ=20o is due to scattering background and polystyrene have some crystallinity.
The Fourier Transform Infrared (FTIR) spectra of the samples is obtained in the wave number range of 650 cm-1-4000 cm-1. The corresponding peak frequencies of the various groups are tabulated in Table 1 for all composites. From theFTIR spectra it is observed that the peaks obtained between the frequency range from 600 cm-1 to 900 cm-1 showspresence of halogen i.e. chlorine. The peaks obtained in frequency range of 3024 to 3025 cm-1 corresponds to aromatic (C-H) stretching and peaks in the frequency range of 2880 to 2900 cm-1 are due to aliphatic (-CH-CH2-) stretching. The peaks obtained at 1451 cm-1, 1492 cm-1 and 1602 cm-1 are due to aromatic C=C stretching vibrations. The frequency range of 1451 cm-1 to 1656 cm-1 show some peaks corresponds to polystyrene. It is observed that the strong peaks are seen at 694 cm-1 and 748 cm-1 corresponds to C=H out of plane bending vibrations and shows there is only one substituent in the benzene ring (Figures 1 and 2). The vibrations in frequency range of 694 cm-1 to 900 cm-1 are mostly associated with halogen. Polystyrene has natural affinity to interact with AlCl3 (Lewis Acid). Chlorine of AlCl3 acts as an electrophile hence it always tries to attack on unsaturated carbons or establish an electrostatic linkage with hydrogen atom of hydrocarbons. From above discussion it appears that the following possible blends/composites are formed as in reaction (a) or (b).
| Sr. No | AlCl3 (wt%) | Peak frequencies (cm–1) | ||||||||||||||
|---|---|---|---|---|---|---|---|---|---|---|---|---|---|---|---|---|
| 1 | 31.37 | 694.4 | 748.42 | - | 906.19 | 1028.69 | - | 1371.12 | 1451.59 | 1492.38 | 1582.52 | 1602.25 | 1654.02 | - | 2882.78 | 3025.24 |
| 2 | 47.76 | 694.44 | 748.36 | 874.06 | 906.34 | 1028.48 | - | 1371.61 | 1451.78 | 1492.44 | 1582.55 | 1601.83 | - | - | 2900.9 | 3025.23 |
| 3 | 57.83 | 694.43 | 748.2 | 873.96 | 906.21 | 1028.58 | 1121.05 | 1370.77 | 1451.53 | 1492.21 | 1582.31 | 1602.06 | 1654.48 | 1942.9 | 2881.53 | 3024.79 |
| 4 | 64.65 | 694.35 | 748.43 | - | 905.8 | 1029.12 | - | - | 1451.62 | 1492.45 | 1582.11 | - | 1656.8 | 1942.02 | 2882.14 | 3025.19 |
| 5 | 69.57 | 694.32 | 748.23 | 906.05 | 1028.6 | - | - | 1451.69 | 1492.41 | - | 1601.85 | - | - | 2900.93 | 3025.36 | |
| 6 | 73.28 | 694.29 | 748.2 | 906 | - | 1028.49 | - | - | 1451.7 | 1492.34 | - | 1601.06 | - | - | 3024.88 | |
Table 1. Peak frequencies (cm-1) for different AlCl3 (wt%).

Figure 1: XRD spectra.

Figure 2: FTIR spectra.
The variation of conductivity (log σ) with temperature (1/T) is shown in Figure 3. It is found that conductivity increases with increase in temperature. This plot is non-linear and can be divided into two linear regions only. As the equation not followed hence Richardson-Schottky or Poole–Frenkel mechanism theory is not applicable. In high temperature region Arrhenius equation is satisfied whereas at low temperature region these plots follow VTF equation. From these plots the knee temperature called ‘Tc’ is determined for each film of polystyrene composite. VTF model is applied at low temperature region and examines the validity of equation.

Figure 3: log σ vs. 1/T for different AlCl3 wt%.
This equation can be explored by finding the plot of log (σT1/2) against 1/(T-To) which is linear. Where ‘To’ be the characteristic temperature which is 30 K to 50 K below glass transition temperature, B is the pseudo activation energy which is related to the ion transport. It is related to critical volume for displacement in free volume model and to the energy barrier for rotational motion of polymer segment in configuration entropy model. A is the pre-exponential factor.
The plot of log (σT1/2) against 1/(T-T ) is shown in Figure 4 which is linear for all the composite films and the best fitted parameters are evaluated from these plots which are reported in Table 2. The value of pseudo activation energy B is found to be very small of the order of 0.001eV. The knee temperature is around 345 K.
The variation conductivity (log σ) at constant temperature with AlCl3 wt% is shown in Figure 5. It is observed that the electrical conductivity increases with AlCl3 wt%.
| Sr. No. | Concentration of AlCl3 (wt%) | Activation energy ΔE (eV) from log σ vs. 1/T | Knee temperature Tc (K) | Pre exponential factor A (SK½ cm-1) | Pseudo activation energy B (eV) |
|---|---|---|---|---|---|
| 1 | 31.37 | 0.206 | 349 | 1.31 x 10⁻⁵ | 0.0008 |
| 2 | 47.76 | 0.225 | 347 | 1.23 x 10⁻⁵ | 0.001 |
| 3 | 57.83 | 0.241 | 343 | 1.00 x 10⁻⁵ | 0.001 |
| 4 | 64.65 | 0.338 | 347 | 9.69 x 10⁻⁶ | 0.0014 |
| 5 | 69.57 | 0.365 | 343 | 8.47 x 10⁻⁶ | 0.0017 |
| 6 | 73.28 | 0.373 | 339 | 7.71 x 10⁻⁶ | 0.0021 |
Table 2. Arrhenius and VTF equation fitting parameters obtained for Polystyrene films of different concentration of AlCl3.

Figure 4: VTF plots for different AlCl3 wt%.

Figure 5: Variation of log σ at 50°C with AlCl3 (wt%).
The activation energy (ΔE) for different wt% of AlCl3 are calculated from the plot of log σ versus 1/T and tabulated in the Table 2.
The graph is plotted between activation energy (ΔE) and wt% of AlCl3 as shown in Figure 6. From this graph it is observed that, activation energy (ΔE) increases with increase in wt% of AlCl3.

Figure 6: Variation of activation energy ΔE with AlCl3 (wt%).
Actually AlCl3 is highly efficient polymer supported catalyst. It is water sensitive and corrosive compound but when mixed with polystyrene the composite become stable and water tolerant. Though it catalyst in some reactions but the role AlCl3 is different here it participate in conduction mechanism and conduction occurs via charge transfer or segmental motion mechanism. The effect of strong Lewis acid i.e electron pair acceptor is important. In amorphous polymers the ion transport viewed as liquid like mechanism where long range ion transport occurs through local frictional environment. In most of the polymers the ionic conductivity mostly described by two types of mechanism viz i)segmental chain motion and ii) the ion hopping transport. The glassy or amorphous material possesses electron orthe ion hopping of charges/ions. But in case of polymer–electrolyte amorphous materials or composites the segmentalchain motion is dominant through which the ion conduction takes place. The segments of the polymer chain move freevolume sites which are available. The polymer chain segments create free volume sites for ion motion this mechanismis mediated transport via VTF equation.
The XRD spectra of the composite films show that the structure of polystyrene is completely amorphous as no peak is observed in intensity versus 2θ curve of XRD.
Structural investigation is made with the help of FTIR in the range 650 cm-1 to 4000 cm-1. From this it is found that peaks found in the frequency range from 3024 cm-1 to 3025 cm-1 are associated with the presence of aromatic (C-H) group. The aliphatic (-CH-CH2-) group is seems to be present due to appearance of peaks in the frequency range 2880 to 2900 cm-1. The polystyrene group is confirmed from peaks appear in the range of 1451 cm-1 to 1656 cm-1. The peaks in the range of 694 to 900 cm-1 show presence of halogen group.
The electrical conductivity of AlCl3 doped polystyrene film increases with increase in temperature and AlCl3 concentration. For the calculation of activation energy, initial rise method is used. The activation energy calculated from initial rise method and log σ versus 1/T plot is found to be in the order of 0.206 to 0.373 eV. VTF model is applied to evaluate the pseudo activation energy.
Authors are very much thankful to the Director, Govt. Vidarbha Institute of Science and Humanities, Amravati for providing the laboratory facilities.