International Journal of Advanced Research in Electrical, Electronics and Instrumentation Engineering
ISSN ONLINE(2278-8875) PRINT (2320-3765)
ISSN ONLINE(2278-8875) PRINT (2320-3765)
Swetha G C1, H.R.Sudarshana Reddy 2
|
| Related article at Pubmed, Scholar Google |
Visit for more related articles at International Journal of Advanced Research in Electrical, Electronics and Instrumentation Engineering
In present days, electrical load demand is growing day by day and in order to meet the increasing electrical load demand, power generating plants are operating their plants at their maximum capacity. So there is always a risk of voltage collapse, which will cause the shutdown of entire power system and its block out, which will cause an inconvenience to the customers and great losses to the power utility companies. It is always a better practice to know about the weakest elements in the system and weakest buses and their maximum loading limit. The objective of this paper is to evaluate the reliability using artificial neural network (ANN) in voltage stability assessment to determine secure/insecure state of the power system. The input data of ANN are derived from offline Newton-Raphson (NR) load flow analysis in MATLAB environment. The result obtained from the ANN method is compared with the NR load flow analysis in terms of accuracy to predict the status of the system. The proposed method has been tested using IEEE data test and shows it effectiveness in assessing the voltage stability in large network using ANN by predicting voltage stability indicator
Keywords |
| Newton Raphson (NR) load flow, Voltage stability assessment, feed forward neural network, fast voltage stability indicator (FVSI) |
INTRODUCTION |
| In recent years, several blackouts related to voltage stability problems have occurred in many countries. In particular, 2003 was an intense year regarding blackouts with a total of 6 major ones affecting the US, the UK, Denmark, Sweden and Italy. This is due to increase in demand for electric power resulted in increasingly complex interconnected systems, forced to operate closer to their limits of stability calls for voltage stability assessment. |
| There are two important aspects in voltage stability studies. They are: (1) voltage stability assessment, i.e. accurately quantifying voltage stability margin; (2) voltage instability mechanisms analysis, including identifying areas and buses most susceptible to voltage collapse. |
| In recent years, a number of algorithms have been proposed to calculate voltage stability margin by power flow calculations, continuation methods were used in [3, 4] to search for the voltage collapse point and evaluates loadability. Even the continuation methods can give more accurate results, but the speed of the methods is a drawback for on-line voltage stability assessment. The application of optimization techniques in reactive margin calculation were presented in [5–6]. Some of the literatures in [10, 11] utilised the voltage stability indices referred either to a bus or to a line as an indicator to voltage collapse. Some other methods like Q–V curve can be found in [2, 7]. For voltage instability analysis, singular value decomposition (SVD) [8] and modal (eigenvalue) analysis are accepted as powerful tools to identify the weakest points and the most sensitive elements in terms of voltage stability. In modern power system operation, information such as loadability and voltage instability mechanisms are becoming vitally important to operators in control centres. This means that the operators need to know not only the weakness of the system but also the mechanisms which cause voltage instability. |
| Presently, artificial neural networks (ANNs) has gained a lot of interest from researchers in recent years as a tool for voltage stability assessment [9].Due to its ability to do parallel data processing with high accuracy and fast response.ANN can learn complex non-linear relationships through set of input/output examples. Also they have been successfully applied to some power system problems where difficulties have been experienced with conventional techniques. Most of the published work in the area of voltage stability analysis is based on multi-layer feed-forward networks trained by back propagation (BP) for quantifying stability margins. However, in respect of voltage stability assessment of practical systems, a major difficulty of this type of neural networks is that it depends highly on the number of training data because the network itself does not take into account the properties of input data. Thus a large number of inputs are needed. |
| In the present work, a single Feed Forward neural Network (FFNN) with minimal neurons are used to provide an estimate of the line stability index for various load conditions. Selected load variations are used as the input to the FFNN and the available line stability factor is used as an indicator to the status of the system. The proposed scheme has the ability to get adaptive training when subjected to any new training pattern, where the ANN has been exploited to predict the FVSI results for any unseen loading condition of the system. The voltage stability assessment using line voltage stability index is applied to the 5-bus, IEEE 14 bus and the IEEE 30 bus power system, and the test results are presented. |
| The paper is organized as follows. First, the mathematical model of fast voltage stability indicator (FVSI) approach is briefly discussed. Then, the structure of the neural network is presented. Last, the proposed method is tested on the 5- bus, IEEE 14 bus and IEEE 30 bus system. |
MATHEMATICAL MODEL |
| In voltage stability analysis, it is useful to assess voltage stability of power systems by means of voltage stability indices (VSI), scalar magnitudes that can be monitored as system parameters change. Operators can use these indices to know how close the system is to voltage collapse in an intuitive manner and react accordingly. |
A. Proposed FVSI (Fast Voltage Stability Indicator) |
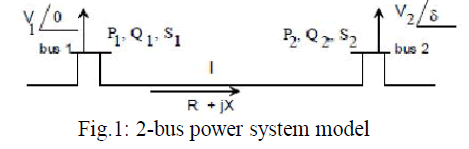
| A novel line voltage stability index termed as Fast Voltage Stability Index (FVSI), which is used to indicate the voltage stability condition formulated based on line or bus [12].The FVSI is derived from the voltage quadratic equation at the receiving bus on a 2-bus power system model. Figure 1 illustrates the 2-bus power system model. |
 |
 |
 |
| Any line in the system that exhibits FVSI close to 1.00 indicates that the particular line is approaching to its instability point hence may lead to system violation. Therefore, FVSI has to be maintained less than unity in order to maintain a stable system. |
ARTIFICIAL NEURAL NETWORK (ANN) |
| ANN implementation is used to design the best ANN configuration. And the best configuration is used to predict the status of 5-bus, IEEE 14 bus and IEEE 30 bus system. The process of ANN implementation starts from data collection and ends with the Performance evaluation of ANN. Percentages of classification accuracy and mean square error are used to represent the performance of ANN in terms of accuracy to predict the status of the different IEEE bus system. |
A. Generation of training data |
| Input data sets for ANN training are generated from offline Newton-Raphson load flow analysis by varying both real and reactive loads at all the buses randomly in the range of 5% to100% and -10% to -100% of their base case value. In data collection, the input data are divided into train data, validation data and test data. NR load flow analysis is conducted at all steps and corresponding voltage stability indicators are calculated. The MATLAB was used as a computing tool. Collection of these data constitutes the training data set. |
B. ANN Structure |
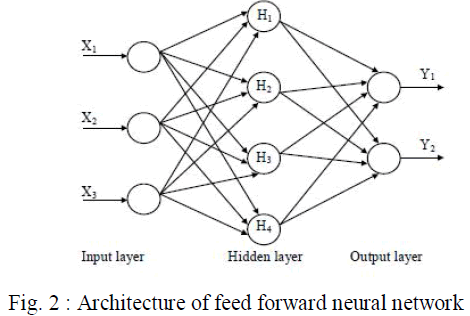
| A multi-layered feed-forward neural network has been proved suitable for most power system problems.Figure1 shows the architecture of the feed forward neural network. The architecture of the ANN used in this paper consists of an input layer, a hidden layer and an output layer. The input layer has 6 neurons since the number of variables in the input neural network is 6 for 5-bus system, 16 neurons in IEEE 14 bus and 36 neurons in IEEE 30 bus system. The number of hidden neuron in hidden layer is fixed to 30 for all 3 bus systems. The more hidden neurons are used to train the neural network, the more computational time will be consumed. In the target layer, the neural network has two output vector which is either 0 for insecure or 1 for secure but naturally, neural network output is a closer analogue value in a range [0, 1]. Therefore, the output of neural network more than or equal 1 will be considered as secure condition while output of neural network less than 0.5 will be considered as insecure condition. |
 |
C. ANN Training |
| Training process of neural network helps to identify the topology of neural network and it’s interconnected Weights. The training speed depends on the speed factor such as the learning rule, the transfer function of neurons or initialization of the network [13]. In the training process of the neural network, a set of network inputs and target outputs are required. And also it requires enough information in order to simulate a good prediction of power system status during training process. The weights and biases of the network are iteratively adjusted to minimize the network performance function during training process itself. |
| The feed forward back propagation neural network can be trained with different training algorithms. The most commonly used training algorithm for multi layer feed forward network is back propagation (BP) algorithm, which is a gradient descent algorithm .since this method is too slow ,some high performance algorithms like conjugate gradient algorithms, Quasi-Newton algorithms, Levenberg-Marquardt (LM) algorithm are developed to train network which converges faster than BP algorithm. |
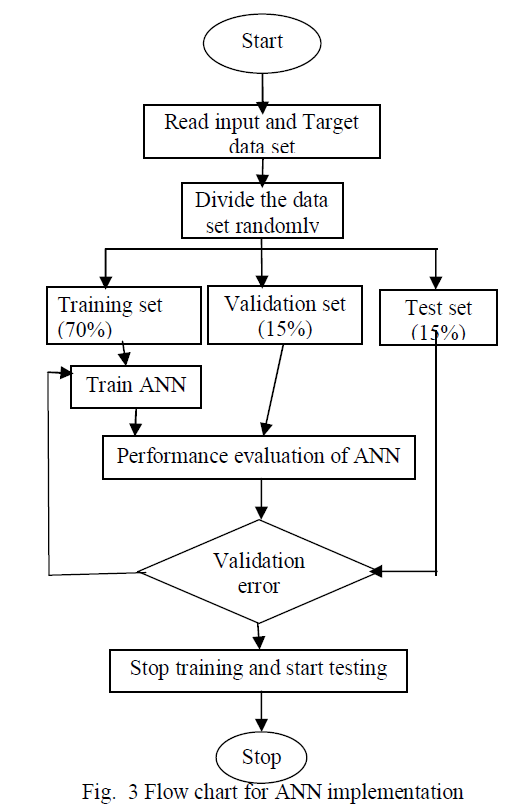
| In the present work, LM training technique is used due to its faster training and good convergence [13].And this algorithm is suitable for medium sized neural network. And this algorithm combines steepest descent algorithm and the Gauss–Newton algorithm. In neural network, over fitting is also known as overtraining where further training will not result in better generalization. The error of validation set is periodically monitored during the training process. The training error usually decreases as the iteration grows, so does the validation error. When the overtraining starts to occur, the validation error typically tends to increase. Therefore, it would be useful and time saving to stop the training after the validation has increased for some specified number of iteration. The whole ANN process can be depicted as shown below in Fig. 3 |
 |
D. Performance of ANN |
| The performance of the feed forward back propagation neural network is evaluated by the percentages of classification accuracy (CA) and mean squared error (MSE) [24]. The percentages of CA for the neural network are calculated by using equation (6) |
 |
| The neural network configuration which gives highest accuracy of prediction and lowest value of mean square error is considered as the best performance configuration. |
SIMULATION RESULTS |
| The effectiveness of the proposed approach of feed forward neural network based method for voltage stability assessment of power system has been demonstrated for 5-bus system, IEEE 14 bus system and IEEE 30 bus system. The work has been carried out in MATLAB 7.6 version. |
A. 5-Bus test system |
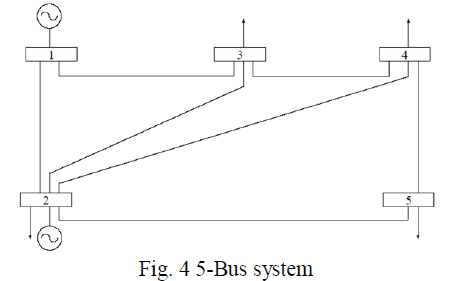
| A single line diagram of 5 bus system is shown in figure 4. The system comprises of 1 slack bus, 2 PV buses and 2 PQ buses and 7 lines. |
 |
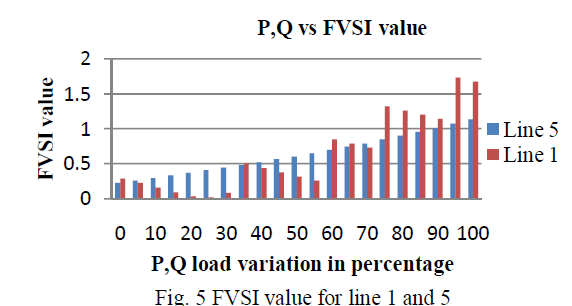
| Generate input database for feed forward neural network by simulating NR load flow in MATLAB environment for every increase of active and reactive loads at PQ buses with stepwise of 5%. For each loading condition NR load flow is simulated and FVSI is calculated. The system will be unstable when FVSI value is greater than or equal to 1.Figure 5 shows the FVSI value for line 5 and line 1 obtained from NR load flow. |
 |
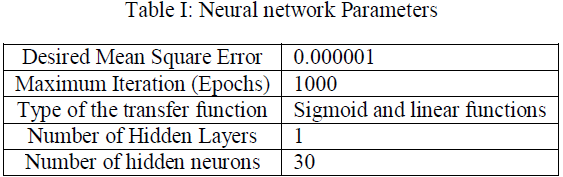
| In the present work wide range of 240 loading patterns are generated and ANN is trained with this data set. The selected FFNN has 3 layers, input layer, hidden layer and output layer. The input matrix has size[6 × 40]. This training data is divided into training, validation and test data in the ratio 75%, 15%, 15% respectively in training process by using dividerand function. Table 1 gives the neural network parameters. |
 |
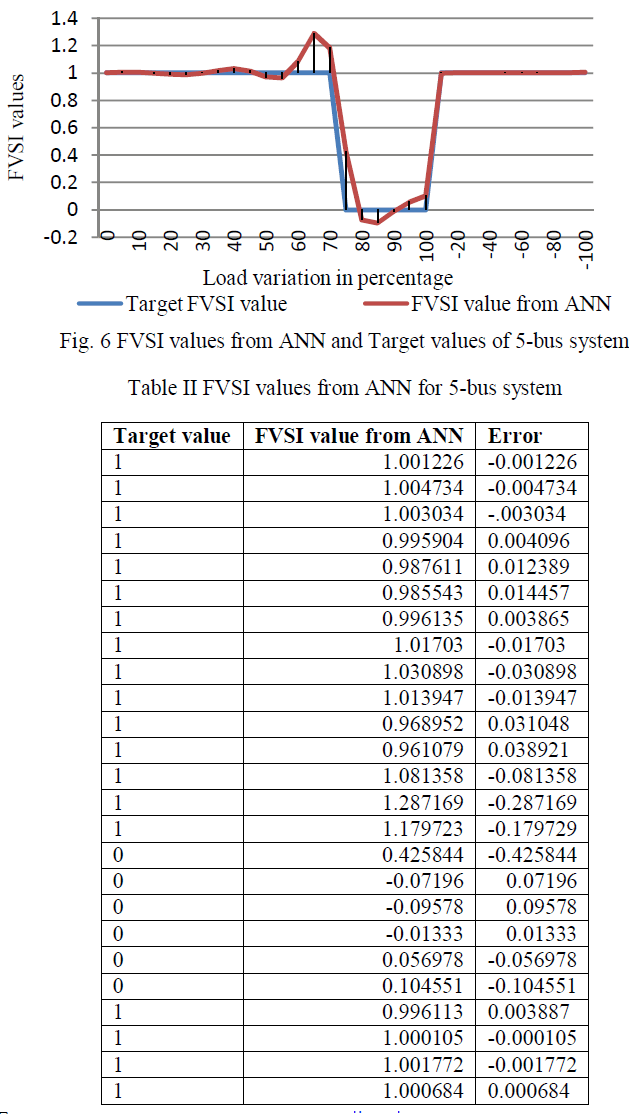
| Table 2 shows the FVSI output from ANN and error at different loading condition for 5 bus system. The performance of the feed forward back propagation neural network will be calculated by the classification accuracy which is given by equation 6. |
| Classification accuracy at training stage (%) = (236 / 240) * 100 = 98.33 %. |
| Below table shows that as the loading increased, the number of line outages which could cause voltage collapse increases and hence the risk for the system to experience voltage instability condition due to line outages is higher. Table 2and figure 6 shows target output and voltage stability index predicted through ANN is compared and error is very less proved that neural network give best performance in predicting the secure or insecure status of the power system. |
 |
 |
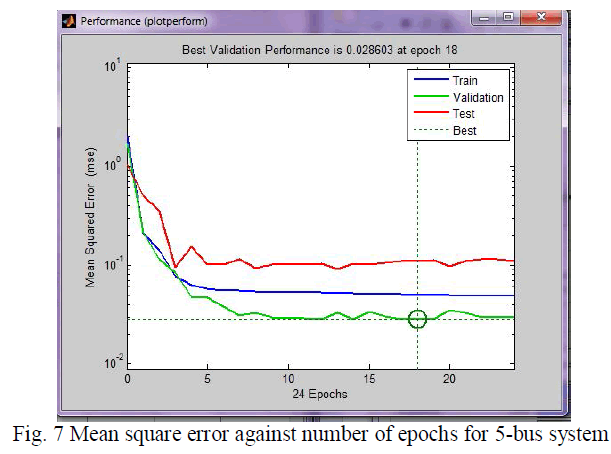 |
| Figure 7 shows mean square error against number of epochs for 5-bus system. The value of mean square error is 0.028603 which is small, which provides the good accuracy to predict security level of the system and classification accuracy is 98.33%. |
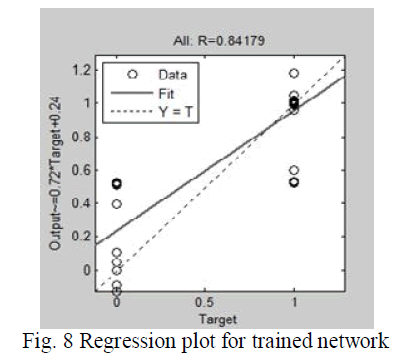
| The function of linear regression analysis is to compare the actual outputs of the neural network with the corresponding target outputs. The closer the value of R to 1, more accurate the prediction. Fig 8 shows the value of R is 0.84179. This implies that the proposed technique using FVSI as voltage collapse indicator is capable of predicting the status of the power system for 5-bus system. |
 |
B. IEEE 14-Bus system |
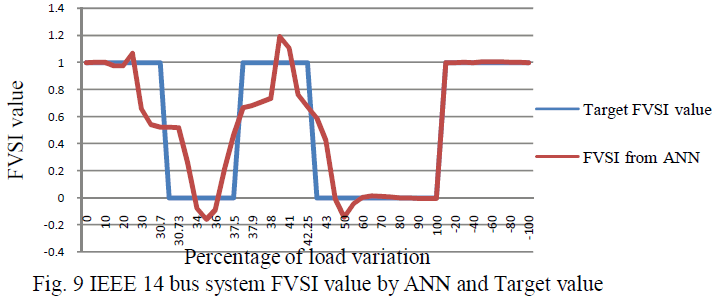
| IEEE 14 bus consists of 1 slack bus, 4 PV buses, 9 PQ buses and 20 lines. Figure 9 shows that FVSI values obtained from ANN and Target values. In IEEE 14 bus system at loading level of 31.7% above the base case, then line 14 and line 15 become insecure. |
 |
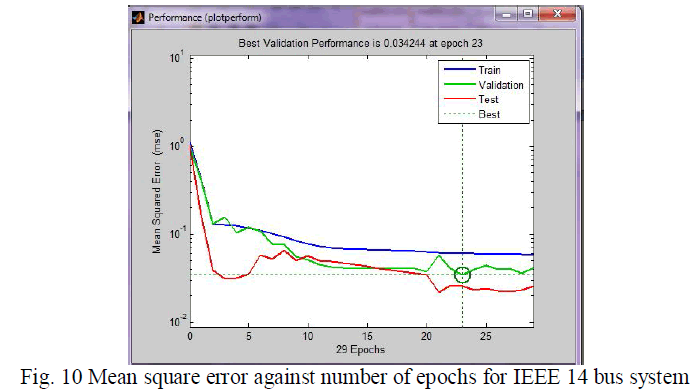
| Figure 10 shows the mean square error of 0.034244 at 23 epochs gives the performance of the system. |
 |
C. IEEE 30-Bus system |
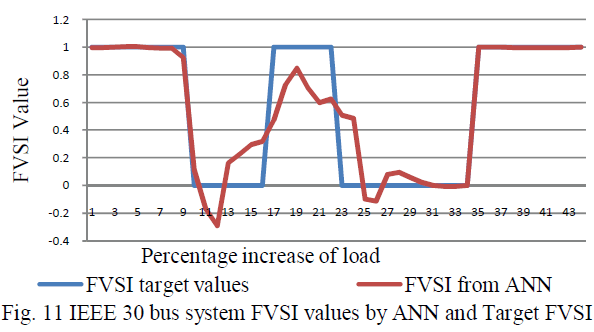
| IEEE 30 system consists of 1 slack bus, 5 PV buses, 24 PQ buses and 41 lines. Figure 11 shows that FVSI values obtained from ANN and target values. In IEEE 30 bus system at loading level of above the base case, then lines 10,13,14,15 and 16 lines become insecure. |
 |
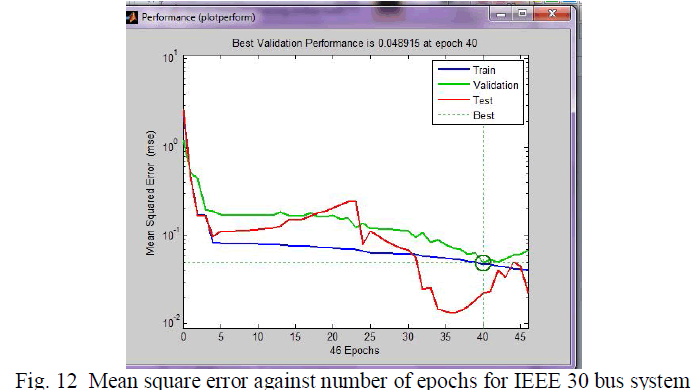
| Figure 12 shows the mean square error of 0.048915 at epoch 40 gives the best performance of the system. |
 |
| The generalization of the technique and it’s suitability for large scale systems using FFNN for voltage stability assessment for power system has been reported by considering 2 standard benchmark systems namely IEEE 14 and IEEE 30 bus system. Table 3 gives the performance evaluation for IEEE 14 and IEEE 30 bus system. |
| Table III Performance evaluation of proposed model for IEEE 14 and IEEE 30 bus system |
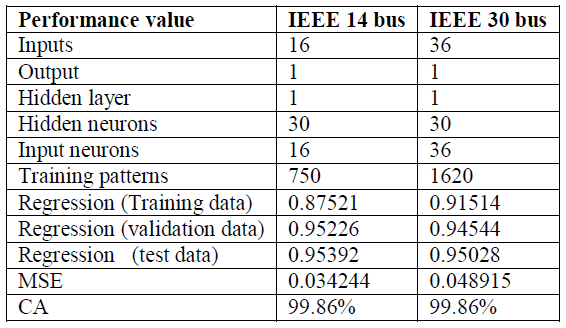 |
| This indicates that the artificial neural network trained well and the correct choice of the training parameters. Because of this excellent percentage, the artificial neural network will be able to predict its outputs (FVSI value) in proper way during the testing stage. The ANN generalization capability has also been confirmed for the samples tested for all the 3 systems tested. |
CONCLUSION |
| Voltage stability indicator has been calculated from NR method and by ANN. FVSI is a measure of voltage stability. The bus with FVSI value closer or equal to 1 will be the most vulnerable bus in the system and helps in identifying weak area in the system which requires reactive power compensation. |
| An ANN based voltage stability assessment for a 5- bus, IEEE 14 and IEEE 30 bus power systems have been proposed. From the testing process, shows the feasibility of proposed network in predicting FVSI for the load buses in power system network as secure or insecure. The proposed method indicates that a good agreement between targeted output and ANN output for different buses which are tested in this work. Training process of ANN will take long time, but testing process requires only a few seconds for any system. The proposed approach provides fast computation of voltage stability indicator FVSI and can analyze any unknown load patterns. This powerful and versatile feature is useful for power system operation. |
ACKNOWLEDGMENT |
| The authors sincerely acknowledge the support and guidance from faculty members of Department of Electrical and Electronics Engineering, University of BDT college of Engineering, Davangere to carry out this work. |
References |
|