Research & Reviews: Journal of Pharmaceutical Analysis
e-ISSN: 2320-0812
e-ISSN: 2320-0812
Narendra Nyola*, Govinda Samy Jeyabalan, N Kalra, Gazala Parveen, and Suresh Choudhary
Alwar Pharmacy College, Alwar - 301030, Rajasthan, India
Received date: 20/09/2012; Revised date: 15/10/2012; Accepted date: 09/11/2012
Visit for more related articles at Research & Reviews: Journal of Pharmaceutical Analysis
A new simple, accurate, precise and reproducible RP-HPLC method has been developed for the simultaneous estimation of Diacerein and Aceclofenac in pharmaceutical dosage form using C18 column (Phenomenex, 250 x 4.6 mm, 5 μm) in isocratic mode. The mobile phase consisted of Acetonitrile and Water in the ratio of 55:45 (v/v). The detection wavelength was carried out at 271 nm. The method was linear over the concentration range for Aceclofenac 50-75 μg/ml and for Diacerein 100-150 μg/ml. The recoveries of Aceclofenac and Diacerein were found to be in the range of 99.23-100.39% and 99.45-100.56% respectively. The validation of method was carried out utilizing ICH-guidelines. The described HPLC method was successfully employed for the analysis of pharmaceutical formulations containing combined dosage form.
Simultaneous estimation, RP-HPLC, Aceclofenac, Diacerein.
Diacerein 4, 5-di acetoxy-9, 10-dihydro-9, 10-dioxoanthracene-2-carboxylic acid is drug for osteoarthritis [1-3]. It is synthesised from naturally occurring glucopyranoside aloin. It is the di-acetylated derivative of rhein [5,6]. Diacerein is a selective inhibitor of interleukin-1 having protective effect on granuloma-induced cartilage breakdown by a reduction in the concentrations of proinflammatory cytokines [7]. Aceclofenac [(2,6-dichlorophenyl)amino] phenylacetoxyacetic acid is used as an effective non-steroidal anti-inflammatory drug (NSAID) derived from the phenylacetic acid with pronounced anti-inflammatory, analgesic and antipyretic properties [4]. It has good tolerability profile in variety of painful conditions like rheumatoid arthritis, osteoarthritis and ankylosing spondylatis Diacerein and Aceclofenac is a recent combination available in the market for its synergetic effect in the treatment of different joint disorders. Literature survey reveals some methods reported for diacerein viz. Spectrophotometric method [8], stability indicating High Performance Liquid Chromatographic (HPLC) methods [9,10], and stability indicating HPTLC method [11] . For Aceclofenac literature surveys reveal many papers viz. Simple spectrometric methods [12], spectrofluorimetric method [13], stability indicating HPLC [14] and HPTLC methods [15]. Some research articles are also available for Diacerein and Aceclofenac combination as simultaneous UV spectrophotometric methods [16-18], and HPTLC method [19]. The reports were found for the method as per ICH guidelines, for Diacerein and Aceclofenac in combination by HPLC method [20]. This paper describes a simple, accurate, sensitive and validated stability indicating HPLC method for Diacerein and Aceclofenac in combination as the bulk drug and in dosage forms.
Apparatus
The liquid chromatographic system consists of shimadzu 20 AT VP (UFLC)] with UV-VIS detector, binary pump and rheodyne injector valve with 20 μL fixed loop. Spectra were obtained by spinchrome system software. A shimadzu model 1800 double beam UV/ Visible spectrophotometer with spectral width of 1 nm, wavelength accuracy of ± 0.1 nm and a pair of 10 mm matched quartz cell was used to measure absorbance of all the solutions. Spectra were automatically obtained by UV-Probe system software.
All chemicals and reagents were used of HPLC grade. Authentic of Diacerein and Aceclofenac were obtained as gift samples from Glenmerk Pharmaceutical Mumbai. A drug sample was employed in the study purchased from local market.
Chromatographic Conditions
The mobile phase used as acetonitrile and water in the ratio of 55:45 (v/v) and filtered through whatman filter paper no. 1 and sonicated for 30 minutes before use. The mobile phase was delivered isocratically at a flow rate of 1.0 ml/min. C18 column (Phenomenex, 250 x 4.6 mm, 5 μm) and the column was maintained at ambient temperature. The injection volume was 20μl and the total run time was 20 minutes. The detection was carried out at 275nm.
Preparation of Standard Stock Solution
Accurately weighed quantity of 50 mg of Diacerein and 100 mg of Aceclofenac is transferred in 100 ml volumetric flask, dissolve with 20 ml acetonitrile and make up with mobile phase having the concentration of 500μg/ml of Diacerein and 1000μg/ml of Aceclofenac.
Preparation of Standard Solution
From the above standard solution 5 ml is pipette out into 50 ml volumetric flask and make up to volume with mobile phase having the concentration of 50μg/ml of Diacerein and 100μg/ml of Aceclofenac.
Preparation of Sample Stock Solution
20 tablets were accurately weighed and powdered. An amount of powder equivalent to 50 mg of Diacerein and 100 mg of Aceclofenac were weighed and transferred in 100 ml volumetric flask .Add about 20 ml of acetonitrile and make up the volume with mobile phase up to 100 ml. Then and filtered through whatman filter paper no. 1 and sonicated for 30 min. From this solution 5 ml is pipette out into 50ml volumetric flask and make up to volume with mobile phase having the concentration of 50μg/ml of Diacerein and 100μg/ml of Aceclofenac. Table 3

Table 1: Method Validation Parameters

Table 2

Table 3: Assay of Drug
Selection of Detection Wavelength
Solution of each drug in acetonitrile was scanned over the range of 200-400 nm. It was observed that both the drugs showed considerable absorbance at 275 nm. So, 275 nm was selected as the wavelength for detection (Fig.5, 6, 7).
Identification of Chromatograms
Chromatogram of each pure drug is obtain separately at 275 nm.
Method Validation
Linearity and Range
The linearity of an analytical procedure is its ability (within a given range) to obtain test result which are directly proportional to the concentration (amount) of analyte in the sample. It was studied by analyzing five concentrations of each drug and process was repeated five times. The linearity data of Diacerein and Aceclofenac was shown in Figure 3 and 4.

Figure 1: Chemical Structure Of Diacerein

Figure 2: Chemical Structure Of Aceclofenac

Figure 3: Calibration Curve of Diacerein

Figure 4: Calibration Curve of Aceclofenace

Figure 5: Uv Spectra of Diacerein

Figure 6: Uv Spectra of Aceclofenace

Figure 7: Overlap Spectra of Diacerein and Aceclofenace

Figure 8: Identification Chromatogram of Diacerein

Figure 9: Identification Chromatogram of Aceclofenace

Figure 10: Assay Chromatogram of Sample
Precision of the system was evaluated by analyzing six independent standard preparations and % RSD value was calculated to determine any intra-day variation. These studies were also repeated on different days to determine inter-day variation.
Accuracy
To check accuracy of the method, recovery studies were carried out by addition of standard drug to pre-analyzed sample solution at three different levels 80, 100 and 120 %. Mean percentage recovery was determined. Recovery values were calculated and shown in Table 2.
Detection Limit
The Detection Limit of an individual analytical procedure is the lowest amount of analyte in a sample which can be detected but not necessarily quantitated as an exact value.
The detection limit (LOD) may be expressed as:
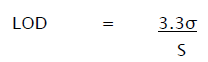
Where,
σ = Relative standard deviation of the response.
S = the slope of the calibration curve (of the analyte).
Quantitation Limit
The Quantitation limit of an analytical procedure is the lowest amount of analyte in a sample, which can be quantitatively determined with suitable precision and accuracy.
Quantitation Limit (LOQ) may be expressed as:
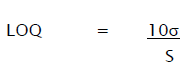
Where,
σ = Relative standard deviation of the response.
S = the slope of the calibration curve (of the analyte).
Specificity
The specificity of the method was ascertained by peak purity profiling studies. Purity of the drug peak was ascertained by analyzing the spectrum at peak start, middle and at peak end.
The present work done on this combination comprises a simple, precise and accurate method by reverse phase high performance liquid chromatography. The present combination of Diacerein and Aceclofenac was marketed as one formulation. An attempt has been made to estimate Diacerein and Aceclofenac by RP-HPLC. Even though a number of RP-HPLC methods have been reported earlier for Diacerein and Aceclofenac individually and with other combinations, an effort has been made to identify a common mobile phase to come up with the isocratic elution of both drugs in combination. Calibration curve depicting the linearity and range for Diacerein and Aceclofenac were determined from mixed standards and were found to be of the order 50-75 μg /ml of Diacerein and 100-150 μg /ml of Aceclofenac. The formulation was diluted in the linearity range and peak areas were determined, the concentrations of both like Diacerein and Aceclofenac were then determined by comparing the peak areas of sample with that of standard peak areas of Diacerein and Aceclofenac in mixture can be identified by their retention times being 5.8 minutes for Diacerein and 13.4 minutes for Aceclofenac. The results obtained from HPLC method were reproducible and encouraging. The values percentage deviation was satisfactorily low and recovery close to 100% indicating reproducibility and accuracy of method.
This study presents a simple and validated HPLC method for estimation of Diacerein and Aceclofenac in combination dosage form. The developed method is specific, accurate, precise and reproducible. The method could be applied with success even to the analysis of marketed products of Diacerein and Aceclofenac combination as well as single formulation, as no interference was observed due to excipients or other components present.
The authors are thankful to glenmark Pharmaceuticals Ltd., Mumbai for providing a gift sample of standard of Aceclofenac and Diacerein. The authors are also thankful to the management Alwar Pharmacy College for providing necessary facilities and constant encouragement.