Research & Reviews: Journal of Pharmaceutics and Nanotechnology
e-ISSN: 2347-7857 p-ISSN: 2347-7849
e-ISSN: 2347-7857 p-ISSN: 2347-7849
1Department of Pharmaceutics, PES Modern College of Pharmacy (For Ladies), Moshi, Pune- 412 105, Maharashtra, India
2Emcure Pharmaceutical Ltd, Emcure House, T 184, M.I.D.C., Bhosari, Pune 411 026, Maharashtra, India
Received date: 24/07/2014; Revised date: 28/08/2014; Accepted date: 04/09/2014
Visit for more related articles at Research & Reviews: Journal of Pharmaceutics and Nanotechnology
The attempts have been carried out in present study to formulate sodium alginate microspheres of Praziquantel by ionic gelation method by using factorial design. Microspheres were prepared by using various ratios of sodium alginate to respective drug.100mg of drug were added in 15ml solution of polymers separately. Microspheres were collected in 10 % w/v calcium chloride solution with constant stirring. The microsphere was evaluated for physical characterizations angle of repose, tapped density, bulk density, compressibility index, Hausner’s ratio,% yield, particle size, drug entrapment efficiency, drug loading, swelling index, scanning electron microscopy, in-vitro release profile and accelerated stability study etc. Some process parameters viz. orifice diameter of needle used to pass polymer solution, dropping height and stirring speed were studied. It was observed that as the orifice diameter of needle decreased from needle no. 18 to 23, the microspheres were more spherical with retention in their shape and needle no. 20 was found to be optimum. More spherical microspheres were observed with decrease in dropping height and optimum which was found to be 6 cm. Formulation 1 (sodium alginate: drug; 3:1) was found to be the best among all and which shows percent yield (98.6±0.03%), drug entrapment efficiency (98 ±1.45%), particle size (119.8±1.58 μm), drug loading (22.71±0.14%), % drug release (91.2%) which provide precise drug release control etc. Stability data revealed that optimized microspheres remained stable even after exposing to stress condition of temperatures.
Microspheres, bioavailability, polymer, particle size, Stability, SEM
Praziquantel is an Anthelmintic used in most schistosome and many cestode infestations. Drugs that are easily absorbed from the gastrointestinal tract (GIT) and have a short half-life require frequent dosing. Therefore, oral sustained/controlled release formulations have been developed to release the drug slowly into the GIT and to maintain an effective drug concentration in the blood for longer period of time. However, such oral drug delivery has a limitation of gastric retention time in the absorption zone, stomach or upper part of small intestine, therefore possibility of diminished efficacy of the administered dose. To overcome this limitation, micro particulate drug delivery systems are recommended [1].
Bioavailability of the drug has been found to be reduced with dosage forms, probably due to the fact that passage of the controlled release single unit dosage forms from absorption region of the drug is faster than its release and most of the drug released at the colon where Praziquantelis poorly absorbed. Therefore, controlled release formulation suitable for Praziquantelshould be a gastro retentive dosage form which releases the drug slowly in the stomach[2].
Microsphere carrier systems have attracted considerable attention due to release of drug at a controlled rate and less chance of dose dumping [3] Use of microspheres as gstroretentive carrier systems is achieved by overcoming short residence time at the site of absorption. This is provided by intimate contact of drug delivery system with mucous membrane. This is in turn, achieved by providing bioadhesive nature to microspheres.[4] Bioadhesive microspheres have advantages such as efficient absorption and enhanced bioavailability of drugs owing to a high surface to volume ratio, a much more intimate contact with the mucus layer and specific targeting of drugs to the absorption site. [5] Bioadhesion is successfully obtained by using certain natural polymers. They are nontoxic if taken orally and also have protective effect on the mucous membrane of upper GIT. These are block polymers consist of mannuronic acid, guluronic acid and mannuronic-guluronic blocks. [6] The dried microspheres swell in presence of aqueous medium and thus act as controlled or sustained release system. It has been widely used in drug delivery. Spherical gel formation takes place after drop wise addition of aqueous alginate solution into aqueous solution of calcium ions.[7] The present work was aimed to develop bioadhesive microspheres of Praziquanteland to study effect of variables on quality of microsphere.
Materials [8-10]
Praziquantel was obtained as a gift sample Microlabs Pvt. Ltd., Goa. Carriers such as sodium alginate and calcium chloridewere procured from Lobachemie, Mumbai.
Formulation of Microspheres Using Sodium Alginate by Gelation Method
Microspheres were prepared by ion Gelation method which involved reaction between sodium alginate and calcium to produce calcium alginate. Sodium alginate and drug were taken in the ratio of 3:1, 5:1, 7:1, 9:1 w/w and dissolved in distilled water in three separate beakers. This polymer solution was added drop wise in 10% w/v solution of calcium chloride with the help of needle of different orifice diameter. The contents in beaker were kept aside for 15 minutes. Microspheres were collected by decantation and washed several times with distilled water to remove excess calcium impurity deposited on the surface of microspheres and then dried in hot air oven at about 45 °C for sufficient time.
Compatibility studies: Infra red spectrophotometer (IR)
Infrared (IR) spectroscopy was conducted and the spectrum was recorded in the wavelength region of 4000 to 400 cm−1. The procedure consisted of dispersing a sample (drug alone, polymers alone and mixture of drug and Polymers in KBr and compressing into discs by applying a pressure of 7 tons for 5 min in a KBr press. The pellet was placed in the light path and the spectrum was obtained.
Factorial design
A 23 randomized full factorial design was used in the present study which is depicted in In this design 3 factors are evaluated, each at 2 levels, and experimental trials are performed in all 8 possible combinations. The amount of Drug: Polymer ratio (X1) and the amount of calcium chloride (X2), dropping height (X3) were selected as independent variables. The Entrapment Efficiency (Y1), drug loading (Y2) and Particle size (Y3) were selected as dependent variables.
Micromeriticstudy of Microspheres: [11]
Angle of repose
Angle of repose has been used to characterize the flow properties of microspheres. This is the maximum angle possible between surface of pile of powder and the horizontal plane.
A funnel was fixed at a height approximately 2-4 cm over the platform. The microspheres were slowly passed along the wall of the funnel, till the tip of powder cone so formed just touched the tip of funnel stem. Angle of repose was then determined by measuring the height of the cone of powder and radius of the circular base of powder heap.
Bulk density
Bulk density of microspheres was determined by pouring gently known quantity of sample through a glass funnel into graduated measuring cylinder. The volumes occupied by the samples were recorded. Bulk occupied by the samples taking ratio of weight of microspheres in gram to bulk volume of microspheres in cm3.
Bulk density = Weight of microspheres in gram / Bulk volume of microspheres
Tapped density
The microspheres were poured gently through a glass funnel into graduated measuring cylinder. Initial volume of sample was noted and the sample subjected to tapping until no further reduction in volumes was noted or the percentage of difference in volume was not more than 2%. Volume occupied by the samples after tapping was recorded and Tapped density of microspheres was calculated by the ratio of weight of microspheres in gram to volume of microspheres after tapping in cm3.
Tapped density= Weight of microspheres in gram /Volume of microspheres after tapping
Carr’s compressibility index
Carr’s compressibility index= (Tapped density-Bulk density)/Tapped density x100
Hausner’s ratio
Hausner’s ratio = Tapped density / Bulk density
Study of effect of various factors[11]
Effect of orifice diameter of needle
It was observed that diameter of needle plays important role in the quality of microspheres. Therefore, three different needles viz needle no. 18, 20 and 23 were selected. Orifice diameter decreases with increase in needle no. Thus, needle no. 18 has larger diameter and 23 has smaller orifice diameter. Solutions of polymers were passed through all three different needles and formation of microspheres was observed. Needle diameter decides volume of each drop of polymer solution passing through the needle and probably size and shape of microspheres.
Dropping height
Dropping height is nothing but, distance between tip of needle and level of contents in container affects on size and shape of microspheres. This distance decides mainly the shape of microspheres. Three different distances were selected viz., 6 cm, 15 cm, and 22 cm.
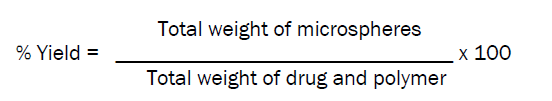
Percentage yield [12]
Percentage yield of different formulations prepared by ion gelation method was determined by weighing the microspheres after drying.
Particle Size analysis [13]
The particles were grossly separated. Particle size analysis is carried out by using a optical microscope and stage micrometer scale. Dried microspheres were placed in a glass slide and the mean microsphere size was calculated by measuring 100 microspheres with the help of a calibrated ocular micrometer.
Drug entrapment efficiency [14]
Microspheres equivalent to 50 mg of drug were accurately weighed crushed. The powdered microspheres were dissolved in 10 ml methanol and volume was made up to 100 ml with water and sonicated for 15 min and kept overnight for 24 hours to extract the drug from microspheres. This resulting solution is then filtered through whatmann filter paper. Then 1 ml of this solution was withdrawn and diluted to 10 ml with water. The absorbance of resulting solution was measured at 210 nm UV spectrophotometer against water as a blank.
Drug entrapment efficiency = (Actual drug content/Theoretical drug content) x 100
Determination of drug loading [14]
To calculate drug loading, microspheres equivalent to 50 mg of drug were accurately weighed crushed. The powdered microspheres were dissolved in 10 ml methanol and volume was made up to 100 ml with water and sonicated for 15 min and kept overnight for 24 hours to extract the drug from microspheres. This resulting solution is then filtered through whatmann filter paper. Then 1 ml of this solution was withdrawn and diluted to 10 ml with water. The absorbance of resulting solution was measured at nm UV spectrophotometer against water as a blank.
Drug loading: (amount of drug calculated/ amount of microsphere) x100
Swelling index [15]
The Swelling ability of microspheres in physiological media was determined by swelling them in phosphate buffer PH 7.4.Accurately weighed 50 mg of microspheres were immersed in little excess of phosphate buffer PH 7.4.The degree of swelling was calculated as follows.

Where,W0 = Weight of microspheres before swelling
We =Weight of microspheres after swelling
Determination of moisture content:[13]
The residual water content in the microspheres was determined by keeping microspheres in the desiccators containing charged silica beads. 100 mg of sample was placed in a desiccator. The dry weight was determined at specific intervals until constant weight obtained. The difference between initial and final weight was calculated and moisture content was calculated by equation below,
Moisture content (MC) = [(W0 –Wt)/ Wt] 100 x
Where W0 is initial weight and Wt is final weight
Surface Morphological and topographic Study [16]
Surface morphology and shape of optimized batch (F1) of microspheres was studied using scanning electron microscopy (SEM), Model Joel- LV-5600, USA, at suitable magnification at room temperature. The microphotographs were observed for morphological characteristics and to confirm spherical nature of the microspheres.
In vitro drug release study[17]
In vitro dissolution studies were carried out by using USP-I Basket type tablet dissolution test apparatus. Weighed amount of drug loaded microspheres corresponding to 100 mg of drug was filled into a capsule and placed in basket. Dissolution medium of phosphate buffer PH 7.4 maintained at 370C ± 10 C at 100 RPM. 5 ml of aliquots were withdrawn at pre-determined time intervals and equal volume of fresh dissolution medium was replaced to maintain sink condition. The samples were analyzed spectroscopically at 210 nm to determine the concentration of drug present.
Accelerated Stability study [18, 19]
The microspheres batches of optimized formulation was placed in screw capped glass container and stored at ambient humidity conditions, at various temperatures like 40 ± 2°C (75 ± 5% RH) for period of 60 days. The samples were analyzed for drug loading, Entrapment efficiency and particle size.
Drug-excipient compatibility studies
Infra red spectrophotometer (IR)
IR spectra’s were recorded for pure Praziquantel drug and physical mixture Fig no. 1& 2.All the above characteristic peaks of drug appear in the spectra of physical mixture at the same wave number, indicating no modification or interaction between the drug and the polymer.

Figure 1: IR of Praziquantel

Figure 2: IR of physical mixture (drug + sodium alginate + calcium chloride)
Optimization of drug to polymer ratio
In order to estimate the relative effectiveness of various concentration of drug to polymer, various formulations were prepared to achieve increased entrapment efficiency and drug loading and the desired particle size. Four formulations having different drug to lipid ratio 1:3, 1:5, 1:7 w/w) were designed which is depicted in Table no.1. Depending upon the particle size obtained, adjustment in drug, Calcium chloride concentrations were made in formulations, so that it could give the desired entrapment efficiency and drug loading too.

Table 1: Different Batches of Microspheres
Factorial Design
A 23 randomized full factorial design was used in the present study. In this design 3factors are evaluated, each at 2 levels, and experimental trials are performed in all 8possible combinations. The amount of Drug: Polymer ratio (X1), and the amount of calcium chloride (X2), dropping hight were selected as independent variables. The Entrapment Efficiency (Y1), drug loading (Y2) and Particle size (Y3) were selected as dependent variables to evaluate the responses which is depicted in Table no.2. The design matrix and coded levels are mentioned in actual values as shown in Table no.3 & 4. The Particle size and Entrapment Efficiency were selected as dependent variables. Based on the factorial design 8 formulations were devised.

Table 2: Formulation of Microsphere using factorial design

Table 3: Design matrix of Independent Variables

Table 4: Coded levels in actual values
Calculation of Coefficients for particle size, Entrapment Efficiency and drug loading.
The coefficients of the polynomial equations generated using multiple linear regressions analyses (MLRA) for entrapment efficiency, particle size and drug loading of the sodium alginate microspheres studied with the values of r2. Ten coefficients (ß0 to ß9) were calculated with B0 as the intercept. The coefficients ß0 to ß9 represent various quadratic and interaction terms, but are denoted as such in equation due to their simplicity.
The general equation in terms of coded factors is-
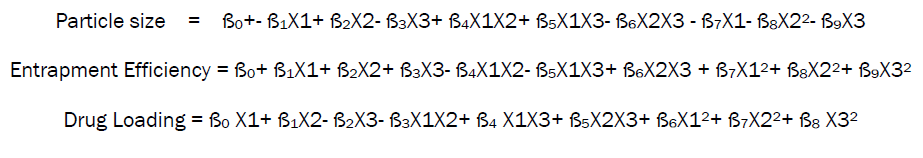
Whereas ß0 is intercept and ß1............. ß9 is the coefficient of variables which represented various quadratic and interaction terms, but are denoted as such in equation due to their simplicity while X1 X2 X3 are the response variables.
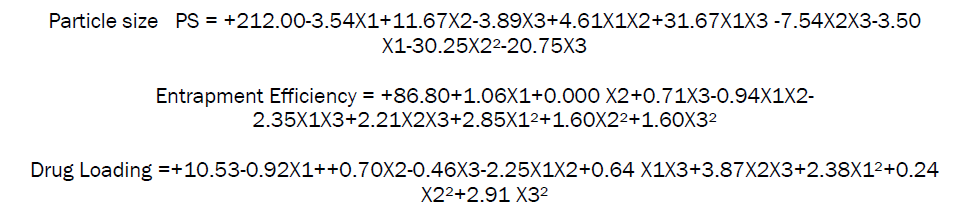
The final polynomial equation for particle size, entrapment efficiency and drug loading generated in terms of coded factors using multiple linear regression analysis is
ANOVA for selected factorial model (Particle size)
The statistical evaluation was performed by one-way ANOVA. From the data it is evident that p value is less than 0.0041 in all formulations. X1 (Drug: polymer) factor shows negative effects, X2 (Cal Chloride) factor shows positive effect while combine effect of X1X2X3 factor shows positive effects from this data it was cleared that the given model for DL was significant. Therefore it can be derived that the change in polymer ratio had significant effect on the particle size of the drug while (X2) change in calcium chloride ratio shows positive effect.
Response surface plots for measured responses
Counter plots and Three-dimensional response surface plots are shown in Fig. no 3 & 4. These types of plots are useful in the study of the effects of two factors on the response at one time. These Figures shows that Particle size increases with increasing concentrations of Drug: polymer ratios.

Figure 3: Counter plots showing the effect of drug:polymer on the Particle size from formulation.

Figure 4: Response surface plots showing the effect of Drug Poymer ratio on Particle size From formulation
ANOVA for selected factorial model (Entrapment Efficiency)
The statistical evaluation was performed by one-way ANOVA. From the data it is evident that p value is less than 0.0041 in all formulations. X1 (Drug: polymer) factor shows positive effects, X2 (Cal Chloride) factor shows positive effect while combine effect of X1X2X3 factor shows positive effects from this data it was cleared that the given model for % Entrapment Efficiency was significant. Therefore it can be derived that the change in polymer ratio had no significant effect on the % Entrapment Efficiency of the drug while (X2) change in calcium chloride ratio shows positive effect.
Response surface plots for measured responses
Counter plots and Three-dimensional response surface plots are shown in Fig. no 5 & 6 These types of plots are useful in the study of the effects of two factors on the response at one time. These Figures shows that Entrapment Efficiency increases with increasing concentrations of Drug: polymer ratios and there is no significant difference on Entrapment Efficiency of increasing concentration of Drug: polymer ratios.

Figure 5: Counter plots showing the effect of drug:polymer on the % EE from formulation.

Figure 6: Response surface plots showing the effect of Drug:Poymer ratio on the % Entrapment efficiency from formulation
ANOVA for selected factorial model (%Drug loading)
The statistical evaluation was performed by one-way ANOVA. From the data it is evident that p value is less than 0.00371 in all formulations. X1 (Drug: polymer) factor shows positive effects, X2 (Cal Chloride) factor shows positive effect while combine effect of X1X2X3 factor shows positive effects from this data it was cleared that the given model for Drug loading was significant. Therefore it can be derived that the change in polymer ratio had no significant effect on the % Drug loading of the drug while (X2) change in calcium chloride ratio shows positive effect.
Response surface plots for measured responses
Counter plots and Three-dimensional response surface plotsare shown in Fig. no 7 & 8. These types of plots are useful in the study of the effects of two factors on the response at one time. These Figures that drug loading increases with increasing concentrations of Drug: polymer ratios and there is no significant difference on drug loading of increasing concentration of Drug: polymer ratios.

Figure 7: Counter plots showing the effect of drug polymer on the percentage drug loading from formulation

Figure 8: Response surface plots showing the effect of Drug Poymer ratio on the percentage Drug loading from formulation.
Micromeritic Study of formulations
The prepared microspheres ware evaluated for variable micromeritic parameters such as Angle of repose, Bulk density, Tapped density, Hausners ratio, and Carr’s compressibility index which is depicted in Table no 5. The % compressibility index of formulations F1 to F8 was found in the range of 7.15 ± 0.75 to 11.5 ±0.06 % indicating excellent flow property. The value of Hausner’s ratio for all the formulations F1 to F8 was below 0.492±0.09 to 1.117±0.09 which indicates excellent flow property. The value for angle of repose for formulations F1 to F8 was found in the range 26 ± 0.45 to 30± 0.95°indicating excellent flow properties. The values of angle of repose of all samples indicated that microspheres were free flowing. These properties are suitable for conversion into solid dosage form.

Table 5: Data of Micromeritic Studies
Study of effect of various factors
Effect of orifice diameter of needle
Effect of orifice diameter (Needle no 18, 20 and 23) on formation of microspheres is summarized in Table no. 6. Small particle size with rigid nature of microspheres was possible with needle no 20 and 23. However, as viscosity plays important role in passage of solution from needle, a difficulty was observed for needle no 23.Therefore, needle no. 20 was suggested for this process

Table 6: Effect of orifice diameter on formation of microspheres
Dropping height
While doing practically, apart from distance of 15 cm and 6 cm, the observation was also noted for distance more than 15 cm. At this distance, no proper shape of microspheres was observed immediately after formation in beaker and even after drying. Elongated microspheres and sometimes elongation with flat surface of microspheres was observed. Wide particle size distribution was experienced. At distance of 15 cm, shape was slightly spherical but no integrity in surface wasobserved immediately after formation and subsequent drying. But as the distance was reduced, significant change in shape, size and surface integrity was observed which is depicted in Table no.7.

Table 7: Effect of dropping height on formation of microspheres
Percentage Yield
The percentage yield of the different formulations was found in the range of 88.4±0.05% to 98.6±0.03% which is depicted in Table no. 8.

Table 8: Data of different parameters
Particle Size Analysis
The particle size range for microspheres was found to be 119.8±1.58 μm to 160 ± 0.96 μm shown in Table no.8. The particle size was found to be increased with the polymer concentration due to increase in viscosity of the polymer solution which increased droplet size. The microspheres when formed in solution were large in size due to entrapment of large volume of solution. However, sufficient size reduction was observed after drying due to evaporation of solvent and shrinkage of polymer coat.
Entrapment Efficiency
The drug entrapment efficiency of prepared microspheres was found in the range of 89 ±0.48 to 98 ±1.45% as shown in Table no. 8. The entrapment efficiency of F1 formulation was higher as compared to other formulations. Overall, drug entrapment was found increasing with increase in polymer concentration due to its higher viscosity.
Drug Loading
The drug loading of prepared microspheres was found in the range 12.5 ± 0.15 to 22.71±0.14% as shown in Table no.8. The drug loading of F1 formulation was higher as compared to other formulations. It was found that with increasing the drug-to-polymer, the drug loading was decreased.
Degree of Swelling
Swelling capacity of microspheres was mostly shown because of sodium alginate in the preparation. The Degree of Swelling of prepared microspheres was found in the range of 11.5 ± 0.48 to 33.7 ± 1.75% as shown in Table no. 9. It was found that with increasing the drug-to-polymer, the swelling index was also increased.

Table 9: Data of Degree of swelling study
Moisture content
The moisture contentof prepared microspheres was found in the range of 11.11±0.025 to 24.58 ± 0.04 % shown in Table no 9. It was found that with increasing the drug-to-polymer ratio, the moisture content was also increased.
Morphological Study
It was found that the optimized formulation (F1) showed spherical shape & smooth surfaces with no visible major surface irregularity shown in Fig. no.9. However, increasing the stirring rate to 1200 rpm it caused microspheres to become slightly irregular and showed some wrinkles and might be because of subside of microspheres during the drying process.

Figure 9: Scanning Electron Microscopy of Optimized formulation (F1) Microsphere
In-vitro Drug Release study
The microspheres were subjected to In-vitro release studies and the data was observed which is shown in Fig. no. 10.It was observed that as the concentration of polymer increases the drug release goes on decreasing &these further exhibited that particle size does affect the rate of drug release from microspheres with low drug loading, which can be attributed tohigh efficiency of drug encapsulation. Furthermore, lower rate of drug diffusion was observed withLower drug contents and also drug loadingbecause of formation of fewer pores within the polymeric complex.

Figure 10: In-vitro Drug Release Profile of all formulations
Accelerated Stability studies
According to ICH guidelines, a selected formulation F1 was stored at 40 ± 2°C (75 ± 5% RH), 50C and room temperature for period of two month. Formulations were evaluated at periodical intervals of 15 days for particle size, Entrapment efficiency and drug loading which is depicted in Fig. no. 11-13 respectively. From the stability studies of the optimized batches the drug loss was found to be minor and there was no change in particle size, Entrapment efficiency &drug loading. It was found that the microspheres remained stable even after exposing to stress condition of temperatures.

Figure 11: Stability data of optimized batch (F1) particle size

Figure 12: Stability data of optimized batch (F1) % entrapment efficiency

Figure 13: Stability data of optimized batch (F1) % entrapment efficiency
The present investigation involves formulation and evaluation of sodium alginate microspheres with Praziquantel as model drug by using factorial design for prolongation of drug release time. Above investigation concluded that out of eight batches (F1 to F8), F1 was found to be optimized batch which showed better results in terms of percentage yield, particle size analysis, drug entrapment efficiency, drug loading, different micromeritic studies, degree of swelling, surface morphology, in vitro drug release study and accelerated stability studies which makes it more desirable to achieve the controlled release characteristics for the drug as a anthelmintics.
Authors are thankful to Modern College of Pharmacy (For Ladies), Moshi, Pune for providing the necessary facilities.