ISSN ONLINE(2320-9801) PRINT (2320-9798)
ISSN ONLINE(2320-9801) PRINT (2320-9798)
V Krishnanaik 1, k.Purushotham2
|
| Related article at Pubmed, Scholar Google |
Visit for more related articles at International Journal of Innovative Research in Computer and Communication Engineering
An image is defined as an array, or a matrix, of square pixels (elements of picture) arranged in rows and columns. Image processing is a procedure of converting an image into digital form and carry out some operation on it, in order to get an improved image and take out several helpful information from it. Actually Signal or image processing enhances certain features of the data while suppressing others. For instance, in analysing a fingerprint image against a textured background it may be important to enhance the fingerprint to identify its owner. The appropriate processing would need to focus on features such as the overall texture pattern to be suppressed and the fingerprint's parallel, smoothly curving lines to be enhanced. Typical Image & Signal Processing Applications are used for Computer vision, Face detection ,Feature detection, extraction, and analysis ,Medical image processing, Remote sensing, Speech recognition, Speech synthesis, Speech compression, Audio, noise suppression, Automated map analysis. In this paper Resolution enhancement (RE) schemes (which are not based on wavelets) suffer from the drawback of losing highfrequency contents (which results in blurring). The discrete- wavelet-transform-based (DWT) RE scheme generates artifacts (due to a DWT shift-variant property). A wavelet-domain approach based on dual-tree complex wavelet transform (DT-CWT) and nonlocal means (NLM) is proposed for RE of the satellite images. A satellite input image is decomposed by DT-CWT (which is nearly shift invariant) to obtain high-frequency subbands. The high-frequency subbands and the low-resolution (LR) input image are interpolated using the Lanczos interpolator. The high- frequency subbands are passed through an NLM filter to cater for the artifacts generated by DT-CWT (despite of its nearly shift invariance). The filtered high-frequency subbands and the LR input image are combined using inverse DT-CWT to obtain a resolution-enhanced image. Objective and subjective analyses reveal superiority of the proposed technique over the conventional and state-of-the-art RE techniques.
KEYWORDS |
| Digital Image, Subbands, Satellite, NLM, RGB, HSI, Resolution, Multiresolution Analysis,NLM Filtering, Wavelets, DWT, DTCWT,PSNR, MSE, Q-index. |
I. INTRODUCTION |
| The purpose of a color model (also called color space or color system) is to facilitate the specification of colors in some standard, generally accepted way. In essence, a color model is a specification of a coordinate system and a subspace within that system where each color is represented by a single point.Most color models in use today are oriented either toward hardware (such as for color monitors and printers) or toward applications where color manipulation is a goal (such as in the creation of color graphics for animation). In terms of digital image processing, the hardware –oriented models most commonly used in practice are the RGB model for color monitors and a broad class of color video cameras; the CMY - cyan, magenta, yellow, and CMYK - cyan, magenta, yellow, black model, which corresponds closely with the way humans describe and interpret color. The HSI model also has the advantage that it decouples the color and gray-scale information in an image. There are numerous color models in use today due to the fact that color science is a broad filed that encompasses many areas of application. It is tempting to dwell on some of these models here simply because they are interesting and informative. However, keeping to the task at hand, the models discussed in HSI chapter are leading models for image processing. |
1.1 RGB Color Model: |
| In the RGB model, each color appears in its primary spectral components of red, green, and blue. THSI model is based on a Cartesian coordinate system. The color subspace of interest is the cube shown in Figure.1.1. in which RGB values are at three corners; cyan, magenta ,and yellow are at three other corners ;black is at the origin; and white is at the corner farthest from the origin. In HSI model, the gray scale extends from black to white along the line joining these two points. The different colors in HSI model are points on or inside the cube, and are defined by vectors extending from the origin. For Convenience, the assumption is that all color values have been normalized so that the cube shown in Figure 1.1 is the unit cube. That is, all values of R, G and B are assumed to be in range [0, 1].Image represented in the RGB color model consist of three component images, one for each primary color. When fed into an RGB monitor, these three images combine on the phosphor screen to produce a composite color image. The number of bits used to represent each pixel in RGB space is called pixel depth. Consider an RGB image in which each of the red, green and a blue image is an 8- bit image. Under these conditions each RGB color pixel [that is , a triplet of values (R,G,B)] is said to have a depth of 24 bits (3 image planes times the number of bits per plane) . The total number of color in a 24-bit RGB image is (28)3= 16.777.215. Figure 1.2 shows the 24-bit RGB color cube corresponding to the Figure 1.1.It is of interesting to note that acquiring a color images is basically the process shown in Figure 1.3 in reverse. A color image can be acquired by using three filters, sensitive to red, green and blue, respectively. When we view a color scene with a monochrome camera equipped with one of these filters, the result I s a monochrome image whose intensity is proportional to the response of that filter. |
 |
1.2 The HSI Color Model: |
| HSI model we are about to present, called the HSI (hue, saturation, intensity) color model, decouples the intensity component from the color-carrying information (hue and saturation) in a color image. As a result, the HSI model is an ideal tool for developing image processing algorithms based on color descriptions that are natural and intuitive to humans, who, after all, are the developers and users of these algorithms. We can summarize by saying that RGB is ideal for image color generation (as in image by a color camera or image display in a monitor screen), but its use for color description is much more limited. The material that follows provides a very effective way to do HSI.As discussed, an RGB color image can be viewed as three monochrome intensity images (representing red, green, and blue), so it should come as no surprise that we should be able to extract intensity from an RGB image. THSI becomes rather clear if we take the color cube and stand it on the black (0, 0, 0) vertex, with the white vertex (1, 1, 1) directly above it, as shown in Fig (a). |
 |
| 1.3 Conversion Between Models: Converting colors from RGB to HSI Given an image in RGB color format, the H component of each RGB pixel is obtained using the equation |
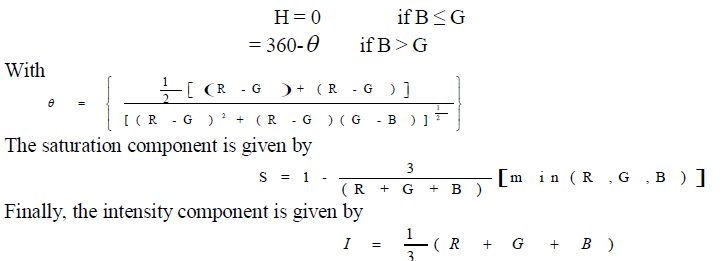 |
| It is assumed that the RGB values have been normalized to the range [0, 1] and that angle θ is measured with respect to the red axis of the HSI space. Hue can be normalized to the range [0, 1] by dividing by 360 all values resulting from above Eq. The other two HSI components already are in HSI range if the given RGB values are in the interval [0, 1]. |
1.4 Converting colors from HSI to RGB: |
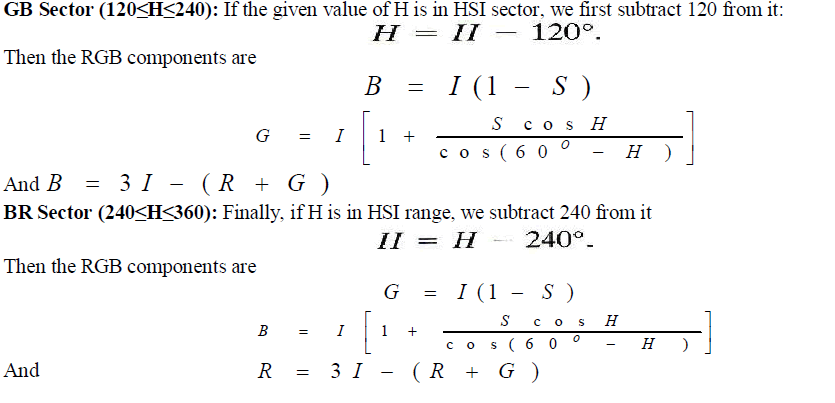
| Given values of HSI in the interval [0, 1], we now want to find the corresponding RGB values in the same range. The applicable equations depend on the values of H. There are three sectors of interest, corresponding to the 120 intervals in the separation of primaries. We begin by multiplying H by 360, which returns the hue to its original range of [0,360]. |
| RG Sector (0≤H≤120): When H is in HSI sector, the RGB components are given by the equations |
 |
| And |
 |
II. RELATED WORK |
2.1 DUAL TREE COMPLEX WAVELET TRANSFORM |
| Edges and other singularities in signal processing applications manifest themselves as oscillating coefficients in the wavelet domain. The amplitude of these coefficients describes the strength of the singularity while the phase indicates the location of singularity. In order to determine the correct value of localised envelope and phase of an oscillating function, ‘analytic’ or ‘quadrature’ representation of the signal is used. This representation can be obtained from the Hilbert transform of the signal. It is shown in that for radar and sonar applications, the complex I/Q orthogonal signals can be efficiently processed with complex filterbanks rather than processing the I and Q channel separately. Thus, the complex orthogonal wavelet may prove to be a good choice, since it will allow processing of both magnitude and phase simultaneously.RCWT comprise two types of DT-DWT;one is Kingsbury’s DT-DWT(K) and the other is Selesnick’s DT-DWT(S) . These DT-DWT based transforms are redundant because of two conventional DWT filterbank trees working in parallel and are interpreted as complex because of the respective filters of both the trees are in approximate quadrature. In other words, respective scaling and the wavelet functions at all decomposition levels of both the trees form the (approximate) Hilbert transform pairs. Both versions of DT-DWT use 2-band PR filter sets. |
III. PROPOSED METHOD |
| Resolution (spatial, spectral, and temporal) is the limiting factor for the utilization of remote sensing data (satellite imaging, etc.). Spatial and spectral resolutions of satellite images (unprocessed) are related (a high spatial resolution is associated with a low spectral resolution and vice versa) with each other. Therefore, spectral, as well as spatial, resolution enhancement (RE) is desirable. Interpolation has been widely used for RE. Com- monly used interpolation techniques are based on nearest neighbors (include nearest neighbor, bilinear, bicubic, and Lanczos). The Lanczos interpolation (windowed form of a sinc filter) is superior than its counterparts (including nearest neighbor, bilinear, and bicubic) due to increased ability to detect edges and linear features. It also offers the best compromise in terms of reduction of aliasing, sharpness, and ringing. Methods based on vector-valued image regularization with partial differential equations (VVIR-PDE) and in painting and zooming using sparse representations are now state of the art in the field (mostly applied for image in painting but can be also seen as interpolation). RE schemes (which are not based on wavelets) suffer from the drawback of losing high-frequency contents (which results in blurring). RE in the wavelet domain is a new research area, and recently, many algorithms [discrete wavelet transform (DWT), stationary wavelet transform (SWT), and dual-tree complex wavelet transform (DT-CWT) have been proposed. An RE scheme was proposed in using DT-CWT and bicubicinterpolations, and results were compared (shown superior) with the conventional schemes (i.e., nearest neighbor, bilinear, and bicubic interpolations and wavelet zero padding). More recently, in, a scheme based on DWT and bicubic interpolation was proposed, and results were compared with the conventional schemes and the state-of-art schemes (wavelet zero padding and cyclic spinning and DT-CWT ). Note that, DWT is shift variant, which causes artifacts in the RE image, and has a lack of directionality; however, DT-CWT is almost shift and rotation invariant. |
| DWT-based RE schemes generate artifacts (due to DWT shift-variant property). In this letter, a DT-CWT-based nonlocal-means-based RE (DT-CWT-NLM-RE) technique is proposed, using the DT-CWT, Lanczos interpolation, and NLM. Note that DT-CWT is nearly shift invariant and directional selective. Moreover, DT-CWT preserved the usual properties of perfect reconstruction with well-balanced frequency responses. Consequentially, DT-CWT gives promising results after the modification of the wavelet coefficients and provides less artifacts, as compared with traditional DWT. Since the Lanczos filter offer less aliasing, sharpness, and minimal ringing, therefore, it a good choice for RE. NLM filtering is used to further enhance the performance of DT-CWT-NLM-RE by reducing the artifacts. The results (for spatial RE of optical images) are compared with the best performing techniques. |
3.1 NLM Filtering |
| The NLM filter (an extension of neighborhood filtering algorithms) is based on the assumption that image content is likely to repeat itself within some neighborhood (in the image) and in neighboring frames. It computes denoised pixel x(p,q) by the weighted sum of the surrounding pixels of Y (p,q) (within frame and in the neighboring frames). This feature provides a way to estimate the pixel value from noise- contaminated images. In a 3-D NLM algorithm, the estimate of a pixel at position (p,q) is |
 |
 |
3.2 NLM-RE |
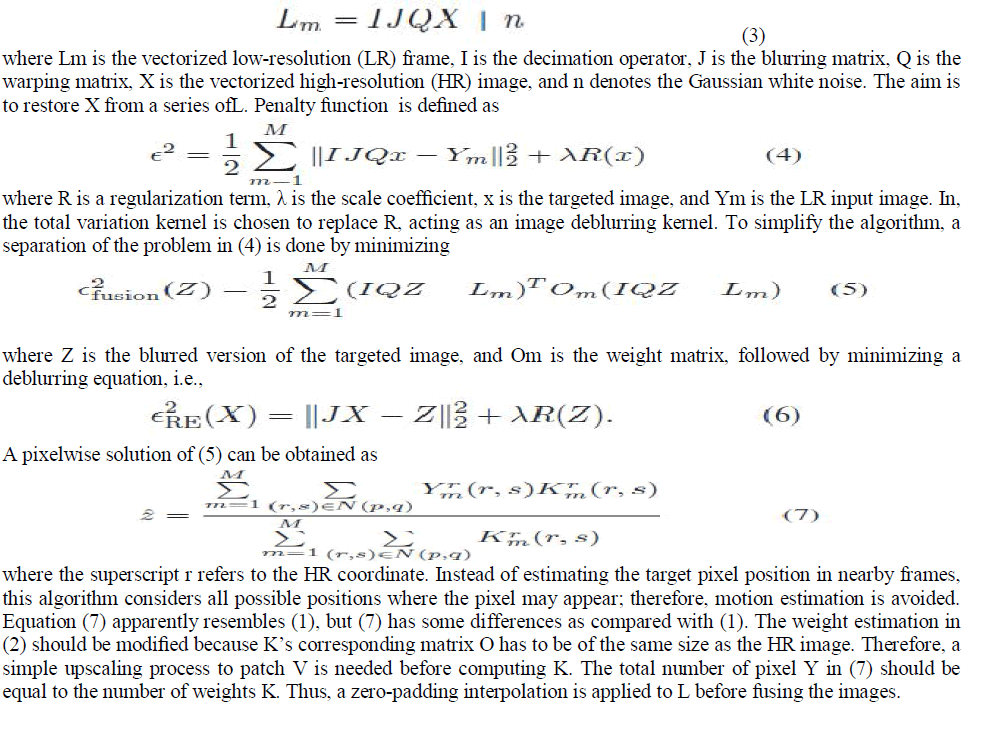
| RE is achieved by modifying NLM with the following model : |
 |
3.3 PROPOSED TECHNIQUE |
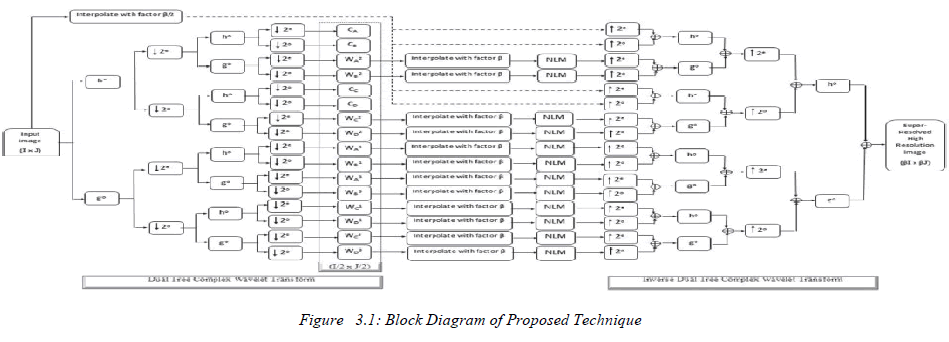 |
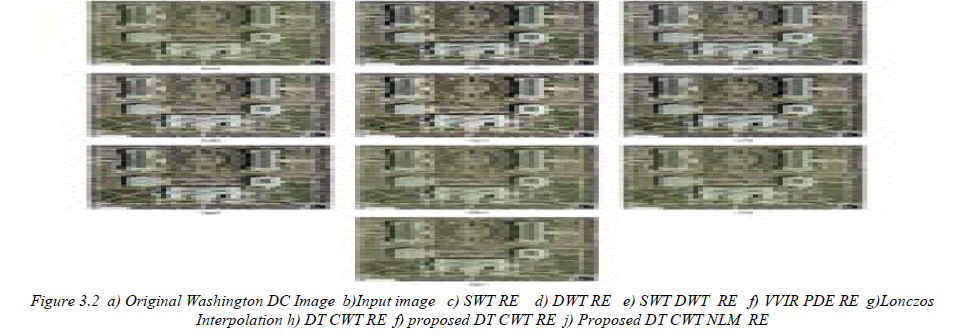
| In the proposed algorithm (DT-CWT-NLM-RE), we decompose the LR input image (for the multichannel case, each channel is separately treated) in different subbands (i.e., Ci and Wj i , where i ∈{A,B,C,D} and j ∈{ 1,2,3}) by usingDT-CWT, as shown in Figure3.1.Ci values are the image coefficient subbands, and Wj i are the wavelet coefficient subbands. The subscripts A, B, C, and D represent the coefficients at the even-row and even-column index, the odd-row and even- column index, the even-row and odd-column index and the odd-row and odd-column index, respectively, whereas h and g represent the low-pass and high-pass filters, respectively. The superscript e and o represent the even and odd indices, respectively. Wj i values are interpolated by factor β using the Lanczos interpolation (having good approximation capabilities) and combined with the β/2-interpolated LR input image. Since Ci contains low-pass-filtered image of the LR input image, therefore, high-frequency information is lost. To cater for it, we have used the LR input image instead of Ci. Although the DT-CWT is almost shift invariant, however, it may produce artifacts after the interpolation of Wji.Therefore, to cater for these artifacts, NLM filtering is used. All interpolated Wj i values are passed through the NLM filter. Then, we apply the inverse DT-CWT to these filtered subbands along with the interpolated LR input image to reconstruct the HR image. The results presented show that the proposed DT-CWT-NLM-RE algorithm performs better than the existing wavelet-domain RE algorithms in terms of the peak-signal-to- noise ratio (PSNR), the MSE, and the Q-index. |
 |
IV. RESULTS |
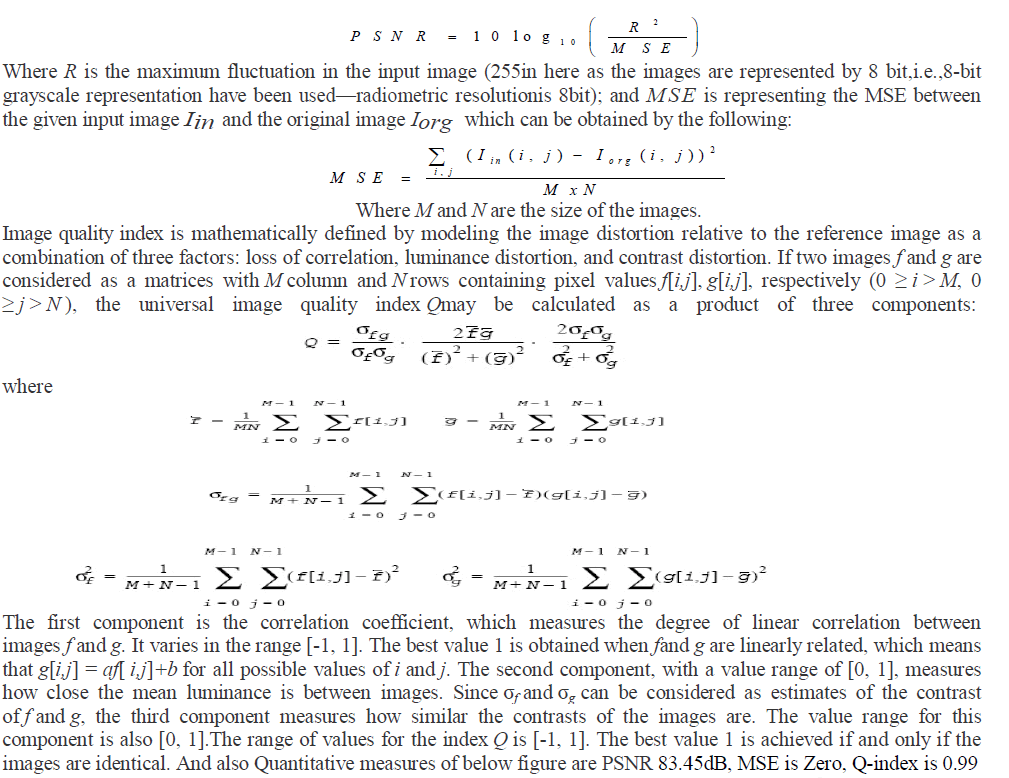
| Quantitative comparisons confirm the superiority of the proposed method. Peak signal-to-noise ratio(PSNR) and mean square error (MSE) have been implemented inorder to obtain some quantitative results for comparison. PSNR can be obtained by using the following formula |
 |
 |
| As expected, highest level of information content is embedded in the original images. The main reason of having the relatively high information content level of the images generated by the proposed method is due to the fact that the un quantized input LL sub and images contain most of the information of the original high-resolution |
V. CONCLUSION |
| The RE technique based on DT-CWT and an NLM filter has been proposed. The technique decomposes the LR input image using DT-CWT. Wavelet coefficients and the LR in- put image were interpolated using the Lanczos interpolator. DT-CWT is used since it is nearly shift invariant and generates less artifacts, as compared with DWT. NLM filtering is used to overcome the artifacts generated by DT-CWT and to further enhance the performance of the proposed technique in terms of MSE, PSNR, and Q-index. Simulation results highlight the superior performance of proposed techniques. |
References |
|