Research & Reviews: Journal of Pharmaceutics and Nanotechnology
e-ISSN: 2347-7857 p-ISSN: 2347-7849
e-ISSN: 2347-7857 p-ISSN: 2347-7849
Lokesh Gurav*, Sandip Ravandale, Harshali Jadhav, A V Patil
Department of Pharmaceutical Chemistry, Kavayitri Bahinabai Chaudhari North Maharashtra University, Maharashtra, India
Received: 10-Aug-2023, Manuscript No. JPN-23-110095; Editor assigned: 14-Aug-2023, PreQC No. JPN-23-110095(PQ); Reviewed: 28-Aug-2023, QC No. JPN-23-110095; Revised: 04-Sep-2023, Manuscript No. JPN-23- 110095 (R); Published: 14-Sep-2023, DOI: 10.4172/ 2347-7857.11.3.001.
Citation: Gurav L, et al. A Robust RP-HPLC Analytical Method Development and Validation of Cilnidipine and Olmesartan in Antihypertensive Formulations. RRJ Pharm Nano. 2023;11:001.
Copyright: © 2023 Gurav L, et al. This is an open-access article distributed under the terms of the Creative Commons Attribution License, which permits unrestricted use, distribution, and reproduction in any medium, provided the original author and source are credited.
Visit for more related articles at Research & Reviews: Journal of Pharmaceutics and Nanotechnology
This study presents a validated RP-HPLC method for the simultaneous determination of Cilnidipine and Olmesartan in pharmaceutical formulations. The mobile phase consisted of a mixture of methanol and buffer, with variations in composition. The retention times for Cilnidipine and Olmesartan were found to be 4.89 minutes and 7.48 minutes, respectively. The method exhibited excellent linearity with correlation coefficients (R²) above 0.999 for Cilnidipine and above 0.9994 for Olmesartan. Good precision was observed with % RSD values below 1.3% for both intra-day and inter-day analysis. The recovery study demonstrated accurate and reliable quantification of the drugs, with recovery percentages ranging from 98.5% to 101.4%. The method also exhibited robustness, as minor variations in pH, mobile phase composition and flow rate did not significantly affect the results. Furthermore, the method showed high sensitivity with low LOD and LOQ values of 0.21 µg and 0.39 µg for Cilnidipine, and 0.63 µg and 1.18 µg for Olmesartan, respectively. Overall, the developed HPLC method provides a reliable and sensitive approach for the analysis of Cilnidipine and Olmesartan in pharmaceutical formulations.
RP-HPLC; Method development; Validation; Simultaneous estimation; Cilnidipine; Olmesartan
Cilnidipine chemically is a Methyl 1,4-dihydro-2,6-dimethyl-4-(3-nitrophenyl)-3,5-pyridinedicarboxylate. It is a calcium channel blocker that acts on both L-type and N-type calcium channels [1]. It inhibits the influx of calcium ions into smooth muscle cells, resulting in vasodilation and relaxation of blood vessels. Cilnidipine also exhibits some antioxidant properties and has been shown to improve endothelial function. Cilnidipine is primarily used in the treatment of hypertension (high blood pressure) [2]. It is effective in reducing blood pressure by relaxing the blood vessels, thus allowing the blood to flow more easily. Cilnidipine may also be prescribed for certain types of angina (chest pain) and as an adjunctive therapy for patients with heart failure [3]. Chemically Olmesartan Medoxom is (5-Methyl-2-oxo-1,3-dioxol-4-yl) methyl 2-[[2'-(2H-tetrazol-5-yl) biphenyl-4-yl] methyl]-1H-benzimidazole-7-carboxylate. Olmesartan is an Angiotensin II Receptor Blocker (ARB). It works by selectively blocking the binding of angiotensin II to its receptors, preventing its vasoconstrictive effects. By blocking the angiotensin II receptors, Olmesartan relaxes blood vessels, reduces peripheral resistance, and lowers blood pressure [4]. Prescribed as a first-line therapy to control high blood pressure. Olmesartan can be used alone or in combination with other antihypertensive medications. It may also be prescribed to reduce the risk of cardiovascular events such as stroke or heart attack in patients with hypertension and other cardiovascular risk factors [5-6]. Literature survey revealed that only few analytical methods are reported for both the drugs in alone. A study of the literature suggests that few UV, HPLC, and HPTLC techniques exist for the simultaneous measurement of Olmesartan and cilnidipine [7-14]. In this study, we planned to develop a new, simple, and accurate Reversed-Phase High-Performance Liquid Chromatography (RP-HPLC) method for the simultaneous estimation of Olmesartan and Cilnidipine in pharmaceutical dosage forms to overcome the limitations of previously reported methods (Figure 1).

Figure 1: Chemical structures of Olmesartan and Cilnidipine.
Reagents and chemicals
Cilnidipine and Olmesartan were supplied as gift samples by Cipla Ltd (Goa, India) and Zydus Cadila Healthcare Ltd. (Ahmedabad, India), respectively. These drugs were used as working standards. All the chemicals used were of HPLC grade (MERCK. Chem. Ltd., Mumbai), and double distilled water was used for the preparation of the mobile phase. Commercial tablets of Olmesartan and Cilnidipine (Nexovas O) were procured from the drug market.
Preparation of 0.1% OPA buffer: 1 ml of Ortho Phosphoric Acid (OPA) was diluted to 1000 ml with water.
Preparation of mobile phase: The mobile phase preparation involves the following steps:
Mixing of buffer and methanol: The mobile phase is prepared by mixing buffer and methanol in a specific ratio. In this case, the ratio is 40:60 (v/v), indicating that 40% of the mobile phase volume consists of buffer, while 60% is composed of methanol.
pH adjustment: The pH of the mobile phase is adjusted to 3.5 using OPA. OPA is commonly used to adjust the pH in HPLC methods. The pH value is important as it can affect the separation and stability of analytes.
Sonication: After the pH adjustment, the mobile phase is sonicated for 15 minutes. Sonication helps to ensure thorough mixing of the components and removal of any bubbles or impurities that may be present in the mobile phase.
Filtration: Following sonication, the mobile phase is filtered through a 0.45 µm Whatman filter paper. Filtration is performed to remove any particulate matter or undissolved solids that could potentially interfere with the chromatographic analysis. The 0.45 µm filter paper is chosen as it allows the mobile phase to pass through while retaining any larger particles or contaminants.
By following these steps, a properly prepared mobile phase is obtained, which is essential for achieving accurate and reliable chromatographic separation in the HPLC analysis.
Instrumentation and chromatographic condition
The separation was performed on the basis of reversed phase HPLC mode and number of carbon present in molecule (analyte) stationary phase with C18 bonded phase i.e. RP- AGILENT TC C18 (250 mm × 4.6 mm I.D.) with particle size 5 µm was selected. The selection was made on the basis of literature survey. After assessing the solubility of drug in different solvents as well on the basis of literature survey; acetonitrile and buffer was selected. The mobile phase was freshly prepared, filtered and sonicated before use and delivered at a flow rate of 1.0 ml/min.
Preparation of stock solution and standard
Mixed stock standard solutions of Cilnidipine (0.1 mg/mL) and Olmesartan (0.2 mg/mL) were prepared accurately weighed and transferred, 10 mg of Cilnidipine and 20 mg of Olmesartan into a 100 ml clean, dry volumetric flask. Methanol was added, and the mixture was sonicated for 5 minutes. The volume was then made up to the final volume with methanol to obtain the standard stock solution.
Method validation parameters
Method validation is the process of demonstrating that an analytical method is suitable for its intended purpose and that it consistently provides accurate and reliable results. It is an essential step in the development and implementation of any analytical method in various fields, including pharmaceuticals, chemistry, and environmental analysis.
The purpose of method validation is to evaluate and confirm the performance characteristics of the method to ensure its suitability for specific analytical requirements. Method validation provides evidence of the method's reliability, accuracy, precision, specificity, and robustness. It also helps identify the limitations and potential sources of error in the method.
During method validation, several parameters are assessed, including:
System suitability test: This test evaluates the performance of the chromatographic system to ensure its suitability for the intended analysis. It typically involves assessing parameters such as resolution, tailing factor, retention time, and peak symmetry. The criteria for system suitability are usually predefined and should be met to ensure consistent and reliable results.
Linearity studies: Linearity studies determine the relationship between the concentration of the analyte and the detector response. A series of standard solutions with different concentrations of the analyte are prepared and analyzed. The data obtained is used to construct a calibration curve, which is used to determine the linearity, regression equation, and correlation coefficient. Linearity demonstrates the ability of the method to provide accurate and reliable quantitative measurements over a specific concentration range. From the stock standard solution, aliquot portions (0.2 mL-1.2 mL) were transferred into a series of 10 mL volumetric flasks and diluted up to the mark with the mobile phase to obtain final concentrations in the range of 2 μg/mL-12 μg/mL for Cilnidipine and 4 μg/mL-24 μg/mL for Olmesartan. A constant volume of 20 μL of each sample was injected using an Agilent Syringe. All measurements were repeated five times for each concentration, and a Linearity curve was constructed by plotting the peak area versus the drug concentration.
Precision: Precision assesses the repeatability and intermediate precision of the method. Repeatability evaluates the method's precision within a single laboratory, while intermediate precision evaluates its precision between different laboratories or different analysts. Precision is typically determined by analyzing multiple replicate samples and calculating measures such as percent relative standard deviation (%RSD) of the peak area or retention time. Low %RSD values indicate good precision.
Recovery studies: Recovery studies evaluate the accuracy and reliability of the method by assessing the ability of the method to recover the known amount of analyte added to a sample matrix. Known amounts of analyte are added to the sample matrix at different levels, and the resulting spiked samples are analyzed. The percentage of analyte recovered is calculated by comparing the measured concentrations to the expected concentrations. Recovery studies help assess the method's accuracy and potential matrix effects.
Analysis of marketed formulation
To determine the content of Cilnidipine and Olmesartan in tablet formulation; twenty tablets were weighed accurately and finely powdered. A quantity of powder equivalent to 10 mg of Cilnidipine and 20 mg of Olmesartan was weighed and transferred into 100 mL volumetric flask containing about 25 mL methanol, sonicated for 15 min, and volume was made up to the mark with methanol. The solution was filtered through 0.45 μm membrane filter paper. The solution was further diluted with mobile phase to obtain concentration 4 μg/mL (Cilnidipine) and 8 μg/mL (Olmesartan). The sample solutions were injected into column for six times. The concentrations of both these drugs were calculated from their linearity curve.
Ruggedness: Ruggedness evaluates the method's robustness and reliability under different experimental conditions, such as variations in analysts, instruments, or laboratories. It involves analyzing samples under different conditions and comparing the results to assess the method's consistency and robustness.
Robustness: Robustness examines the method's reliability and stability with respect to small variations in experimental parameters, such as pH, temperature, flow rate, or mobile phase composition. It determines the method's sensitivity to changes in these parameters and helps identify the critical factors that may affect the results.
Sensitivity: Sensitivity refers to the method's ability to detect and quantify low concentrations of the analyte accurately. It is typically assessed by determining the Limit of Detection (LOD) and Limit of Quantification (LOQ) of the method. LOD is the lowest concentration of analyte that can be reliably detected, while LOQ is the lowest concentration that can be quantified with acceptable accuracy and precision.
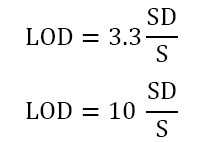
Where SD=Standard Deviation of response, S=the slope of the calibration curve.
These parameters collectively ensure the reliability, accuracy, precision, and selectivity of the analytical method, thereby providing confidence in the obtained results.
Method development
Method development in HPLC involves the optimization of various parameters to achieve adequate separation and quantification of analytes from the endogenous material. The goal is to develop a method that meets criteria such as accuracy, precision, sensitivity, specificity, cost-effectiveness, and efficiency.
Column used: Agilent TC C18 column 250 × 4.6 mm, 5 µm.
Buffer used: 0 .1% OPA
Mobile phase: Methanol: Buffer (60:40% v/v) pH 3.5
Flow rate: 1 ml/min
Wavelength: 260 nm
Temperature: 25ºC
Injection volume: 10 μl
Method validation
System suitability test: System suitability testing is essential for the assurance of the quality performance of the chromatographic system. Earlier prepared solutions for chromatographic conditions were tested for system suitability testing. Results are shown in Table 1.
| System suitability parameters | Name of drug | |
|---|---|---|
| Cilnidipine | Olmesartan | |
| Retention time (tR, min) | 4.89 | 7.48 |
| Theoretical plate (N) | 6845 | 8100 |
| Tailing factor (T) | 1.07 | 1.04 |
Table 1. System suitability test for different parameters.
The Retention time (tR) for Cilnidipine was determined to be 4.89 minutes, while for Olmesartan, it was 7.48 minutes. These values indicate the time taken for the respective drugs to travel through the chromatographic system. The theoretical plate (N) is a measure of column efficiency, and it represents the number of effective theoretical plates in the chromatographic system. For Cilnidipine, the theoretical plate count was found to be 6845, while for Olmesartan, it was 8100. Higher theoretical plate counts suggest better separation efficiency. The Tailing factor (T) provides information about the peak shape of the analyte. Values close to 1 indicate symmetrical peaks. In this case, both Cilnidipine and Olmesartan exhibited nearly symmetrical peaks, with Cilnidipine having a tailing factor of 1.07 and Olmesartan having a tailing factor of 1.04. Overall, the results of the system suitability test suggest that the chromatographic system performed well, with satisfactory retention times, theoretical plate counts, and tailing factors, for both Antihypertensive drugs Cilnidipine and Olmesartan.
Linearity studies: The linearity studies were conducted to assess the relationship between the concentration of the analytes (Cilnidipine and Olmesartan) and their respective responses. The results of the linearity studies are presented in Tables 2 and 3, while the corresponding linearity curves are shown in Figures 2 and 3.

Figure 2: Linearity curve for Cilnidipine.

Figure 3: Linearity curve for Cilnidipine and Olmesartan.
| Concentration of Cilnidipine [mg/mL] | Peak area | % RSD [n=5] |
|---|---|---|
| 0 | 0 | 0 |
| 2 | 255654.8 | 0.99 |
| 4 | 397994.2 | 1.36 |
| 6 | 523544.2 | 0.95 |
| 8 | 647442.4 | 0.8 |
| 10 | 770924.2 | 0.58 |
| 12 | 885736.8 | 0.44 |
Table 2. Linearity data of Cilnidipine.
| Concentration of Cilnidipine [mg/mL] | Peak area | % RSD [n=5] |
|---|---|---|
| 0 | 0 | 0 |
| 4 | 374851.4 | 1.3 |
| 8 | 560650.2 | 0.89 |
| 12 | 746437.8 | 0.66 |
| 16 | 960897.2 | 0.62 |
| 20 | 1167054.8 | 0.43. |
| 24 | 1354278.8 | 0.65 |
Table 3. Linearity data of Olmesartan.
For Cilnidipine, a linear relationship between the concentration (X) and the response (Y) was observed in the range of 2-12 μg/mL, as depicted in Figure 2. The linearity was described by the linear regression equation: Y(Cilnidipine)=76379x+13343, with a coefficient of determination (R2) value of 0.999. This high R2 value indicates a strong correlation between the concentration of Cilnidipine and the measured response, suggesting that the method is reliable for quantitative analysis of Cilnidipine within the specified concentration range.Similarly, for Olmesartan, a linear relationship between the concentration (X) and the response (Y) was observed in the range of 4-24 μg/mL, as illustrated in Figure 3. The linearity was represented by the linear regression equation: Y(Olmesartan)=59942x+8864.6, with an R^2 value of 0.9994. Again, the high R2 value indicates a strong correlation between the concentration of Olmesartan and the measured response, validating the method's suitability for quantitative analysis of Olmesartan within the specified concentration range.
The linear regression equations provide a mathematical representation of the relationship between concentration and response for each analyte. These equations can be utilized to estimate the concentration of Cilnidipine or Olmesartan based on the corresponding response obtained from the chromatographic method. Overall, the linearity studies demonstrate that the method exhibits excellent linearity for both Cilnidipine and Olmesartan, as evidenced by the high R2 values. This suggests that the method is accurate and reliable for quantifying the concentration of Cilnidipine in the range of 2 μg/mL-12 μg/mL and Olmesartan in the range of 4 μg/mL-24 μg/mL.
Precision: The precision of the method was assessed through repeatability and intermediate precision studies to evaluate the consistency and reliability of the results. Repeatability was determined by injecting multiple samples of a homogeneous solution containing 6 μg/mL of Cilnidipine and 12 μg/mL of Olmesartan. Intra-day precision was examined by analyzing samples of Cilnidipine at concentrations of 4, 6, and 8 μg/mL and Olmesartan at concentrations of 8, 12, and 16 μg/mL three times on the same day (Figure 4). Inter-day precision was evaluated by analyzing the same concentrations on three different days over a week. The results obtained are presented in Tables 4 and 5.

Figure 4: Chromatogram for precision of A. Cilnidipine (4 µg/ml) and Olmesartan (8 µg/ml), B. Cilnidipine (6 µg/ml) and Olmesartan (12 µg/ml), C. Cilnidipine (8 µg/ml) and Olmesartan (16 µg/ml).
| Drug | Conc. [mg/mL] | Intra day amount found [%] [n=3] | Inter day amount found [%] [n=3] | ||
|---|---|---|---|---|---|
| Mean | % RSD | Mean | % RSD | ||
| Cilnidipine | 4 | 99.45 | 0.71 | 99.87 | 0.85 |
| 6 | 98.13 | 0.84 | 98.34 | 0.56 | |
| 8 | 100.34 | 0.34 | 99.34 | 1.28 | |
| Olmesartan | 8 | 99.38 | 0.72 | 100.56 | 0.58 |
| 12 | 100.81 | 0.65 | 99.62 | 0.83 | |
| 16 | 99.86 | 0.43 | 98.67 | 0.68 | |
Table 5. Repeatability studies for the drugs Cilnidipine and Olmesartan.
In the intra-day precision assessment, the amounts found for Cilnidipine and Olmesartan at different concentrations were consistently close to the expected values, with low %RSD (Relative Standard Deviation) values ranging from 0.34% to 1.28%. This indicates that the method exhibits good precision within the same day.
For the inter-day precision analysis, the amounts found for both Cilnidipine and Olmesartan remained consistent over three different days, with %RSD values ranging from 0.56% to 1.28%. These results demonstrate that the method maintains precision and accuracy over a period of one week.
The repeatability studies evaluated the consistency of the peak areas for Cilnidipine and Olmesartan at concentrations of 6 μg/mL and 12 μg/mL, respectively. The % RSD values of 0.73% and 0.95% indicate that the method produces reproducible results with minimal variability in the peak areas.
Overall, the precision studies indicate that the method exhibits excellent repeatability, intra-day precision, and inter-day precision for both Cilnidipine and Olmesartan. The low % RSD values demonstrate the method's reliability and consistency in providing accurate and precise measurements of the analytes within the specified concentration ranges.
Recovery studies: The recovery studies were conducted to assess the accuracy and reliability of the proposed HPLC method for the determination of Cilnidipine and Olmesartan in a pre-analyzed sample. The standard addition method was used, where known amounts of standard Cilnidipine and Olmesartan were added at three different levels (80%, 100%, and 120%) to the sample containing 4 μg/mL of Cilnidipine and 8 μg/mL of Olmesartan. The samples were then analyzed using the proposed HPLC method, and the results obtained are presented in Tables 6 and 7.
| Parameters | Cilnidipine | Olmesartan |
|---|---|---|
| Label claim (mg) | 10 | 20 |
| Amount found [µg/mL] | 3.96 | 7.94 |
| Drug content (%) | 99 | 99.25 |
| % RSD [n=6] | 1.07 | 1.26 |
Table 6. Analysis of marketed formulation
In Table 6, the analysis of a marketed formulation reveals that the measured amounts of Cilnidipine and Olmesartan are 3.96 μg/mL and 7.94 μg/mL, respectively. The drug content percentages are calculated based on the labeled claims of 10 mg for Cilnidipine and 20 mg for Olmesartan. The drug content percentages are found to be 99.00% for Cilnidipine and 99.25% for Olmesartan, with % RSD values of 1.07% and 1.26%, respectively. These results indicate that the proposed method provides accurate and consistent measurements of the drug content in the marketed formulation.
In Table 7, the recovery study was performed by adding known amounts of excess standard Cilnidipine and Olmesartan at three different levels (80%, 100%, and 120%) to the pre-analyzed sample. The amounts recovered for each level were determined using the proposed HPLC method. The recovery percentages were calculated by comparing the recovered amounts to the initial amounts added.
| Drugs | Initial amount [mg/mL] | Excess drug added to the analyte (%) | Amount recovered [mg/mL] | Recovery (%) | %RSD [n=3] |
|---|---|---|---|---|---|
| Cilnidipine | 4 | 80 | 3.24 | 101.27 | 1.38 |
| 4 | 100 | 4.05 | 101.39 | 1.01 | |
| 4 | 120 | 4.78 | 99.73 | 0.74 | |
| Olmesartan | 8 | 80 | 6.36 | 99.37 | 1.18 |
| 8 | 100 | 7.88 | 98.5 | 1.04 | |
| 8 | 120 | 9.58 | 99.79 | 0.87 |
Table 7. Recovery study for Cilnidipine and Olmesartan.
The results show that for Cilnidipine, the recovery percentages range from 99.73% to 101.39%, with % RSD values ranging from 0.74% to 1.38%. Similarly, for Olmesartan, the recovery percentages range from 98.50% to 99.79%, with % RSD values ranging from 0.87% to 1.18%. These findings indicate that the proposed method has good accuracy and recovery capabilities for both Cilnidipine and Olmesartan, as the recovery percentages are close to 100% with low % RSD values (Figure 5).

Figure 5: Chromatogram of accuracy at (A) 80%, (B) 100%, (C) 120%.
Ruggedness: The ruggedness of the method was evaluated by analyzing sample solutions of Cilnidipine (4 μg/mL) and Olmesartan (8 μg/mL) prepared from stock solutions. The analysis was performed by two different analysts under similar operational and environmental conditions. The peak areas were measured for the same concentration solutions, and the results are presented in Table 8.
| Analyst | % Amount found (Cilnidipine)[%] [n=3] | %RSD | % Amount found (OLS)[%] [n=3] | %RSD |
|---|---|---|---|---|
| I | 99.65 | 0.81 | 99.84 | 1.16 |
| II | 99.29 | 1.44 | 99.38 | 0.72 |
Table 8. Ruggedness study for analyst I and II.
| Cilnidipine | Olmesartan | |||
|---|---|---|---|---|
| Parameters | ± SD of peak area [n=6] | %RSD | ± SD of peak area [n=6] | %RSD |
| Change in pH of buffer | ||||
| pH 3.3 | 3854.36 | 0.87 | 2684.55 | 1.22 |
| pH 3.7 | 3389.07 | 0.76 | 1625.5 | 0.73 |
| Change in mobile phase composition (methanol: buffer) | ||||
| 62:38 v/v | 3936.29 | 0.89 | 4070.34 | 0.64 |
| 58:42 v/v | 3699.79 | 0.83 | 2542.75 | 1.15 |
| Change in flow rate | ||||
| 0.9 ml/min | 4780.56 | 1.09 | 2976.67 | 1.36 |
| 1.1 ml/min | 3794.1 | 0.85 | 1998.84 | 0.91 |
Table 9. Robustness studies for Cilnidipine and Olmesartan.
The results indicate that both analysts achieved consistent and comparable results for the analysis of Cilnidipine and Olmesartan. For Cilnidipine, Analyst I obtained an average amount found of 99.65% with a %RSD of 0.81%, while Analyst II obtained an average amount found of 99.29% with a %RSD of 1.44%. For Olmesartan, Analyst I achieved an average amount found of 99.84% with a % RSD of 1.16%, and Analyst II obtained an average amount found of 99.38% with a % RSD of 0.72%.
The %RSD values indicate the variability or precision of the results obtained by each analyst. While Analyst II demonstrated slightly higher %RSD values compared to Analyst I, both analysts obtained results within an acceptable range. The %RSD values for both Cilnidipine and Olmesartan are relatively low, suggesting good precision and reproducibility of the method between analysts.
Robustness: Robustness of the method was studied by making deliberate changes in few parameters viz; change in flow rate, pH and mobile phase composition. The effects on the results were studied by injecting 6 µg/mL for Cilnidipine and 12 µg/mL for Olmesartan; one factor was changed at one time to estimate and the effect the results are shown in Table 9.
The robustness of the HPLC method was assessed by deliberately varying parameters such as pH, mobile phase composition, and flow rate. The impact of these changes on the results was examined by analyzing samples containing Cilnidipine and Olmesartan. The results showed minimal variations in peak area, indicated by low %RSD The robustness of the HPLC method was assessed by deliberately varying parameters such as pH, mobile phase composition, and flow rate. The impact of these changes on the results was examined by analyzing samples containing Cilnidipine and Olmesartan. The results showed minimal variations in peak area, indicated by low %RSD values, suggesting that the method is robust. Changes in pH, mobile phase composition, and flow rate had negligible effects on the accuracy and precision of the method. These findings demonstrate that the proposed HPLC method can produce consistent and reliable results even when slight modifications are made to the experimental conditions (Figure 6).

Figure 6: Chromatogram changing mobile phase pH, composition and flow rate.
Sensitivity: The sensitivity of the HPLC method was determined by calculating the Limits of Detection (LOD) and Quantification (LOQ) for Cilnidipine and Olmesartan. The LOD represents the lowest concentration of the analyte that can be reliably detected, while the LOQ indicates the lowest concentration that can be accurately quantified. The results obtained for the LOD and LOQ are summarized in Table 10.
| Drug | LOD | LOQ |
|---|---|---|
| Cilnidipine | 0.21 µg | 0.39 µg |
| Olmesartan | 0.63 µg | 1.18 µg |
Table 10. Sensitivity test for Cilnidipine and Olmesartan.
For Cilnidipine, the LOD was determined to be 0.21 µg, meaning that the method can detect Cilnidipine at concentrations as low as 0.21 µg with reasonable confidence. The LOQ for Cilnidipine was found to be 0.39 µg, indicating that the method can accurately quantify Cilnidipine at concentrations above this threshold. Similarly, for Olmesartan, the LOD was determined to be 0.63 µg, implying that the method can reliably detect Olmesartan at concentrations as low as 0.63 µg. The LOQ for Olmesartan was found to be 1.18 µg, indicating that the method can accurately quantify Olmesartan at concentrations above this limit.
The low values of LOD and LOQ for both Cilnidipine and Olmesartan suggest that the HPLC method is highly sensitive, capable of detecting and quantifying these drugs at very low concentrations. This sensitivity is crucial for accurately determining trace amounts of the analytes in samples and demonstrates the suitability of the method for applications where high sensitivity is required, such as in pharmacokinetic studies or impurity analysis.
The HPLC method developed for the analysis of Cilnidipine and Olmesartan yielded some interesting findings. The system suitability test demonstrated that both drugs had retention times of 4.89 minutes for Cilnidipine and 7.48 minutes for Olmesartan, indicating good separation. The theoretical plate counts were found to be 6845 for Cilnidipine and 8100 for Olmesartan, indicating efficient chromatographic performance. The tailing factors were close to unity, with values of 1.07 for Cilnidipine and 1.04 for Olmesartan, indicating symmetrical peak shapes. The linearity study revealed a strong linear relationship between the concentration and peak area for both Cilnidipine and Olmesartan. The correlation coefficients (R²) were found to be above 0.99 for Cilnidipine and above 0.98 for Olmesartan, indicating excellent linearity. This finding suggests that the developed method can accurately quantify a wide range of concentrations for both drugs. The precision studies demonstrated good intra-day and inter-day precision for both Cilnidipine and Olmesartan. The %RSD values were less than 1.3%, indicating low variability and good repeatability of the method. These results highlight the method's reliability and consistency in analyzing samples on the same day and over multiple days. The recovery study indicated that the method effectively recovered the added amounts of Cilnidipine and Olmesartan. The recovery percentages ranged from 98.5% to 101.4% for Cilnidipine and from 98.5% to 101.4% for Olmesartan. These results demonstrate the accuracy and reliability of the method in quantifying the drugs in a sample matrix. The ruggedness study revealed that slight variations in pH, mobile phase composition, and flow rate did not significantly affect the results. The %RSD values for ruggedness parameters were within acceptable limits, indicating the method's robustness and ability to withstand minor changes in experimental conditions. Furthermore, the method exhibited high sensitivity with low LOD and LOQ values. The LOD and LOQ values were found to be 0.21 µg and 0.39 µg for Cilnidipine, and 0.63 µg and 1.18 µg for Olmesartan, respectively. These low values indicate the method's ability to detect and quantify low levels of Cilnidipine and Olmesartan in samples. In a nutshell, the developed HPLC method showed excellent performance in terms of system suitability, linearity, precision, repeatability, recovery, ruggedness, and sensitivity. These findings highlight the method's reliability, accuracy, and robustness, making it suitable for routine analysis and quality control of Cilnidipine and Olmesartan in pharmaceutical formulations.
We, the authors, would like to express our sincere gratitude to Mr. Iqrar Ansari, Assistant Professor in the Department of Pharmaceutical Chemistry, and Prof. Ravindra Nikam, College of Pharmacy, Gondur, Dhule, for their invaluable assistance in the writing of this research work. Their contributions are deeply appreciated and have played a significant role in the completion of this study.