Research & Reviews: Journal of Ecology and Environmental Sciences
ISSN: 2347-7830
ISSN: 2347-7830
1Mechanical Engineering Department, Sebha University, Brack, Libya
2Electrical Engineering Department, Palestine Technical University, Kadoorie, Tulkarm, Palestine
Received Date: 05/11/2017; Accepted Date: 27/11/2017; Published Date: 04/12/2017
Visit for more related articles at Research & Reviews: Journal of Ecology and Environmental Sciences
This study aims to identify the quantities of hazardous gases emitted from different sources of air pollution in Libya, attempting to meet the lack of information, to provide the decision makers with the information and guidelines related to the environmental situation of the country, to fulfill the role assigned to us to mitigate the global warming and to put the polices and strategies of the development in line world policies direction. This study presents a frame work for any steps addressing air pollution abatement. The present research shows that the annual total air emissions is about 61.1 million tonnes. The largest share of emissions was for carbon dioxide CO2 (96.76%), followed by carbon monoxide CO (2.13%), then particulate matters PM (0.55%), then sulfuric dioxide SO2 (0.21%), nitrogen oxides NOX (0.18%), then methane gas CH4 (0.089%), voltaic organism component VOC (0.061%) and in the last ranking was nitrous oxide N2O with (0.028%). The annual total equivalent carbon dioxide is around 64.6 million tonnes eCO2, which represents about 9.7 ton/year/capita. Accordingly, Libya is ranking 53 from 225 in the list of countries by emissions of carbon dioxide with a contribution up to 0.22% and ranking 41 from 225 in the list of countries by emissions of carbon dioxide per capita. The present research reveals that most pollutants are emitted from the electricity industry with share of 33.9% followed by the transportation sector with 30.7% then the residential and commercial sector with 14.2% then the cement manufacturing industry with 10.9%. It was possible to mitigate these emissions by using the market available capture technologies. But unfortunately, they did not, which led to the excessive of harmful emissions to humans and the already fragile environment. Estimation of quantities of pollutants in units of mass of pollutant per unit mass of manufacturing product or fuel consumption, is necessary in order to figure out the socio-economic effect of the environment damage and to estimate the carbon price or tax of the industrial activities, similar to the countries which preceded us in this field. There is no work considered this topic in Libya and most of the little available works are in the measurements field, which measured the concentrations of the pollutants for comparison purposes with international standards and it is not possible to find out the quantities of emissions, due to the lack of data in these reports (such as productivity, fuel consumption, fluent gas flows through the chimneys, etc...), which makes these measurements in their present figures useless economically. This presents the novelty of this work. The present paper paved the way for more detailed survey on the air pollution sources and to draw the strategies for mitigation in Libya.
Environment, Air pollution, Global warming, Electricity, Pollutants
Air pollution is a concentration of foreign matter in the air that adversely affects the health and welfare of people. Air pollutants are the liquid, solid, gaseous, radioactive, or microbial chemicals suspended in the air, that are caused by different human activities related to industry, construction, transportation or natural resources. Such pollutants cause harmful effects to humans, animals and plants. Air pollution is considered one of the main pollution problems around the world. Most countries consider this problem a threat to national health and enforce strict regulations, among other solutions, trying to reduce it as much as possible. The main pollutants found in the air, are from combustion. Carbon Monoxide (CO) is produced by incomplete combustion of hydrocarbon-based fuels and it enters the bloodstream through the lungs and forms carboxyhemoglobin, which affects both healthy and ill people. Hydrocarbons (CXHY) are emitted by unburned or partially burned fuel and also when fuel evaporates directly into the atmosphere. Hydrocarbons include many toxic compounds that cause cancer and other adverse health effects. They also react with nitrogen oxides (NOX) in the presence of sunlight to form ozone (O3). A very significant portion of nitrogen oxides comes from cars in urban areas. These highly reactive gases are colorless and odorless, but they can often be seen combined with particles in the air as a reddish-brown layer of smog over many urban areas. Because their formation is aided by high temperatures and excess oxygen, motor vehicles are the primary source of nitrogen oxides. Carbon Dioxide (CO2) is a product of complete combustion. As a pollution concern, it doesn’t directly impair human health, but it is a greenhouse gas (GHG) that traps the earth’s heat and contributes to the potential for global warming. Particulate matter (PM) is produced mainly from cement manufacturing factories, quarrying and oil refinery industries. Melting lead and burning solid wastes are other major sources of air pollution. Libya has ratified the United Nations Framework Convention on Climate Change (UNFCCC), United Nations Convention to Combat Desertification (UNCCD), signed the Kyoto protocol (1997) and the Paris agreement on climate change (2015) and created a DNA in 2010. Libya vigorously works toward further international progress in the global warming as a security issue. Despite this effort there is a crucial lack of data and information on air emissions in general and on mitigation in particular, as appeared clearly from the Libyan national report which is presented in European Environment Agency in March 2015, where did not set out any indicator for pollution levels in Libya! [1]. Scientists and researchers are suffering from the difficultly of data collection, because no database exists; significant difficulties are encountered in specific data for end-use sectors. The main difficulties are: Lack of coordination between institutions involved in data collection, data availability, incomplete annual data set and approximation of unavailable data, conflict in available data. The estimation of the quantity of the pollutants in units of mass of pollutant per unit mass of manufacturing product or fuel consumption, is necessary in order to figure out the socioeconomic effect of the environment damage and to estimate the carbon price or tax of the industrial activities, similar to the counties which preceded us in this field. There is no work considered this topic for Libya and most of the little available works are field measurements, which measured the concentrations of the pollutants for comparison purposes with another international or regional standards-even we don’t have our own standards-and it is not possible to find out the quantities of emissions because the lack of design data and operation parameters in these reports (such as factory productivity, fuel consumption, fluent gas flows through the chimneys, etc..), which makes these measurements in their present figures useless from socio-economic point of view.
It is more convenient-in case if concentration is available-to formulate the annual pollutants emission in one of the following expressions:
The annual pollutants in (tons emission /year)-equation (1);
The pollutants per unit fuel consumption (tons emission/m3 fuel)-equation (2); or The pollutants per unit production (tons emission /ton production)-equation (3):
 (1)
(1)
 (2)
(2)
 (3)
(3)
Where,  and
and  are the pollutant mass based: on time (tons pollutant/year), unit fuel consumption (tons
pollutant/unit fuel consumption) and unit production (tons pollutant/unit production), respectively, F and P are the annual fuel
consumption (m3 or ton/year)and the annual production of the factory (m3 or ton/year), respectively, Ci presents the concentration
of the pollutant i (m3 of pollutant/106 m3 of fluent gases), pi indicates to the density of the pollutant i (kg/m3), the density of some
pollutants are presented in [2],
are the pollutant mass based: on time (tons pollutant/year), unit fuel consumption (tons
pollutant/unit fuel consumption) and unit production (tons pollutant/unit production), respectively, F and P are the annual fuel
consumption (m3 or ton/year)and the annual production of the factory (m3 or ton/year), respectively, Ci presents the concentration
of the pollutant i (m3 of pollutant/106 m3 of fluent gases), pi indicates to the density of the pollutant i (kg/m3), the density of some
pollutants are presented in [2],  is the volumetric flow rate of the fluent gases (m3/hr), Nh and Nd is the regime of work (hours per
a day) and (days pear a year), respectively. The present paper paved the way for more detailed survey on the air pollution sources
and to draw the strategies for the mitigation in Libya. However, the mitigation potential specially in the energy sector is certainly
very high, due to the high potential of renewable energy resources. Major sources of air pollution in Libya include industries,
power sector, residential (domestic sector) and transportation sector. The growth in urban population and extensive development activities have further added to the increased levels of air pollution in the country.
is the volumetric flow rate of the fluent gases (m3/hr), Nh and Nd is the regime of work (hours per
a day) and (days pear a year), respectively. The present paper paved the way for more detailed survey on the air pollution sources
and to draw the strategies for the mitigation in Libya. However, the mitigation potential specially in the energy sector is certainly
very high, due to the high potential of renewable energy resources. Major sources of air pollution in Libya include industries,
power sector, residential (domestic sector) and transportation sector. The growth in urban population and extensive development activities have further added to the increased levels of air pollution in the country.
Country General Context
Libya, located in North Africa between 25 latitude north and 17 longitude east, extends over 1,759,540 km2 with population of 6,653,210 people (July 2017). It is bordered by the Mediterranean Sea to the north, Egypt to the east, Sudan to the southeast, Chad and Niger to the south and Algeria and Tunisia to the west. Both the Mediterranean Sea and the desert affect Libya's weather. Figure 1 shows a map of Libya, indicating some important economic cities as well as the geographical location of Libya in the African continent. The climate is Mediterranean along coast; dry, extreme desert interior, in the winter, the weather is cold, with some rain on the coast. The Sahara is very dry and hot in the summer and cold and dry in the winter. Libya is an extensive and a wide-spaced country, the population is distributed along and cross this vast extension, making it difficult for any planner or executive to deliver services for all, nevertheless, 100% of population has access to drinkable water, electricity grid and communication facilities, linking the country a large network of paved roads and airports [3]. This situation places a great deal of pressure on energy demands, food supplies and even the environment by increasing the generation of waste and residues. Economically, Libya had depended on fossil fuels, petroleum and natural gas for its income energy, industrialization and development. Although some efforts have been made to diversify the sources of income, to a large extent, fossil fuels have continued to play a major role in the country's economy [4].

Figure 1: Map of Libya indicating the major sites, those which have economic activities and the geographic location of Libya in the African continent.
Air Emission Sources
There are two main sources of air pollution in Libya:
1. Natural, such as dust and sandstorms.
2. Anthropogenic activities including stationary sources, such as thermal power generating plants and industrial parks and mobile sources including vehicles, emissions from various industrial processes.
Libya has the highest per capita share of CO2 emissions compared to its neighbours. Libya has experienced significant growth in CO2 emissions, which is often related to economic growth.
Natural Air Emission Source
Sand storm
Dust storms are among the most severe environmental problems in certain regions of the World. It has estimated that the Sahara Desert alone contributes 2 × 10⁸ - 3.3 × 10⁸ tons per year or between 40–66% of the total dust. Dust storms may be traced as far as 4000 km from their origin. Environmental impacts of dust storms, reported in the literature include reduced soil fertility and damage to crops, a reduction of solar radiation and in consequence the efficiency of solar devices, damage to telecommunications and mechanical systems, dirt, air pollution, increase of respiratory diseases and so on [5]. On the 16th of May 2017, a dramatic dust storm moved over Libya which caused a heavy dust load, greatly affected visibility and air quality and caused a total airport shutdown as well as damage to buildings, vehicles, power poles and trees throughout the center of the country. This storm was massive enough to be seen clearly from outer space and is considered to be one of the heaviest recorded dust storms in the last decade as it illustrated in Figure 2.

Figure 2: Dust storm coming from the South -Western part of Libya source EUMETSAT 16/05/2017 at 05:00:00 UTC.
The impact of a dust storm on national and regional economies can't be overestimated. Due to the complexity of how the dust storms impact various socio-economic sectors in to different extents, few data regarding budgetary losses is available. A 2009 study suggests that increased dust-storms would result in annual losses of 12.7 bio USD in GDP per annum in the MEN A regional one. Considering that North Africa as a sub-region are more heavily affected by the dust storms than the MENA, the amount of annual GDP losses must be significantly higher [6].
• Negative socio-economic impact across all sectors (house hold level, labour productivity, loss of raw materials and perishable goods, spiking energy expenditures, damages to infrastructures, disruption of supply chains, telecommunications etc.).
• Reduced visibility affects transport: airports, border crossing points, ports remain closed.
• Increased cloud formation increases surface heat and further aggravates drought effects.
• Dust storms damage crops, cause soil loss and remove organic matter and nutrient-rich lightest particles, thereby reducing agricultural productivity. Large parts of Libya’s fertile soil have already been “blown” away.
• Intensification of desertification, drought and reduction of water supplies (drinking water, irrigation) and significant increase in soil salinity.
• Significant strains on the public health sector. Hospitals are over whelmed in dealing with acute and chronic respiratory affections caused by SDS.
Anthropogenic Air Emission Sources
The main sources of air pollution in Libya are the electrical power plants, the various means of transportation, the smoke rising from the chimneys of factories, the heavy dust from quarries, the burning of solid wastes and the effects of water treatment projects.
Electricity generation
Unfortunately, most of the electricity in Libya is made from polluting, non-renewable sources such as fossil fuel and natural gas, in spite of the country has high potential of renewable energies. In fact, making electricity is the 1st industrial cause of air pollution in Libya and it creates more carbon dioxide (CO2) into the air than any other sector. Emissions of Electric power plants are factors in three major environmental issues: Acid rain, urban air quality and global climate change. Libya electrical generation is based on 13 power plant stations, most of them are located along the coastal side of Libya, as it is presented in Figure 2. The total capacity is 8051 MW with the contribution of the steam stations of 20%, while 43% for gas plants and the share of the combined cycle plants is 37%. The energy produced from Libyan stations comes from combustion of heavy oil (20%), light oil (40%) and natural gas (40%) (Figure 3). The total electricity generated in 2012 is 33,980 MWh with average efficiency of 27%. Figure 2 shows the location, characteristics of the electricity generation power plants and the electricity consumption by sectors in Libya. The fossil fuel and natural gas consumption during the year 2012 is presented in following Table 1. The emission factors for several types of fossil fuel and natural gas that fired in the boilers of steam generators or burned in the combustion chambers of the gas and combined power plants are tabulated in Table 2 [7].

Figure 3: Locations and statistics of produced energy during the year 2012 according to technology, fuel consumption and the consumption in Libya [9].
Table 1. Annual fuel consumption in the electrical generation plants (m3/year).
| Natural Gas | Heavy fuel oil | Light fuel oil |
|---|---|---|
| 6,013,482,065 | 805,472 | 2,388,932 |
Table 2. The emission factor for many types of fossil fuel and natural gas for electric utility (unit mass emission/m3 fired fuel) [7].
| i | Air emission | j=1 | j=2 | j=3 |
|---|---|---|---|---|
| Natural gas (gram/m3) |
Heavy Fuel Oil Electric Utility (kg/m3) | Light Fuel Oil Electric Utilities (kg/m3) | ||
| 1 | CO2 | 1,900.46 | 3,155.24 | 2,752.25 |
| 2 | CH4 | 0.49 | 0.034 | 0.18 |
| 3 | N2O | 0.049 | 0.064 | 0.031 |
| 4 | PM | 0.04 | 0.905a | 0.24 |
| 5 | SO2 | 0.0096 | 7.98b | 34.6 |
| 6 | NO2 | 2.24 | 6.6 | 2.40 |
| 7 | VOC | 0.044 | 0.034 | 0.024 |
| 8 | CO | 0.56 | 0.6 | 0.6 |
Note: (a) Heavy Oil, Particles Kg/m3=1.25s + 0.38, (b) Heavy Oil, Sulfur dioxide (Kg/m3=19s). S is the sulfur content of the fuel expressed as a percent (%) by mass, the Libyan Oil contains 0.420% [8]
Accordingly, one can calculate the emissions (ton/year) from equation (4). The results are tabulated in Table 3.
Table 3. Annual pollutants emitted from the electricity generation industry corresponding to the fired fuel in (tons/year).
| i | Air emission | j=1 | j=2 | j=3 | |
|---|---|---|---|---|---|
| Natural gas | Heavy Fuel Oil | Light Fuel Oil | Total(ton/year) | ||
| 1 | CO2 | 1.1428E07 | 2.5415E06 | 6.5749E06 | 2.054440E07 |
| 2 | CH4 | 2.9466E03 | 2.7386E01 | 4.3001E02 | 3.403996E03 |
| 3 | N2O | 2.9466E02 | 5.155E01 | 7.4057E01 | 4.202670E02 |
| 4 | PM | 2.4054E02 | 7.2895E02 | 5.7334E02 | 1.542830E03 |
| 5 | SO2 | 5.7729E00 | 6.4277E03 | 8.2657E04 | 8.909047E04 |
| 6 | NO2 | 1.347E04 | 5.3161E03 | 5.7334E03 | 2.451950E04 |
| 7 | VOC | 2.6459E02 | 2.7386E01 | 5.7334E01 | 3.493100E02 |
| 8 | CO | 3.6081E03 | 4.8328E02 | 1.4334E03 | 5.524780E03 |
| Total emissions | 2.0669251E07 | ||||
| Total equivalent CO2e | 2.0755E07 | ||||
 (4)
(4)
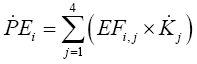
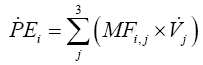
Where  EI is the mass rate emission of type i of pollutant (unit mass per unit time); EFi, is the emission factor emission of
pollutant i for the fuel type j (unit mass of pollutant per unit mass or volume of fuel); Vj is the flow rate of the fuel type j (unit mass
or volume per unit time) and n is the number of types of combustion fuel.
EI is the mass rate emission of type i of pollutant (unit mass per unit time); EFi, is the emission factor emission of
pollutant i for the fuel type j (unit mass of pollutant per unit mass or volume of fuel); Vj is the flow rate of the fuel type j (unit mass
or volume per unit time) and n is the number of types of combustion fuel.
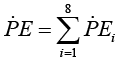
The total air emissions are calculated as:
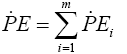 (5)
(5)
Where,  is the total air emissions for n number of pollutants (unit mass per unit time) and m is the number of pollutants
that are under consideration. The equivalent dioxide carbon eCO2 is calculated according to the following equation [10].
is the total air emissions for n number of pollutants (unit mass per unit time) and m is the number of pollutants
that are under consideration. The equivalent dioxide carbon eCO2 is calculated according to the following equation [10].
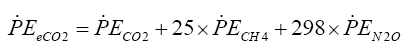 (6)
(6)
Cement industry
Cement is indispensable for building and construction work and cement industry is considered to be an important infrastructure core industry. It is one of the most advanced industries of Libya. Libya at the present time has eight factories for cement production with total productivity 7.5 million ton per year. The cement industry can play a significant role in the overall economic growth. As with many other industries, greenhouse gases are produced directly from the burning of fossil fuel sand indirectly from the generation of electricity used. In addition, the cement production process itself releases carbon dioxide when the calcium carbonate in limestone is converted to calcium oxide during the production of clinker in the kiln. As this chemical reaction is an essential step in the cement production process, cement manufacture emits relatively greater volumes of greenhouse gases than other industrial processes. The manufacture of cement involves heating these materials to high temperatures (typically 1400 -1500°C) for long periods to produce clinker, which is then ground with gypsum to produce cement. Cement manufacturing is a capital intensive and energy intensive process, relying on heavy fuel oil and gas as primary sources of thermal energy. Generally, NOX emissions are generated during fuel combustion by oxidation of chemically-bound nitrogen in the fuel and by thermal fixation of nitrogen in the combustion air. The amount of thermally generated NOx increases as flame temperature increases. Emissions of SO2 are generated from sulfur compounds in the raw materials and, to a lesser extent, from sulfur in the fuel. Okasha et al. had conducted an extensive study regarding the air emissions from cement factories in the north- west Libya and reported their investigation by Okasha A [11]. Unfortunately, many other cement manufactories, especially in eastern side left unstudied. The results of these manufactories was performed by analogy between those of fuel type of the studied factories. Accordingly, the air pollutants in ton per year has been calculated and tabulated in Table 4.
Table 4. List of the cement manufactories, productivity (M ton/year) and the amount of air emission (ton/year).
| Cement plant | Productivity Mton/year | Fuel type | Air pollutants ton/year | |||
|---|---|---|---|---|---|---|
| NOX | SO2 | CO2 | Dust | |||
| Lebda[11] | 1 | N.G | 1,495.8 | 827.52 | 752,796 | 71,535 |
| Mergheb[10] | 0.3 | N.G | 698.8 | 210.94 | 701,730 | 9,814 |
| Zleten[12] | 1 | N.G | 1,347.4 | 230.52 | 785,420 | 40,163 |
| Souk alkhamies | 1 | N.G | 1,036 | 279.2 | 752,796 | 34,200 |
| Alhouary | 1 | H.F.O | 913 | 80.1 | 793,409 | 34,200 |
| Benghazi | 0.8 | H.F.O | 730 | 64.1 | 634,728 | 27,360 |
| Alfataeh | 1 | H.F.O | 913 | 80.1 | 793,409 | 34,200 |
| Alborj[12] | 1.4 | H.F.O | 1,332.4 | 112.2 | 1,158,900 | 10.395* |
| Total | 7.5 | 8,466.4 | 1,884.68 | 6,373,188 | 251,482.4 | |
| Total emissions (ton/year) | 6,635,000 | |||||
| Total emissions of CO2e (ton/year) | 6,373,188 | |||||
Note: *There are electrostatic precipitator and filters
Agriculture and livestock sector
Libya is deeply dependent on imports for domestic food demand. Climatic conditions and poor soils limit farm domestic food production. Domestic conditions limit output, while income and population growth have increased food consumption. Compared to its North African neighbours, the agriculture sector contribution to the country’s Gross Domestic Product (GDP) in Libya is a lot lower and has been declining ever since oil discovery in 1958, the situation gets worst as the county plunged into civil war since 2011 the agriculture productions declined by -6.7% with GDP=1.9 in 2016 [12].The contribution of the sector in the GDP is less and less important. The agriculture sector is quite difficult to analyze and no data on energy consumption is available. Many information and surveys are needed to identify the air emission from this sector In contrast, for livestock it is less complicated so that they can inventory types and counting the animals in the country as well as the emission factors of every kind, therefore the emissions can be estimated from the livestock. The main sources of emissions are: feed production and processing (45% of the total), outputs of GHG during digestion by cows (39%) and manure decomposition (10%). The remainder is attributable to the processing and transportation of animal products. To arrive at its estimates, FAO conducted a detailed analysis of GHG emissions at multiple stages of various livestock supply chains, including the production and transport of animal feed, on-farm energy use, emissions from animal digestion and manure decay, as well as post-slaughter transport, refrigeration and packaging of animal products (Table 5). About 44% of livestock emissions are in the form of methane (CH4). The remaining part is almost equally shared between Nitrous Dioxide (N2O, 29%) and Carbon Dioxide (CO2, 27%) [13,14]. The emission factors have been taken from and the number of livestock in Libya from [15,16].
Table 5. Methane CH4, nitrous oxide N2O, carbon dioxide CO2 and equivalent CO2e emissions from domestic livestock fermentation.
| i | Animals type | j=1 | j=2 | j=3 | j=4 | j=5 | Total |
|---|---|---|---|---|---|---|---|
| Sheep | Goats | Camels | Cattle | Horses&donkeys | |||
| Number of animals (hoof) | 3,987,651 | 1,080,420 | 109,397 | 102,506 | 11,399 | 5,291,373 | |
| 1 | Emissions CO2(ton/year) | 5,916 | 1,605 | 1,494 | 1,401 | 63 | 10,479 |
| 2 | Emission CH4 (ton/year) | 9,641 | 2,613 | 2,434 | 25,652 | 100 | 40,430 |
| 3 | Emission N2O (ton/year) | 6,355 | 1,722 | 1,604 | 1,503 | 66 | 11,250 |
| Total emissions (ton/year) | 62,159 | ||||||
| Total emissions of CO2e (ton/year) | 4,373,800 | ||||||
The emissions (ton/year) has been calculated using equation (7). The results are tabulated in Table 4.
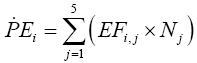 (7)
(7)
Where,  Ei: is the mass rate emission of type i of pollutant (unit mass per unit time); EFij : is the emission factor for type i
of pollutant for animals type j (unit mass of pollutant per unit time per hoof); Nj : is the number of animals of type j (hoof) the total
air emissions.
Ei: is the mass rate emission of type i of pollutant (unit mass per unit time); EFij : is the emission factor for type i
of pollutant for animals type j (unit mass of pollutant per unit time per hoof); Nj : is the number of animals of type j (hoof) the total
air emissions.
Solid waste generation
Classifications of solid wastes are proposed here according to the origin wastes: municipal solid waste (MSW), industrial solid waste (ISW) and healthcare solid waste (HSW). According to The weight of garbage resulting from the people in Lybia is ranging between 0.35-2.00 kg/day with average of 0.78 kg of waste per capita daily; however, waste production rates and composition vary widely depending on the region [17]. Accordingly, the amount of waste from all Libya householders 1,894,200tons/year, these wastes contain from: organic matter represents 59% of waste, followed by paper–cardboard 12%, plastic 8%, miscellaneous 8%, metals 7%, glass 4% and wood 2%. The overall generation of ISW, including non-hazardous wastes, industrial wastes, demolition and construction, is 1,248,000 tons/year. The hazardous waste generated is 106,200 tons/ year; HSW reaches 87,000 tons/ year. The quantity of MSW generated in Libya is estimated at 3.3354 million tons/year, this quantity is quite biger than what Tarek et al. provided in which was 3.2 Mton/year [18]. The increase in solid waste production has been attributed to the population growth, the expansion of trade and the increased number of industries in Libya. Elimination is the solution applied to 97% of waste produced in Libya. These wastes are either thrown in to open dumps (67%) or burned in the open air in either public dumps or municipal, uncontrolled dump (30%) [19]. Quantities destined for recovery are quite low: only 1% for recycling and 2% for composting [20]. According to author’s observation and in the absence of the municipal purgation workers and the Ministry of environment, 100% of waste is burned in the uncontrolled dumps and in some times in urban zones causing black dark cloud over the zone and unbearable smells, for this reason, we have adopted a value of 70% for the burned waste. Wiedinmyer and etc. in provided a long list of the emission factors of pollutants emitted from the burning of waste, the list contained GHGs, reactive trace gases, particulate matter and toxic compounds [21]. The IPCC suggests only 60% of the total waste available to be burned (70% of MSW generated) that is actually burned. So the mass of air pollutants will be the yield of the product of the emission factor by the MSW by 60% by 70%. The results were tabulated in Table 6.
Table 6. Emission factors (kg /ton waste burned) for species emitted from the burning of waste.
| i | Compound | Emission factor kg /ton wasteburned | Air pollutants ton/year |
|---|---|---|---|
| 1 | Carbon dioxide (CO2) | 1,453 | 2,035,500 |
| 2 | Methane (CH4) | 3.7 | 5,183.2 |
| 3 | Carbon monoxide (CO) | 38 | 53,233 |
| 4 | Sulfur dioxide (SO2) | 0.5 | 700.43 |
| 5 | Nitrogen oxides (NOX) | 3.74 | 5,233.3 |
| 6 | PM2.5 | 9.8 | 13,729 |
| 7 | PM10 | 11.9 | 16,670 |
| Total emissions (ton/year) | 2,130,200 | ||
| Total emissions of CO2e (ton/year) | 2,165,100 | ||
The emissions (ton/year) has been calculated using equation (8). The results are tabulated in Table 6.
 (8)
(8)
Where:  Ei: is the rate of the type i of pollutant (unit mass per unit time); EFi: is the emission factor for type i of pollutant
(unit mass of pollutant per unit mass of burned waste); and
Ei: is the rate of the type i of pollutant (unit mass per unit time); EFi: is the emission factor for type i of pollutant
(unit mass of pollutant per unit mass of burned waste); and  : is the mass rate of the waste (unit mass per unit time).
Transportation
Libya is an extensive and wide spaced country the population is distributed along and cross this vast extension. There are about 83,200 km of roads in Libya, 47,590 km of which are surfaced [22]. Lack of efficient public transport system in most of cities and growing travel demands has fueled the growth of private vehicles in the country and correspondingly, increased the air pollution and is also blamed for contributing of climate change and global warming. The number of motor vehicles rose from 465,000 vehicles in 1983 to 2,680,000 in 2014. Where 2,500,000 vehicles are gasoline-fueled passenger cars and 180,000 are diesel-fueled trucks. Passenger vehicles are defined as 2-axle 4-tire vehicles, including passenger cars, vans, pickup trucks and sport/utility vehicles. The calculations for Total Annual Pollution Emitted and Fuel Consumed are based on average annual passenger car kilometers travelled of 19,000 km per year and an average annual light-medium truck kilometers of 24,000 km. In 2015 and according to (FHWA 2017), fuel consumption is based on fleet wide average in-use fuel economy of 10.25 km per liter for passenger cars and 7.355kmper liter for light trucks [23]. According to Libya has eight registered air carrier companies with 23 aircrafts, carrying 2,566,465 passengers per year around the country and cross the word wide, travelling a distance of 3,833,542,000 km pear year. And there are 146 airports serve the country, 68 airports with paved runways and the rest are unpaved. Also Libya has a modest fleet of merchant marine consists of: 8 cargos, 4 chemical tankers, 3 liquefied gas tanker, 7 petroleum tankers, 4 passengers and one roll on/roll off. The emission factors are tabulated for many types of vehicles, trucks, aircrafts and waterborne crafts in [24-26]. As it’s indicating in Table 7 the unit of the emission factors are gram pollutant per km driven or travelled, so the annual air emissions will be the product of the emission factor by the annual kilometers driven by vehicle by the number of vehicles and the annual fuel consumption will be the product of the fuel consumption rates in liter per km driven by the annual kilometers driven by vehicle by the number of vehicles. The obtained results are tabulated in Table 7.
Table 7. Estimated emission and fuel consumption factors for gasoline-fueled passenger cars, diesel-fueled trucks, aircrafts and waterborne craft.
| i | Pollutant/fuel | Fuel Consumption Rates (litre per km driven) | Annual Emission per year | |||
|---|---|---|---|---|---|---|
| j=1 | j=2 | j=3 | j=4 | |||
| Gasoline fuelled Passenger cars | Diesel-fuelledtrucks | Aircraft | WaterborneCraft* | |||
| 1 | CO2 | 229 | 1,312.90 | 442.6 | 676 | 1.82E+07 |
| 2 | CH4 | 0.04 | 0.003169 | 0.014645 | 0.0025 | 1.97E+03 |
| 3 | N2O | 0.091 | 0.0029826 | 0.014001 | 0.01678 | 4.39E+03 |
| 4 | CO | 6.2 | 8.463 | n/a† | 7.92 | 3.31E+05 |
| 5 | NOX | 0.52 | 6.8052 | n/a | 3.024 | 5.41E+04 |
| 6 | VOC | 0.67 | 0.13089 | n/a | 0.3384 | 3.24E+04 |
| 7 | PM | 0.0053 | 0.13102 | n/a | n/a | 8.18E+02 |
| 8 | SO2 | 0.01004 | 0.39307 | n/a | n/a | 2.18E+03 |
| Fuel cons. (l/km) | 0.0976 | 0.13597 | 0.068212 | 0.14113 | ||
| Annual fuel cons. (l/year) | 4.636E+06 | 588.0 E+06 | 262.0 E+06 | n/a | ||
| Total emissions (ton/year) | 1.8732 E+07 | |||||
| Total emissions of CO2e (ton/year) | 1.9603 E+07 | |||||
 (9)
(9)
Where,  Ei: is the mass rate emission of type i of pollutant (unit mass per unit time); EFij: is the emission
factor emission of pollutant i for the transportation type j (unit mass of pollutant per km driven or travelled); and
Ei: is the mass rate emission of type i of pollutant (unit mass per unit time); EFij: is the emission
factor emission of pollutant i for the transportation type j (unit mass of pollutant per km driven or travelled); and  is the annual kilometers driven or travelled by transportation type i (unit length per unit time) and the total air emissions
  E is:
E is:
 (10)
(10)
Crude oil refinery industry
According to EIA and Citac, Libya has five domestic refineries, with a combined name plate capacity of approximately 380,000 bbl/d (51,351 ton/day), significantly higher than the volume of domestic oil consumption (227,000 bbl/d; the rest is exported). Libya's refineries include:
• Ras Lanuf export refinery, completed in 1984 and located on the Gulf of Sirte, with a crude oil refining capacity of 220,000 bbl/d.
• Az Zawiya refinery, completed in 1974 and located in north-western Libya, with crude processing capacity of 120,000 bbl/d.
• Tobruk refinery, with crude capacity of 20,000 bbl/d.
• Brega, the oldest refinery in Libya, located near Tobruk with crude capacity of 10,000 bbl/d.
• Sarir, a topping facility with 10,000 bbl/d of capacity.
The plants are unsophisticated and consume a lot of energy. They are not capable of producing products that correspond to the specifications required by the consuming countries such as unleaded petrol, reformulated gasoline and low Sulphur gas oil (Figure 4). The refineries suffered very badly from the technological and equipment limitations imposed by sanctions. Refineries are a potential source of atmospheric emissions of carbon dioxide (CO2), carbon monoxide (CO), methane (CH4), Volatile Organic Compounds (VOCs) including hazardous substances such as benzene and 1,3-butadiene, Sulphur, reduced Sulphur compounds and oxides of Sulphur, ammonia, oxides of nitrogen, toxic organic micro pollutants (dioxins, PAHs), heavy metals, particulates and odour [27].

Figure 4: Libyan map indicating the oil activities.
The most significant air emissions sources in oil refineries are catalytic or thermal cracking units, catalytic reformer units, sulfur recovery plants, storage vessels, fluid coking units wastewater streams, cooling towers, equipment leaks, blow down systems, vacuum distillation units, steam boilers, process furnaces, process heaters, compressor engines, barge or ship loading and gasoline loading racks specifically located at petroleum refineries (Table 8). It identifies the air pollutants from these air emissions sources and summarizes US EPA publication AP-42 estimates of the uncontrolled emissions from these oil refinery air emissions sources.
Table 8. Emission factors and the air emissions from crude oil refinery industry.
| Pollutants | Emission factor kg/1,000 bbl crude oil | Emissions ton/year |
|---|---|---|
| Carbon dioxide | 8,057 | 1,117,400 |
| Methane | 15.59 | 2,163 |
| Nitrous oxide | 0.2543 | 35.3 |
| Particulates | 347 | 48,129 |
| Carbon Monoxide | 6215 | 862,020 |
| Sulfur Dioxide | 224 | 31,069 |
| Nitrogen Oxides | 33 | 4,577 |
| Hydrocarbons | 398 | 55,203 |
| Aldehydes | 8.7 | 1,207 |
| Ammonia | 24.5 | 3,398 |
| Inorganic Chlorine | 4,450 | 617,220 |
| VOC | 2.12 | 294 |
| Total emissions (ton/year) | 2,742,715 | |
| Total emissions of CO2e (ton/year) | 1,182,000 | |
Petrochemical industry
Natural gas and crude distillates such as naphtha (from petroleum refining) are used as feedstock to manufacture a wide variety of petrochemicals which are in turn used for the manufacture of a variety of consumer goods. The basic petrochemicals manufactured by cracking, reforming and other processes include olefins (including ethylene, propylene, butylenes and butadiene) and aromatics (including benzene, toluene and xyleme). Libya has a total of eight petrochemical manufacturing facilities [28]. Marsa El-Brega: It came on stream in 1978 and produces primarily methanol and fertilizers and consists of: Two methanol units that produce 720,000 tons per year (tpy), two urea units with a total capacity of 900,000 (tpy) and two ammonia units with a capacity of 700,000 tpy [29]. Ras Lanouf: Located on the Mediterranean Coast and operated by the Libyan National Oil Corporation (NOC) is Libya's biggest. It came on stream in 1987. It produces petrochemicals utilizing naphtha as a feed stock to an ethylene plant with a capacity of 12,450kiloton per year (ktpy). Its main products are ethylene (330 ktpy), high density polyethylene (HDPE) (80 ktpy), linear low density polyethylene (LLDPE) (80 ktpy), polypropylene (170 ktpy) and butadiene (585 ktpy) [30]. Abu Kammash: It came on stream in the 1970. Abu Kammash complex produces polyvinyl chloride (PVC) (104 ktpy), vinyl chloride monomer (VCM) (60 ktpy), vinyl chloride (60 ktpy), sodium hydroxide (50 ktpy) and chloral (45 ktpy). A large portion of its output is exported [31]. Unfortunately, there is no any information regarding to the air pollutions is available.
Iron and steel industry
Steel will remain the basis for economic development in the world. It is used to produce everything from sewing needles and tools to automobiles, ships and planes. The main types of plants involved in iron and steel industry are sintering plants, blast furnaces and steel works, direct reduction plants, ferroalloy production, rolling, scarfing, pickling, iron and steel foundry and other technologies, such as argon-oxygen decarburization, ladle metallurgy vacuum degassing. Coking plants are considered here as part of this sector, since coke is produced practically exclusively for the iron and steel industry. The iron and steel industry causes significant effects on environmental media: air-emissions of SO2, NOX, CO, H2S, PM, lead, Ni, As, Cd, Cr, Cu, Zn, Se, Hg, PM, etc.; water-process water with organic matter, oil, metals, suspended solids, benzene, phenol, acids, sulfides, sulfates, ammonia, cyanides, thiocyanates, thiosulfates, fluorides(scrubber effluent); soil-slag, sludge, sulfur compounds, heavy metals, oil and grease residues, salts [32].
The Libyan Iron and Steel Company (LISCO) is one of the largest companies in North Africa with an annual design capacity of 1,324,000 tonnes of liquid steel adopting direct reduction/electric arc furnace method utilizing natural gas as reductant of high quality pellets to produce sponge iron and hot briquetted iron. LISCO is located near the coastal city of Misurata, (About 210 km East of Tripoli). LISCO Plants consists of a direct reduction plant, two steel melt shops, a three-line bar and rod mill, a light and medium section mill, a hot strip mill and a cold strip mill with a galvanizing line and a coating line. The calcining plant is designed to produce 66,000 tons annually of burnt lime and 22,750 tons annually of dolomite. The plant contains two vertical furnaces for producing burnt lime, one rotary kiln to produce burnt dolomite (Table 9). If we know that to produce one ton of iron products, we need to burn about 460 cubic meters of natural gas, about 59 kg of oil and about 1400 kWh, as consumption of electricity [33].
Table 9. Emission factors and the air emissions from iron and steel industry.
| Pollutants | Emission factor kg/ton iron | Emissioston/year |
|---|---|---|
| Carbon dioxide | 1,069.8 | 1,390,800 |
| Particulates | 0.868 | 1,128.4 |
| Carbon Monoxide | 3.7811 | 4,915.4 |
| Sulfur Dioxide | 3.5285 | 4,587 |
| Nitrogen Oxides | 6.2811 | 8,165.4 |
| Total emissions (ton/year) | 1,409,596 | |
| Total emissions of CO2e (ton/year) | 1,390,800 | |
Industries
The industrial sector is one of the most dynamic sectors of the economy and plays an essential role in economic development. The Libyan government privatized the small industrial sector early in the beginning of 1990s, consequently, measurement execution is not possible. Regardless most of private industrial activities are registered in the Libyan Industry Union, but there is no sufficient information about the activities of these factories, indeed some of them are manufacturing factories and most of them are just packing factories. For this reason, we recommended at the end of this work, all the private industrial activities have to submit an environmental report at the end of the year, including energy consumption, amount of emissions whether gas, liquid or solid. This report should be evaluated by a specialized committee, similar to the financial report that provides taxes periodically. Therefore, we have applied the carbon pricing or taxes to every product based on internationally standard environmental restrictions. However, heat is required in most industrial processes. The sources of gas emissions issued by the chimneys factory are caused by burning fossil-fuel in factories. In small factories, electricity can be used as a source of the thermal energy. However, in large factories, fossil- fuel or natural gas are burned in ovens, burners or boilers to provide the thermal energy to the plant. However, unfortunately there are no information about the number of factories, their activities and how to provide them for thermal energy. According to what stated in the bulletin of the Libyan Industry Union, there are two factories for soap and powder detergent manufacturing. ALKALA located in Tripoli with an annual capacity of 18,000 tonnes, ALNIER located in Misturata with an annual capacity of 9,200 tonnes. Using the manufacturing data provided by Ali Af, and we get the emission factors for the soap industry [34]. Introducing the emission factor for soap industry and the amount of air emissions from these two factories in Table 10.
Table 10. Emission factors and the air emissions from soap and powder detergent manufacturing.
| i | Pollutants | Emission factor kg/ ton production | Emissions ton/year |
|---|---|---|---|
| 1 | CO2 | 138.14 | 3,757.4 |
| 2 | CO | 0.013503 | 0.36728 |
| 3 | SO2 | 0.040809 | 1.110 |
| 4 | NO2 | 0.38497 | 10.471 |
| 5 | H2S | 0.010587 | 0.28797 |
| Total emissions (ton/year) | 3,770 | ||
| Total emissions of CO2e (ton/year) | 3,757.4 | ||
Residential and commercial sector
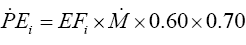
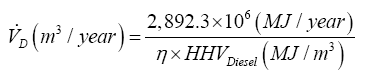
During the last 7 years (2011-2017), the residential sector became a source of pollution, especially after the inability of the General Electrical Company of Libya (GECL) to provide the people a sustainable electrical energy, so it led to massive use of mobile electricity generators to meet their deficit need of electricity, in addition to the use of natural gas in the food-cooking. Due to the abnormal circumstances of (2011-2017), GECOL faced a shortage in the energy production process, which led to 1200 MW load shedding (20% of total peak load) for 33 days electricity cut-off in the year 2015 (792 hr/year). In the absence of sufficient information about the number of generators that are operating in the time of electrical power cut-off, however, the house holders prefer to buy generators running on diesel, while the owners of shops prefer gasoline-fueled generators! The efficiency of these generators is about 60%.
In Figure 3 the residential sector consumes 36% of the total energy generated, assuming that 50% fraction of the house load will be provided by a generator and about 70% of the house holders have generators, so about 1,014.4 MW (2,892.3 TJ/year) will be generated by diesel-fueled generators. And 14% of the base load will be carried over by Gasoline generators also with 50% fraction load cover, it means that 563.57 MW (1,606.9 TJ/year) will be covered by gasoline generators [35].
The annual fuel consumption (m3/year) of the gasoline  and diesel
  fuel are calculated from the following equations: (11).
 (11)
(11)
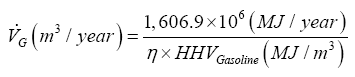
Where  and
and  are the annual fuel consumption for diesel and gasoline generators respectively,
  is the efficiency of the
generator, HHV is the higher heating or calorific value of the fuel. The other source of domestic pollutants is liquefied petroleum
gas (LPG which used for cooking purposes, Libya consumes about 2.7336 million tonnes of gas per year, which equivalent to
5.3843 million m3 per year [36]. The emission factors for gasoline, diesel fuels and LPG are documented in [37,38] and tabulated in Table 11. The total emissions by the residential and commercial sector will be found from equation (12) and the results tabulated
in Table 11.
is the efficiency of the
generator, HHV is the higher heating or calorific value of the fuel. The other source of domestic pollutants is liquefied petroleum
gas (LPG which used for cooking purposes, Libya consumes about 2.7336 million tonnes of gas per year, which equivalent to
5.3843 million m3 per year [36]. The emission factors for gasoline, diesel fuels and LPG are documented in [37,38] and tabulated in Table 11. The total emissions by the residential and commercial sector will be found from equation (12) and the results tabulated
in Table 11.
 (12)
(12)
Table 11. The emission factor for gasoline and diesel-fueled electricity generators.
| i | Pollutants | Emission factors(kg/m3fuel or gas) | Emission via generators (ton/year) | Emissions via LPG (ton/year) | Total emissions (ton/year) | ||
|---|---|---|---|---|---|---|---|
| j=1 | j=2 | j=3 | |||||
| Gasoline | Diesel | LPG | |||||
| 1 | CO2 | 2322.1 | 2689.63 | 1,500 | 5.1625E05 | 8.0765E06 | 8,592,750 |
| 2 | CH4 | 0.1004 | 0.133 | 0.024 | 24.386 | 129.22 | 154 |
| 3 | N2O | 0.02114 | 0.4 | 0.108 | 51.102 | 581.50 | 633 |
| 4 | PM | 0.1623 | 0.9628 | 0.084 | 131.830 | 452.28 | 584 |
| 5 | SO2 | 0.10286 | 2.8884 | 0.005 | 365.070 | 26.922 | 392 |
| 6 | NO2 | 1.628 | 12.516 | 1.56 | 1,675.50 | 8,399.5 | 10,075 |
| 7 | VOC | 38.628 | 0.9628 | 0.12 | 3,178.1 | 646.12 | 3,824 |
| 8 | CO | 223.18 | 7.7024 | 0.9 | 18,626 | 4,845.9 | 23,472 |
| fuel cons. m3/year | 79,194 | 123,570 | 5,384,300 | ||||
| Total emissions (ton/year) | 8,631,883 | ||||||
| Total emissions of CO2e (ton/year) | 8,785,106 | ||||||
Note: Gasoline HHV=33,818 MJ/m3, Diesel HHV=39,010 MJ/m3 and LPG (propane) HHV=101 MJ/m3 Gasoline HHV=44.8MJ/kg, LHV=42.9 MJ/ kg, Diesel HHV=47.3 MJ/kg, LHV=43.0 MJ/kg and LPG (propane) HHV=50,350 kJ/kg , Gasoline density=740 kg/m3, Diesel density=830 kg/m3 and LPG density=507.7 kg/m3
The obtained results are presented statistically and plotted by bar and pie charts in Figures 5-14 showing the amount of pollutants emitted from each sector and also the share of each sector of total pollutants. It is evident from Figure 5 that, the electrical power industry emits 20.55 million tonnes annually, which presents 35.3% of the total CO2 emissions in the country. Followed by the transportation sector with 19.6 million tonnes per year, which presents about 31.3% of the total CO2 emissions. The residential sector comes in third place with 8.8 million tonnes per year which is equivalents to 14.8% of the total CO2 emissions. With the same rates of participation for almost all sectors in GHG gases, which are graphically represented by CO2e, as it appears from Figure 6. While the oil refining sector accounted for 67.3% of the total CO emissions, followed by the transportation sector with 25.9% and all other sectors contributing 6.8%, as it’s presented in Figure 7. However, the situation was different for NOX emissions, the transportation sector topped the list with share of47% followed by electricity sector with 21.3% the residential sector share was 8.8% and the rest of the sectors contributed with 23%, as it’s indicated in Figure 8. It refer to the increasing share of the livestock in the emissions of CH4 and N2O gases, where the emissions exceeded the annual amount of 40 and 11 thousands of tonnes respectively Figures 9 and 10. It is known that the green house effects of CH4 and N2O are 25 and 298 times than CO2. Therefore, this quantity can't be underestimated, for this reason, its effect is significant in total CO2e, where the contribution of livestock was approximately 7% of the total GHG emissions, as it evidentially from Figure 6. Figure 11 presents the amounts Particulate Matters (PM) in tonnes per year that are emitted by sectors and the share of each sector in total PM emission. The cement industry topped the list with 252 thousand tonnes per year which present about 83% of the total PM emitted. Although the use of filters and electrostatic precipitators is very efficiently to capture most of these PM-as it’s evident from Table 4. But, unfortunately, it is not used in most factories. Figure 12 presented the amount of Volatile Organic Compound (VOC). As it’s expected, those sectors that used Gasoline as a fired fuel were on top of the list, these sectors are the transportation and residential & commercial sectors, by using the gasoline fuelled passenger cars and the gasoline fuelled electricity generators, are responsibility of about 88% and 11% respectively of total VOC emissions. In the end two are also created, these are: the total pollutants emitted from all sectors presented in Figure 13. Of course the largest share was for CO2 with 58 million tonnes per year which is a 96% of the total emissions in the country [39]. Also the contribution of each sector in the air emissions (ton/year) and the arrow of each sector in percentage are presented in Figure 14.

Figure 5: The annual CO2 (ton/year) emitted by sectors and the share of each sector in total CO2 emission.

Figure 6: The annual GHGs (ton/year) emitted by sectors and the share of each sector in total GHGs emissions.

Figure 7: The annual CO (ton/year) emitted by sectors and the share of each sector in total CO emission.

Figure 8: The annual NOX (ton/year) emitted by sectors and the share of each sector in total NOX emission.

Figure 9: The annual CH4 (ton/year) emitted by sectors and the share of each sector in total CH4 emission.

Figure 10: The annual N2O (ton/year) emitted by sectors and the share of each sector in total N2O emission.

Figure 11: The annual PM (ton/year) emitted by sectors and the share of each sector in total PM emission.

Figure 12: The annual VOC (ton/year) emitted by sectors and the share of each sector in total VOC.

Figure 13: The annual pollutants (ton/year) emitted by all sectors and the percentage of contribution of each pollutant in the total emissions.

Figure 14: The contribution of each sector in the air emissions (ton/year) and the arrow of each sector in percentage.
The pollutants released from the air emissions sources in Libya has been estimated according to field measurements in some sectors and from published or unpublished reports for other activities and unfortunately some industrial activities are left without evaluation due to the lack of necessary data for the environmental evaluation process. The study reveals that most factories can't quantify the toxic gases emissions because there are no measuring and controlling devices in their industrial units. Libya ranks 53 from 225 in the list of countries by emissions of carbon dioxide with contribution of up to 0.22% and ranks 41 from 225 in the list of countries by emissions of carbon dioxide per capita. The annual total air emissions are around 61.1 million tonnes. The largest share was for carbon dioxide CO2 (96.76%), followed by carbon monoxide CO (2.13%), then particulate matters PM (0.55%), then sulfuric dioxide SO2 (0.21%), nitrogen oxides NOX (0.18%), then methane gas CH4 (0.089%), voltaic organism component VOC (0.061%) and in the last position was nitrous oxide N2O with (0.028%). The annual total equivalent carbon dioxide is around 64.6 million tonnes CO2e, which represents about 9.7 ton/year/capita. The main uncertainty results from the incomplete available data. It is mainly due to a lack of information provided by private industrial establishment. Conflict of information even when the same researcher, which reduces the confidence of some information. Therefore, the environment in Libya requires a more thoughtful and comprehensive policy of planning, awareness and conservation. In general, these environmental problems have multiplied, causing socio-economic problems and increasing health hazards. Observing the situation of air pollution in Libya will lead to the conclusion that many factors needed to solve this problem are absent. For instance, there is no comprehensive national plan to tackle various environmental problems, including air pollution problems; no control against exceeding the permitted levels of pollutants, even from ministry of electricity or the environmental authority; no observation or testing centres responsible for licensing vehicles; no measuring station for air pollution in urban areas and city centres; no follow- up for open air burning garbage and waste; an absence of specialized teams in air pollution; and a scarcity of specialists, leading to a scarcity of studies and real facts about air pollution.
The alarm bells are ringing, alerting us to the danger of air pollution. We should start addressing this problem immediately by activating environmental authorities to create a comprehensive plan to study air pollution problems and their solutions.
Authors suggest these recommendations in this context:
• Increasing awareness and educational programs in the area of energy conservation, environment protection and health risks resulting from environmental pollution, at all levels of education and in all means of social communication.
• Non-profit societies and associations could combine their efforts to solve this problem by establishing teams to help with environmental awareness and encouraging people to use environmentally friendly equipment and transportation, reactivate public buses or other mass transit. Set up a large indicator sets covering most sustainable development issues and providing detailed insights.
• Improve data collection from the surveys include information on monetary expenditures and physical quantities, including fuels and electricity, as well as information of other socio-economic, demographic and infrastructural data.
• The private industrial activities have to submit an environmental report at the end of the year, including energy consumption, amount of emissions whether gas, liquid or solid. This report should be evaluated by a specialized committee, similar to the financial report that provides taxes periodically. Therefore, we can apply the carbon pricing or taxes to every product based on internationally standard environmental restrictions.
• Reactivate and give the power to the censor division in the environmental authority to conduct its work regulatory on the environment.
• Encourage researches in the field of renewable energy resources and increase support to the research institutions in the area of clean energy and environmental issues.
For decision making purposes, less complex frameworks with small sets of a few lead indicators and recommendations.