Research & Reviews: Journal of Pharmaceutics and Nanotechnology
e-ISSN: 2347-7857 p-ISSN: 2347-7849
e-ISSN: 2347-7857 p-ISSN: 2347-7849
Ambareen Atisha1*, Mark Bernards2, Ernest K Yanful1, Wojciech Kujawski3
1Department of Civil and Environmental Engineering, Western University, London, ON, Canada
2Department of Biology, Western University, London, ON, Canada
3Department of Chemistry, Nicolaus Copernicus University, Torun, Poland
Received: 08-Mar-2023, Manuscript No. JPN-23-91137; Editor assigned: 10-Mar-2023, Pre QC No. JPN-23-91137 (PQ); Reviewed: 24-Mar-2023, QC No. JPN-23-91137; Revised: 08-May-2023, Manuscript No. JPN-23-91137 (R); Published: 15-May-2023, DOI: 10.4172/2347-7857.11.2.011
Citation: Atisha A, et al. Application of Tailored Nanofiltration Membranes for Removal of IBP, NPR and DCF from Wastewater Effluents. RRJ Pharm Nano. 2023;11:011.
Copyright: © 2023 Atisha A, et al. This is an open-access article distributed under the terms of the Creative Commons Attribution License, which permits unrestricted use, distribution and reproduction in any medium, provided the original author and source are credited.
Visit for more related articles at Research & Reviews: Journal of Pharmaceutics and Nanotechnology
This study concentrates on the identification and quantification of three pharmaceutical compounds (ibuprofen, naproxen and diclofenac) in wastewater effluents collected from Adelaide wastewater treatment plant and greenway pollution control plant, London, ON, Canada. For sample preparation, liquid-liquid extraction techniques along with derivatization were followed and GC-FID was used for sample analysis. The target pharmaceuticals were present in the wastewater samples at concentrations in a range of 0.29-8.98 μg/L. For eradicating or removing the above mentioned organic compounds from water, Nanofiltration (NF) membranes were used in this study. Different types of NF membranes were prepared following the technology of Organic Solvent Nanofiltration (OSNF) membranes where commercially available PTFE ultrafiltration membranes as well as laboratory made polysulfone ultrafiltration membranes served as the base supports, and poly (dimethylsiloxane) as the thin active layer. For membrane characterization, Scanning Electron Microscopy (SEM) and Atomic Force Microscopy (AFM) were performed. The performance of the membranes was studied by monitoring permeability along with the removal capacity using a dead end filtration system, under a pressure range of 5~30 bars. A commercially available polyimide membrane, DuraMem, was also exploited to compare the membrane performance. The 2.5% PTFE/PDMS (RTV 615) membranes showed the highest performance in the removal of ibuprofen, naproxen and diclofenac; Hansen’s solubility parameter approach was adopted to explain the removal mechanism of pharmaceutical compounds.
Wastewater effluent; Pharmaceutically active compounds; Organic solvent nanofiltration; PDMS; Polyimide
μD: Micro Debey; μg/L: Microgram per Liter; μm: Micrometer; AC: Activated Carbon; Ao: Angstrome; AOP: Advanced Oxidation Process; BPA: Bisphenol A; BSTFA: Trifluoroacetamide; CNT: Carbon Nanotube; DCF: Diclofenac; DCM: Dichloromethane; DI: Deionized water; GC-FID: Gas Chromatography-Flame Ionization Detecto; r GO: Graphene Oxide; H2O2: Hydrogen Peroxide; H2SO4: Sulfuric Acid; HNO3: Nitric Acid; IBP: Ibuprofen; IPA: Isopropyl alcohol; LLE: Liquid Liquid Extraction; MDL: Method Detection Limit; MF: Micro Filtration; mg/L: Milligram per Liter; MgSO4: Magnesium Sulfate; mm: millimeter; MPa: Mega Pascal; MPD: M-Phynylenediamine; MWCNT: Multiwalled Carbon Nanotube; NF: Nanofiltration; NF270: A commercial Nanofiltration membrane; NF-70: A commercial Nanofiltration membrane; NFPES: A commercial Nanofiltration membrane; ng/L: nanogram per Liter; nm: Nanometer; NPR: Naproxen; NSAIDs: Nonsteroidal Anti-inflammatory Drugs; OSNF: Organic Solvent Nanofiltration; PAN: Polyacrylonitrile; PDMS: Polydimethylsiloxane; PE: Polyester; PES: Polyethersulfone; PhACs: Pharmaceutically Active Compounds; PSF: Polysulfone; PTFE: A commercial ultrafiltration membrane; RO: Reverse Osmosis; RTV 615: A silicon kit; Si3N4: Silicon Nitride; Si-O: Siloxane; SYLGARD 184: A Silicon kit; UF: Ultra Filtration; UV: Ultraviolet; WWTP: Wastewater Treatment Plant.
The incidence of emerging or recently recognized pollutants in our water resources is of great concern to the health and safety of the consuming public. These contaminants are defined as low molecular weight, synthetic or naturally occurring compounds, not commonly monitored in the environment. Waste water effluents from municipal treatment plants, hospital effluents, industrial as well as livestock wastewater are common sources of trace contaminants in the environment; they are present usually in the µg/L range or less. Most trace contaminants are anthropogenic, created in extensive quantities for many purposes, for example, as pharmaceuticals, pesticides, refrigerants, dye carriers, propellants, pigments, dielectric fluids, preservatives, heat transfermedia, degreasers and lubricants. Pharmaceutical compounds along with their metabolites are publicly denoted as Pharmaceutically Active Compounds (PhACs). According to bush, the most commonly detected pharmaceuticals in water are anti-inflammatories and analgesics (acetylsalicylic acid, ibuprofen, diclofenac and paracetamol); antidepressants (benzodiazepines); antiepileptics (carbamazepine); lipid lowering drugs (fibrates); β-blockers (atenolol, metoprolol and propranolol); antiulcer drugs and antihistamines (famotidine and ranitidine); antibiotics (β-lactams, chloramphenicol, fluoroquinolones, imidazole derivatives macrolides, penicillin, quinolones, sulfonamides and tetracyclines); other substances (amphetamines, barbiturates, cocaine, methadone and other narcotics). Pharmaceuticals like cyclophosphamide, erythromycin, naproxen and sulfamethoxazole can persist in the environment for about one year whereas clofibric acid lingers on for several years, being biologically active through accretion. Most of the pharmaceutical compounds possess a molecular mass less than 500 Da; they are polar molecules with more than one ionization group and the degree of ionization and their characteristics are dependent on the pH of the medium. According to some researchers, it is currently not clear whether the presence of PhACs through exposure to multiple compounds at a very low levels could invoke an increased toxic or synergistic effects; however, it is validated that a mixture of pharmaceuticals at mg/L range can lead to physiological and morphological effects on human embryonic cells. Moreover, the catastrophic consequences on the population of vultures in India and Pakistan due to the use of the anti-inflammatory drug, diclofenac, has made the researchers to extend their studies and analysis regarding the effects of PhACs in aquatic environment. The target PhACs selected for this study are Ibuprofen (IBP), Naproxen (NPR) and Diclofenac (DCF). These are known as Nonsteroidal Anti-Inflammatory Drugs (NSAIDs) widely used over the world possessing analgesic and antipyretic activities [1].
As stated in recent research, some of the pharmaceuticals (e.g. β-blockers, analgesics, antacids, antibiotics, antidepressants, antipyretics, lipid lowering drugs, stimulants and tranquilizers) are not entirely removed by conventional Waste Water Treatment Plants (WWTPs) due to their complex molecular structure and/or low molecular weight and thus have been detected in surface and ground water of different regions of the world. According to Carballa, et al., although some pharmaceuticals can be removed in primary treatments by adsorption; ibuprofen, naproxen, sulfamethoxazole and iopromide remain in the water and subsequent biological treatment can eliminate only 30–70% of the anti-inflammatories. Heberer reported that WWTPs are not at all effective in removing diclofenac; at least five sub products are generated during chlorination of diclofenac and the degree of mineralization attained is significant. Table 1 summarizes the concentrations of some of the pharmaceutical compounds detected in wastewaters of various WWTPs before and after treatment. The variation in concentrations of the compounds before and after treatment confirms the inability of conventional WWTPs to completely remove a number of pharmaceutical compounds. The removal degree varies from 1 to 80%.
Table 1. Detection of pharmaceuticals in the influent and effluents of WWTPs.
| Compounds detected | WWTPs influent (mg/L) | WWTPs effluent (mg/L) | % removal |
|---|---|---|---|
| Ketoprofen | 451 | 318 | 29.5 |
| Naproxen | 99 | 108 | -9.1 |
| Ibuprofen | 516 | 266 | 48.5 |
| Diclofenac | 250 | 215 | 14 |
| Acetaminophen | 10194 | 2102 | 79.4 |
| Bezafibrate | 23 | 10 | 56.5 |
| Clofibrate | 72 | 28 | 61.1 |
| Gemifibrozil | 155 | 120 | 22.6 |
| Carbamazepine | 420 | 410 | 2.4 |
| Ranitidine | 188 | 135 | 28.2 |
| Azithromycin | 152 | 96 | 36.8 |
| Metronidazole | 80 | 43 | 46.3 |
| Sulfamethoxazole | 590 | 390 | 33.9 |
| Trimethoprim | 1172 | 290 | 75.3 |
| Atenolol | 400 | 395 | 1.3 |
| Sotalol | 185 | 167 | 9.7 |
| Propanolol | 290 | 168 | 42.1 |
Recently, Nanofiltration (NF) and Reverse Osmosis (RO) membrane mechanisms have become more prevalent because of their supreme performance in removal of micro pollutants from waste water. NF membrane can remove most trace micro pollutants due to their very small pore sizes, ~1 nm. The lower operating pressure (10–50 bar), higher flux rate, higher retention of multivalent anions, relatively low investment, low operation and maintenance cost and environmental friendliness along with delivering high quality effluent demonstrate NF as an attractive removal mechanism. On the other hand, Organic Solvent Nanofiltration (OSNF) technology in one of the most recent techniques where NF membranes are known to have very high potential to escalate the concentration of dilute species from low molecular weight solvents. This technique affords the recycling of organic solvents at lower energy when paralleled to conventional processes Molecules of 200–1000 g/mol in several organic solvents have been successfully separated using NF membranes. Under this technique, most NF membranes are asymmetric and integrally skinned, and made of polyimides or composites consisting of a thin Poly (Dimethyl Siloxane) (PDMS) separating layer on various types of supports, such as: Polyethersulfone (PES); polysulfone (PSF), Polyamide (PA), Polyimide (PI), Polyacrylonitrile (PAN), Cellulose Acetate (CA), Polytetrafluoroethylene (PTFE), ceramic porous support, polyethylene perforated metal support etc. It has been suggested that highly hydrophobic PDMS provides the best combination of properties to make OSNF with high flux, competitive selectivity and good stability for the removal of most of the organics. For example, Stafie, et al., used PDMS/PAN composite membranes for separation of hexane from mixtures of oil/hexane and PIB-hexane. Dutczak, et al., synthesized composite capillary PDMS membranes to evaluate toluene permeance, whereas Vankelekom, et al., prepared a Polyacrylonitrile- polyester/PDMS (PAN-PE/PDMS) composite membrane for the same purpose [2].
To the best of our knowledge OSNF membranes have only been used for gas permeation and pervaporation; however, we haven’t found any research on utilizing OSNF membrane technology for removal of pharmaceuticals from water resources. In this study, we tried to evaluate the efficiency of composite PDMS-NF membranes, prepared following the preparation technology of OSNF membranes, in eliminating IBP, NPR and DCF from water.
The objectives of this study were to identify and quantify the presence of three specific pharmaceutical compounds: Ibuprofen (IBP), Naproxen (NPR) and Diclofenac (DCF) in the effluent of WWTPs in London, Ontario, Canada; to prepare customized and efficient PDMS membranes using various supports; as well as to evaluate the efficiency of the PDMS membranes in removal of IBP, NPR and DCF from water and compare their performance with a commercial polyimide membrane and a lab made Thin Film Composite (TFC) membrane [3].
Chemicals and Reagents
HPLC-grade (≥ 99%) hexane and methanol were purchased from Sigma Aldrich, Canada. Reagent grade dichloromethane and toluene were purchased from Caledon Laboratories Ltd. For analytical determination, reference compounds for ibuprofen, diclofenac sodium salt, and naproxen (≥ 98%) were purchased from Sigma Aldrich, Canada. Chemical structures and physiochemical properties of IBP, NPR and DCF are provided in Figure 1 and Table 2 respectively.

Figure 1. Chemical Structure of a) Ibuprofen; b) Naproxen; c) Diclofenac.
Table 2. Physiochemical properties of IBP, NPR and DCF.
| Ibuprofen | Naproxen | Diclofenac | |
|---|---|---|---|
| Chemical formula | C13H18O2 | C14H14O3 | C14H11NCl2O2 |
| Molecular weight (g/mol) | 206.30 | 230.3 | 296.2 |
| Water Solubility (mg/L) | <1 | 15 | 2.37 |
| pKa | 4.91 | 4.15 | 4.15 |
| Log KoW | 4.13-4.91 | 3.18-3.24 | 4.51 |
| Vapour Pressure (mm Hg) | 1.86 x 10⁻⁴ | 1.89 x 10⁻⁶ | 6.14 x 10⁻⁸ |
| Henry’s Law constant (atm-m3/mole) | 1.5 x 10⁻⁷ | 3.39 x 10⁻¹⁰ | 4.73 x 10⁻¹² |
Anhydrous N,N-Dimethylformamide (99.8%), Polysulfone pellets (average M.W. ~35,000), pyridine, M-Phynylenediamine (MPD), Trymesoyl Chloride (TMC), Multi-walled Carbon Nanotubes (6-9 nm x 5 µm, >95% carbon) and Trimethylsilyl-2,2,2-trifluoro-N- (trimethylsilyl) acetamide (BSTFA) (99.6%) were also purchased from Sigma-Aldrich, Canada. PTFE laminated membranes (0.1 micron, non-woven polyester backer, 47 mm diameter) were purchased from Sterlitech corporation, USA.
General electric PDMS RTV 615 (500 g) kit was purchased from momentive performance materials. The silicon kit comprises of two components: a) a vinyl terminated pre polymer (RTV 615 A) and b) a Pt-catalyzed cross linker (RTV 615 B) containing a polyhydrosilane component [4].
SYLGARD 184 silicone elastomer kit, purchased from Sigma Aldrich, Canada, comprises of two parts: a polymer base and a hardener. The polymer base has a specific gravity of 1.05 g/cm3 at 25°C and a viscosity of 500 mPa-s; it is a viscous, colorless liquid containing dimethylsiloxane, dimethylvinilterminated, dimethyl vinilated and trimethylated silica as well as tetra (trimethylsiloxy) silane. The hardener with a specific gravity of 1.03 g/cm3 at 25°C and a viscosity of 110 mPa-s, consisted of dimethyl methylhydrogen siloxane tetramethyl tetravinyl cyclotetrasiloxane. The kit was a 10-g pack; base and hardener were pre measured by the supplier.
Laboratory grade water was obtained with a Barnstead easy pure UV 45 Ultrapure water purification system (Barnstead, IOWA, U.S.A.).
Collection of wastewater samples
All glassware, supplies and containers were solvent rinsed three times each with acetone, hexane, and methanol. To analyze Pharmaceutically Active Compounds (PhACs), wastewater effluent samples were collected over a six month period, from August 2015 to January 2016, from two WWTTPs: greenway pollution control plant and Adelaide wastewater treatment plant, in London, ON, Canada. Triplicate grab samples were collected in both cases into clean and dry amber bottles. The samples were immediately filtered through 0.45 µm filters purchased from Whatman. For the analysis of PhACs, the samples were acidified to pH=1.95 with Hydrochloric Acid (HCl).
Sample preparation
Analytical stock solutions of IBP, NPR, and DCF of 1 mg/mL were prepared in methanol and stored at -18°C. To prepare calibration curves, standards of different concentrations were prepared by diluting the stock solution in methanol [5].
Extraction and derivatization of samples
Because of the very low concentration of PhACs in water samples, pre concentration by Liquid-Liquid Extraction (LLE) and derivatization of the extracted sample are required before GC- FID analysis; dichloromethane has been used as the solvent for LLE.
Liquid-liquid extraction
LLE technique was followed in the present study to extract IBP, NPR and DCF; to perform a successful LLE, 50 mL of the samples were extracted with 50 mL of Dichloromethane (DCM) (Sample: DCM=1:1), three times, by using a separatory funnel. A BÜCHI Rotavapor® with the water bath maintained at 45°C (± 2°C) was used to evaporate the collected DCM extract until it was about 1 mL. The extract was then moved to a 2-mL vial and completely dried with N2. In order to be compatible with GC analysis, subsequently a sample derivatization was required to make the compounds more volatile.
Derivatization
The core tenacity of analytical derivatization is to increase the volatility of the analytes by reducing the polarity of carboxylic (COOH-) or phenolic (OH-) functional groups, thereby increasing the thermal stability. In literature, acidic pharmaceuticals containing carboxylic moieties were found to be derivatized by silylation with N,O-Bis(Trimethylsilyl) Trifluoroacetamide (BSTFA), acylation with Trifluoroacetic Anhydride (TFAA), and benzylation with Pentafluorobenzyl Bromide (PFBB), or methylation with Trimethylsulphonium Hydroxide (TMSH) or diazomethane (CH2N2). In this study, samples were derivatized using pyridine (50 µL) and BSTFA (50 µL) at 70°C for 40 minutes [6].
Analytical methods
Separation and detection of the pharmaceutical compounds was done using an Agilent 7890 A GC-FID system. The GC-FID was equipped with a DB-5 column (30 m x 320 µm x 0.25 µm). Hydrogen (H2) was used as a carrier gas at 2.5 mL/min. Nitrogen (N2) was used as a makeup gas with a flow of 20.5 mL/min. Samples (1 µL) were injected in split less mode with a pressure pulse of 30 psi for 1.4 minutes. The injector was set at a temperature of 250°C. The oven temperature was programmed as shown in Table 3. The FID temperature was set at 310°C.
Table 3. Oven temperature program for GC analysis of pharmaceuticals.
| Rate °C/min | °C | Hold time (min) | Total run time (min) | |
|---|---|---|---|---|
| 0 | 60 | 1.5 | 1.5 | |
| Ramp 1 | 20 | 120 | 0 | 4.5 |
| Ramp 2 | 4 | 160 | 0 | 14.5 |
| Ramp 3 | 12 | 300 | 3.83 | 30 |
Method validation
Since sample extraction is a significant step, the recoveries of extracts of target compounds were calculated for spiked WWTP effluent and synthetic water samples at 5 concentration levels: 2.5, 5, 12.5, 25 and 50 µg/L. In case of the WWTP effluents, recoveries were obtained by relating the concentrations achieved to the primary or initial spiking levels. In each case, triplicate samples were analyzed. As the WWTP effluents included target compounds, blanks or un-spiked samples were analyzed and the measured concentrations were deducted from those of the spiked samples. The Method Detection Limit (MDL) for each compound was estimated from its concentration in spiked water samples after subjecting it to LLE and reported as the minimum detectable concentration the compound with a signal to noise ratio of 3. The Instrument Detection Limits (IDL) was calculated from the injection of a standard solution sequentially diluted until a concentration was reached corresponding to a signal to noise ratio of 3.
Recovery of extracted PhACs
Five point calibration curves were generated for IBP, NPR and DCF within a concentration range of 1.25-50 µg/L using linear regression; the curves gave very good fits (R2>0.99) between peak area of the gas chromatographs and concentration (Figure 2). The efficiency of LLE was evaluated using recovery experiments between standards and extractions; here standard refers to the synthetic samples spiked with known concentrations of PhACs that did not go under LLE whereas extraction refers to wastewater effluents with spiked PhACs that went through LLE. Recovery achieved for IBP, NPR and DCF ranged from 80 to 100% (Figure 3A, 3B, 3C). Compound recoveries were tested with water samples having pH between 1.95-3.6 and it was found that a pH of 1.95 showed the maximum recovery. The Method Detection Limit (MDL) for IBP, NPR and DCF was 0.1 µg/L [7].

Figure 2: Calibration curves obtained for ibuprofen, naproxen and diclofenac.

Figure 3: Recovery of ibuprofen, naproxen and diclofenac by liquid-liquid extraction. Figures A, B and C represent the comparison between standards and extracts of ibuprofen, naproxen and diclofenac respectively.
Preparation of NF membranes
In this study, the NF membranes following OSNF technology, were prepared from RTV 615 and SYLGARD 184, using both commercially available PTFE 0.1 µm Ultrafiltration (UF) membranes and laboratory made Polysulfone (PSF) support as the base. In the case of TFC membranes, interfacial polymerization was performed on a PSF support using m-Phenylenediamine (MPD) and Trymesoyl Chloride (TMC) with Multi-Walled Carbon Nanotubes (MWCNTs) [8].
Preparation of the PDMS coating solution with RTV 615
The PDMS coating solution was prepared by dissolving 5 g of RTV 615 pre-polymer (RTV-A) in toluene to make a concentration of 15% (w/w). The mixture was continuously stirred at a speed of 450 rpm and at a temperature of 60°C. Then the cross-linker, RTV-B (0.5 g) was added (RTV-A: RTV-B=10:1) to the solution and this reaction was continued at 60°C in anticipation of the viscosity of the solution to be ~45 mPa-s. The viscosity was measured using Brookfield DV-II+ Pro, programmable viscometer. At this stage, the solution was diluted down to 7.5% by adding toluene and the reaction once more sustained until the viscosity reached ~45 mPa-s. The same procedure was repeated to get final concentrations of RTV 615 of 5%, 2.5%, and 1.85% each with a viscosity of ~45 mPa-s. As soon as the desirable concentration and viscosity were attained, the reaction was stopped by putting the solution into the ice-bath. Several batches of PDMS solutions were prepared using the same procedure during the research period. On the other hand, a number of batches of PDMS solution was prepared as well under the same methodology using hexane as the solvent [9].
Preparation of the PDMS coating solution with SYLGARD 184
A 20% PDMS solution was prepared using SYLGARD 184 and hexane. The base and the hardener were mixed at a ratio of 10:1 in hexane at 80°C. The solution was stirred continuously, maintaining the same temperature. Following the procedure in section 2.7.1, the solution was diluted to 7, 5, 3.1, 2 and 1% of SYLGARD 184. This preparation as well was repeated several times during the research period.
Preparation of the PSF support
In this case, PSF supports were first prepared using the phase inversion technique. Exactly 20% (w/w) Polysulfone (PSF) was dissolved in N,N’-Dimethylformamide (DMF) to produce the casting solution. This solution was cast on a clean glass plate with a custom made doctor blade with a 200-µm slit. This liquid film was kept in air for about one minute to evaporate the solvent and then immersed in DI water to complete the phase inversion method. After 24 hours, the porous substrate was collected, dried in air and thus was ready to be used as a support [10].
Preparation of the composite PDMS membrane with RTV 615
Composite PDMS (RTV 615) membranes were prepared by using both commercially available PTFE membranes and the PSF supports prepared in this study. Both PTFE and PSF supports were dipped in the pre-crosslinked 7%, 5%, 2.5%, and 1.85% PDMS solution made with toluene and hexane for 30 secs. Subsequently they were taken out of the solutions very fast with a tweezer by keeping the track of time for consistent results. The coated membranes were then dried in air for 30 minutes to evaporate the solvent from the surface. Finally, the membranes were dried in an oven at 60°C for 4, 6 and 8 hours to complete the cross linking reaction; the membranes were ready to use for the rejection and permeation tests after the final cross linking [11].
Preparation of the composite PDMS membrane with SYLGARD 184
Commercially available PTFE membranes were dipped in pre-cross-linked 7, 5, 3.1, 2 and 1% Sylgard 184 PDMS solutions for 30 seconds and then dried in the fume hood for 30 minutes. The PDMS-dipped membranes were then dried in the oven at 80°C for 4, 6, 8, 10, 12 and 18 hours to complete the cross-linking reaction.
Preparation of thin film mixed matrix composite membrane
For the purpose of uniform dispersion of MWCNTs in the PSF matrix, the MWCNTs were first modified. For the modification, 1 g of raw MWCNTs was soaked in 100 mL solution of 3 M HNO3: H2SO4 (1:3, v/v) and then was sonicated with a probe sonicator for 1 h. After that, the solution was refluxed at about 127°C for 12 hours following the study of Vatanpour, et al. Subsequently the solution was diluted with 2 L of DI water and filtered through a 0.45 µm filter. The modified MWCNTs were rinsed with DI water until a pH of ~7 was attained and then were put into the oven for complete drying [12].
Asymmetric MWCNT/PSF support was prepared via phase inversion technique. PSF was first dissolved in N,N’-Dimethylformamide (DMF) to prepare exactly 20% (w/w) casting solution and then it was left overnight to remove the air bubbles. Dried and modified MWCNTs were subsequently added to this polymer mixture to get a 1% MWCNT in the PSF support; the mixture was first stirred on a mechanical stirrer for 4 hours and then sonicated for 30 minutes to get a good dispersion. Next, the solution was cast on a clean glass plate with the doctor blade, left in air for 1 minute and then immersed in DI water for 24 hours to complete the phase inversion technique.
The active skin layer on the support was prepared by an interfacial polymerization following the protocol of Xie, et al.: a 2% (w/v) m-phynylenediamine (MPD) solution was prepared in DI water. The MWCNT/PSF support was immersed in this MPD solution for 10 minutes and then the excess MPD solution was drained off. A rubber roller was used to remove the surplus MPD solution from the support. After that, the support was immersed in 0.1% Trimesoyl Chloride (TMC) in n-hexane solution for 10 secs, washed with 100 mL n-hexane and finally put in oven at 80°C for 10 minutes [13].
Characterization of membranes
Scanning Electron Microscopy (SEM): The Scanning Electron Microscopy apparatus (QuantaTM 3D FEG SEM, FEI Company, USA) was used to study the morphology of the prepared NF membranes. For SEM characterization, the membrane was first immersed in liquid nitrogen for several minutes; afterwards the frozen sample was fractured, sputtered with a thin layer of gold and subsequently analyzed with SEM technique. The gold layer contributed in improvement of the conductivity of the sample surfaces along with providing better quality of the data [14].
Atomic Force Microscopy (AFM): NanoScope MultiMode SPM System and NanoScope IIIa Quadrex controller, Veeco, Digital Instrument, UK were used to do AFM analysis of the membranes. Surface analysis containing roughness determination was completed by AFM images by tip scanning (tapping mode). Roughness of the surface (scanning sample size 5 um x 5 um) was revealed as RMS-Root Mean Squared roughness. Throughout the measurements, silicon nitride (Si3N4) probes NP-1 (spring constant was equal to 0.58 Nm-1, provided by the manufacturer (Veeco)) was applied. All tests were done at ambient temperature.
Separation performance of NF membranes: The filtration experiments were carried out using a stainless steel dead end filtration system. The scheme of the NF experimental setup is described in details elsewhere. The cell contains a cylindrical stainless steel vessel with detachable end plates. A membrane sample was positioned at the end of the cell held by a porous stainless steel disk. The active area of the membrane inside the module was 14.6 cm2 with a feed capacity of ~290 mL. The system was pressurized with compressed nitrogen. Each membrane was pre-compacted with DI water at a pressure of 5-40 bar until a constant flux was obtained. The flux through the membrane was calculated by the following equation:
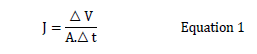
Where J is the permeate flux (Lm-2h-1), ΔV is the permeate volume (L) collected over Δt time (h) and A is the membrane area (in m2). The permeate volume was measured using a graduated cylinder.
IBP, NPR and DCF with pKa values of 4.91, 4.15 and 4.15 respectively are deprotonated at pH 7.5. The pH of the feed solution was maintained at ~7.5. An initial volume of 270 mL feed with desired concentrations of pharmaceutical compounds was passed through the membrane at 20-30 bar until a permeate of 120 mL and a corresponding retentate of 150 mL were collected. The volume of permeate was measured with a graduated cylinder. The concentrations of pharmaceuticals in feed, permeate and retentate were analyzed using GC-FID. The retention of pharmaceuticals was calculated using below Equation 2:
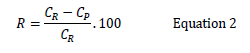
Where, R is the % retention, CR is the concentration of solutes in retentate and CP is the concentration of solutes in permeate. A mass balance was also calculated using below Equation by measuring the concentration of the three pharmaceutical compounds in the feed, permeate and retentate [15].

Where, VR is the retentate volume, CR is the retentate concentration, VP is the permeate volume and VF is the feed volume.
Concentration of IBP, NPR and DCF in wastewater effluent
Tables 4 and 5 show the amount of IBP, NPR and DCF identified in the wastewater effluents of Greenway and Adelaide Treatment Plants during this research work over a period of 6 months.
Table 4. IBP, NPR and DCF in effluents of greenway pollution control plant.
| Date of sample collection | IBP (ug/L) | NPR (ug/L) | DCF (ug/L) |
|---|---|---|---|
| 31-Aug-15 | 0.66 | 2.09 | 0.45 |
| 18-Sep-15 | <LOD | 1.22 | 0.45 |
| 31-Oct-15 | 2.26 | 1.46 | 0.49 |
| 20-Nov-15 | 3.63 | 8.98 | 0.73 |
| 08-Dec-15 | 2.78 | 4.78 | 1.23 |
| 29-Jan-16 | 3.31 | 5.09 | 1.04 |
Table 5. IBP, NPR and DCF in effluents of Adelaide wastewater treatment plant.
| Date of sample collection | IBP (ug/L) | NPR (ug/L) | DCF (ug/L) |
|---|---|---|---|
| 31-Aug-15 | 1.88 | 2.85 | 2.99 |
| 17-Sep-15 | 0.98 | 1.42 | 4.71 |
| 30-Oct-15 | 2.37 | 2.14 | 5.29 |
| 21-Nov-15 | <LOD | 3.62 | 4.84 |
| 07-Dec-15 | 2.85 | 3.64 | 4.56 |
| 31-Jan-16 | 3.32 | 2.98 | 4.14 |
It can be seen that the occurrence of IBP in the effluent of greenway pollution control plant varied between 0.66 to 3.63 µg/L; whereas the concentration ranged between 0.98 to 3.32 µg/L in case of Adelaide wastewater treatment plant. The presence of NPR in the effluents of both WWTPs varied from 1.22 to 5.09 µg/L. On the other hand, the amount of DCF determined in the effluents of Greenway ranged between 0.45 and 1.04 µg/L and, in the case of Adelaide, it was between 0.29 and 0.52 µg/L. Therefore, it can be concluded that the results support quite well what has been reported in literature. Nonetheless, the pattern of usage as well as the removal efficiency of these drugs may also fluctuate throughout the year, resulting in variability in the concentrations of PhACs within the watershed [16].
Preparation of PDMS coating solution
A good quality composite membrane with a thin active layer is made up only when the PDMS coating solution possess adequate concentration and viscosity. Agreeing to Dutczak, et al., high concentration and high viscosity of the coating solution results in a thick PDMS layer, whereas a lower viscous solution consequences in high pore intrusion and defects. According to researches, when the viscosity of the PDMS solution is high and the concentration is low, then a thin, selective layer would be formed. Hence, the pre-cross linking of the low concentrated PDMS solution is highly recommended. Dutczak, et al., utilized a 3.75% (w/w) PDMS toluene solution with a viscosity of 55 mPa-s to formulate a composite capillary membrane and it resulted in the highest toluene permeance and low pore intrusion. Following this concept, in this study, first a 15% PDMS coating solution was prepared, pre-crosslinked and eventually it was diluted to get concentrations of 7.5%, 5%, 2.5% and 1.85% when using RTV 615 and 7, 5, 3.1, 2 and 1% when using SYLGARD 184 as PDMS. It has been found that the PDMS solutions of concentrations 5~7.5% resulted in very tight membranes that were practically impermeable. On the other hand, concentrations as low as 1.85-2.5% with a viscosity of ~45 mPa-s formed the best membranes. Following the study of Dutczak, et al., the pre- crosslinking temperature was maintained at 60°C as it was proved that a temperature below 50°C prevented the viscosity to raise above 20 mPa-s for more than 300 min. This was also verified in the trial experiments in our work [17].
Characterization of NF membrane
SEM characterization: Figure 4 is the SEM photomicrograph representing the cross section of a 2.5% PTFE/PDMS composite membrane. It is apparent from the SEM image that the PDMS top layer is tightly and properly cast on top of the PTFE support. Following the scale, the thickness of the membrane is calculated to be ~10 µm that supported literature data [18].

Figure 4. SEM photographs of 2.5% PTFE/PDMS composite membrane.
AFM characterization
Figure 5 shows the AFM photographs of three PTFE/PDMS membranes and a Thin Film Composite (TFC) membrane: Figure 5A represents PTFE/PDMS prepared with PDMS (RTV 615) solution with a viscosity of ~45 mPa-s; Figure 5B shows a PTFE/PDMS membrane prepared with a PDMS solution of ~15 mPa-s. It is clearly evident that the membrane prepared with a lower viscosity PDMS solution shrinks more than that prepared with a more viscous PDMS solution. Figure 5C shows a TFC membrane prepared with 2% MPD, 0.1% TMC and 0.1% CNT on a 20% PSF support. It has been stated by Yokwana, et al., Vatanpour, et al., Choi, et al. and Shawsky et al., that the introduction of hydrophilic functional groups into the surface of CNTs enhances the dispersion of CNTs into a particular polymer matrix. The use of functionalized carbon nanotubes could increase the hydrophilicity and surface charge of the membrane’s top layer which eventually enhances the property of NF membranes by providing better resistance to fouling and improved salt rejection. In Figure 4C, the dispersed MWCNTs is clear in PSF matrix showing very good bonding of the acid modified MWCNTs in the PSF matrix. The RSM and Ra values for the membranes were between 62–187 and 55-155 nm respectively (Table 6) [19].

Figure 5. AFM images of different NF membranes: A) 2.5% PTFE/PDMS (viscosity ~45 mPa-s) (top left); B) 2.5% PTFE/PDMS (viscosity ~15 mPa-s) (top right); C) 2% MPD, 1% TMC and 0.1% MWCNT on 20% PSF support (bottom left).
Table 6. RSM and Ra values.
| Membranes | RSM (nm) | Ra (nm) |
|---|---|---|
| 2.5% PTFE/PDMS (viscosity ~45 mPa-s) | 62.5 | 51.2 |
| 2.5% PTFE/PDMS (viscosity ~15 mPa-s) | 187 | 155 |
| 2% MPD, 1% TMC and 0.1% MWCNT on 20% PSF support | 100 | 77 |
Permeability performance of NF membranes in contact with pure water
Permeability performance of PTFE/PDMS (RTV 615): The filtration performance of composite PTFE/PDMS membrane in water has been investigated including the effect of transmembrane pressure. It has been found that with an increase in operating pressure, from 5-30 bars, the flux through a 2.5% PTFE/PDMS (RTV 615) membrane increased linearly indicating no compaction of membrane occurred over the applied pressure range. The permeability of the 2.5% PTFE/PDMS membrane was compared with that of DuraMem, a commercially available OSNF membrane, prepared with polyimide, over the same pressure range (Figure 6). The results show that this membrane was also not compacted over the applied pressure range and if compared, it can be seen that the flux through the laboratory made PTFE/PDMS is higher than that of the commercially available DuraMem membrane. Table 7 shows the permeability of PDMS membranes (LP) for different types of solvents [20] .

Figure 6. Relationship between flux and pressure for 2.5% PTFE/PDMS (RTV 615) and commercial DuraMem membrane.
Table 7. Permeability (LP) of PDMS membranes for different solvent.
| Membrane | Solvent | Permeability (LP) L/(m2-h-bar) |
|---|---|---|
| Pebax Composite Membrane | Hexane | 3 – 4.9 |
| D membrane from osmonics | Hexane | 1.6 |
| MPF-50 | Hexane | 1.52 |
| M20/55 | Toluene | 1.6 |
| PAN-PE/PDMS | Toluene | 1.2 |
Permeability performance of PTFE/PDMS (SYLGARD 184)
When the PDMS solutions were prepared from SYLGARD 184 (15%, 7%, 3.1%, 2%, 1%), it was found that 15% and 7% resulted in very tight and practically non-permeable membranes whereas 1%, 2% and 3.1% solutions were successfully tested to check the permeability at 10, 20, 30 and 40 bars. The membranes were compacted when the applied pressure exceeded 20 bars. Figure 7 represents water flux as a function of applied pressures for 3.1, 2 and 1% SYLGARD 184 PTFE/PDMS membranes. It is evident from Figure 7 that with a decrease in PDMS concentration, flux increases; 3.1% gives the lowest flux and 1% shows the flux after 2 hours of operating. Nevertheless, in this case also, the permeability was lower than that of the PTFE/PDMS made from RTV 615. Thus, it can be stated the PTFE/PDMS composite membrane prepared from 2.5% RTV 615 with a viscosity of ~45 mPa-s showed the highest flux among all the NF membranes prepared within this study.

Figure 7. Flux (L/m2-h) at different pressures for 3.1%, 2% and 1% PDMS/PTFE membrane made from SYLGARD 184.
Removal of PhACs using different types of NF membranes
The transport mechanism of organic solutes through NF and RO membranes has attracted the attention of several researchers. It is very important to understand the retention mechanism of the trace contaminants in the nanomembrane as well as their chemical characteristics and environmental fate in order to design a suitable treatment system. The separation through the nanomembrane can be achieved by physical selectivity (charge repulsion, size repulsion, size exclusion or steric hindrance) or chemical selectivity (solvation energy, hydrophobic interaction or hydrogen. Size exclusion is an important phenomenon showing that suspended particles larger than the pore sizes of the membrane are rejected by the membrane surface as wastewater passes through. This can be compared to sieving phenomenon except that neither the solute has uniform size nor the membranes possess uniform pores. Pore size, molecular size and pure water flux are found to be useful for predicting solute retention. When the membrane pores are larger than the size of trace contaminants, surface diffusion becomes faster than sorption diffusion. Another important removal mechanism is adsorption and subsequent sorption diffusion which is the initial stage in the transport mechanism of organic molecule using NF. Measurement of the hydrophobicity is done through LogKow i.e., partitioning between octanol and water. Trace contaminants with high LogKow or high hydrogen bonding capacity get adsorbed to the membrane surface. The capability to form hydrogen bonding with hydrophilic groups of membrane polymer regulates the water flow through the membrane, whereas adsorption caused by hydrogen bonding can lessen water infiltration. Compounds with no hydrogen bonding capacity are reported to exhibit significant adsorption and negligible water flux drop whereas compounds with high hydrogen capacity promotes significant drop in flux. The electrostatic and steric hindrance have significant involvement in the solute retention, which is a function of the ratio of charge density of membrane to ionic concentration, solute radius to pore radius of membrane as well as relative mobility between cations and organic anions. In other words, it can be revealed that pH and ionic strength can be expected to be influential factors in the retention of organic molecules. Various researchers have reported an increase in the rejection of negatively charged organic solutes owing to electrostatic repulsion among the negatively charged membrane and the negatively charged organic solute; however, organics that are positively charged show reduced retention on negative membranes. At high pH, the adsorption is lower because of charge repulsion. With a variation in pH, the zeta potential of the membrane diverges from positive to negative along with dissociation of the functional groups of membrane polymers taking on positive or negative charge fractions. When the NF membranes are considered to be “tight”, then the rejection of polar trace contaminants might be dominated by a size exclusion/steric hindrance mechanism.
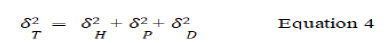
There is a general lack of good understanding of the fundamental transport mechanisms for both solute and solvent in the NF membrane system, through dense or porous structure. According to some researchers, the solution-diffusion process is the mechanism of transport through NF membranes. This model describes the transport mechanism through a polymer film as a composition of three main steps: Sorption, diffusion and desorption. Whereas others have advocated a convective mechanism, based on several specific fluid dynamic laws, as the explanation for transport through porous media. Soltane, et al., invoked the Hagen-Poiseuille law as the most likely explanation, wherein it is assumed that the membrane is made of cylindrical pores. Besides, the Spiegler-Kedem-Katchalsky model is a hybrid model in which the membrane is considered to be a “black box” and the solvent and solute fluxes are expressed separately. Soltane, et al., worked specifically on solute transport processes in NF membrane mechanism by describing solvent-membrane affinity, solvent solute affinity and solute membrane affinity; they predicted through the concept of solubility parameter theory by Hansen. According to Hansen’s solubility parameter theory, the solubility parameter describes the density of cohesive energy and comprises of three different types of interactions: hydrogen bonding interactions (δH), polar interactions (δP) and dispersion interactions (δD). The total solubility parameter, can be expressed as:
The more comparable the solubility parameters of two molecules are, the more imperative is their affinity and the more they can be conjointly soluble. In consequence, the absolute difference in solubility parameter of two molecules allows for the evaluation of a qualitative assessment of the strength of their attraction. If δA and δB are solubility parameters of molecules A and B respectively, then the absolute difference in their solubility parameter is |δB−δA|; the higher the |δB−δA| value, the lower their mutual affinity.
In the present study, NF with a PTFE support and a 2.5% PDMS top coating has been used to assess the retention capacity of the membrane for IBP, NPR and DCF from aqueous media. The solubility parameters for the pharmaceutical compounds, water and PDMS membrane are given in Table 8. Since an established universal model for the solute transport in NF membrane, prepared following the OSNF technology, does not exist, an experimental approach by Soltane et al., was followed in this study to analyze the effects of solute sorption/ diffusion through the PDMS membrane. For the purpose of a better understanding of solute transport through PDMS membranes, various interactions such as, solvent membrane affinity, solvent-solute affinity and solute membrane affinity were considered (Table 8).
Table 8. Solubility parameters of pharmaceutical compounds, water and PDMS.
| Compounds | Solubility parameter δ (MPa)1/2 | |δsolute-δmembrane| | |δsolute-δsolvent| |
|---|---|---|---|
| IBP | 20.9 | 4.38 | 26.91 |
| NPR | 23.4 | 6.98 | 24.41 |
| DCF | 27.79 | 11.37 | 20.02 |
| Water | 47.81 | ||
| PDMS | 16.42 | ||
Figure 8 illustrates the rejection capacity of the 2.5% PDMS membrane for the studied pharmaceuticals, IBP, NPR and DCF. The results show that this particular PDMS membrane was able to reject 64% IBP, 65% NPR and 70% DCF. The graph also includes the values of solute membrane affinity (on top) and solute-solvent affinity (at the bottom) for each of the pharmaceuticals. According to this graph, DCF has the lowest solute membrane affinity, while IBP has the highest value. According to Soltane, et al., the solute membrane affinity seems to have a significant effect on the separation mechanism: the higher the interaction, the lower the rejection. This supports rejection results in the present study: DCF showed the highest rejection when compared to IBP and NPR. Then again, the lower the affinity of the solute with the solvent, the less significant the rejection of the solute is: this is also supported by our results since IBP has the lowest solute solvent affinity and the lowest rejection.

Figure 8. Removal of pharmaceuticals by 2.5% PTFE/PDMS (RTV 615) membranes.
Another set of experiments were performed to see the effect of base support of a 2.5% PDMS membrane on removal efficiency of IBP, NPR and DCF. The first membrane contained 2.5% PDMS active layer on a commercially available PTFE support and the second are possessed 2.5% PDMS active layer on a laboratory made 20% PSF support. From Figure 9, it can be seen that change of support did not greatly affect the removal efficiency of the membrane. That means the composite membrane, prepared in the laboratory by casting PSF support and top coating with PDMS solution was as efficient as the composite membrane prepared by using commercially available PTFE support.

Figure 9. Comparison of pharmaceutical removal capacity of 2.5% PDMS membrane having PTFE and PSF support.
The TFC membrane prepared in lab with 2% MPD, 0.1% TMC and 0.1% CNT on a 20% PSF support was also used to check the removal capacity for IBP, NPR and DCF and it was found that IBP was removed 60%, NPR 56% and DCF 66%. In literature, it has been mentioned that commercial NF membranes are able to remove ~99% of PhAcs; however, the actual composition of those NF membranes are not mentioned anywhere
PTFE/PDMS membranes prepared with 3.1%, 2% and 1% SYLGARD 184 were used for removing pharmaceuticals and it was found that 3.1% PTFE/PDMS showed the lowest removal efficiency whereas 2% PTFE/PDMS performed the best (Figure 10).

Figure 10. Removal efficiency of 3.1%, 2% and 1% PTFE/PDMS (SYLGARD 184) membranes.
When commercial DuraMem membrane was used, the removal % for IBP, NPR and DCF was 48.6%, 45.4% and 58.12%, respectively. Thus it can be seen that the 2.5% PTFE/PDMS (RTV 615) is better than the Commercial DuraMem membrane from the perspective of both permeability and removal of pharmaceuticals. Figure 11 shows a comparison between the four types of membranes used in this study for the removal of IBP, NPR and DCF. It is clear that the composite PTFE/PDMS prepared with RTV 615 gives the best result among all the membranes.

Figure 11. Comparison of removal efficiency of IBP, NPR and DCF: DuraMem, PTFE/PDMS (RTV 615), PTFE/PDMS (SYLGARD 184) and TFC.
After analyzing the wastewater effluents from Adelaide wastewater treatment plant and greenway pollution control plant, over a period of six months, it has been found that samples contained IBP, NPR and DCF in very small concentrations, 0.66 ~3.63 µg/L, 1.22 to 8.98 µg/L and 0.29 to 1.23 µg/L respectively, supporting the previous research works.
While preparing PTFE/PDMS composite membranes using RTV 615, it could be concluded that the process of pre crosslinking was necessary to get a PDMS solution of low concentration and high viscosity because PDMS solutions with higher concentrations and lower viscosity declined the permeability of the membranes. The optimal condition was, therefore, pre crosslinking of a 2.5% PDMS (RTV 615) solution at 60°C until a viscosity of ~45 mPa-s is achieved. The most appropriate duration of final cross linking was found to be 4 hours. However, when SYLGARD 184 was used as PDMS solution, the final cross-linking time extended up to 18 hours.
Along with PTFE/PDMS (RTV 615) and PTFE/PDMS (SYLGARD 184), a commercial OSNF membrane, DuraMem, was also tested for membrane permeability as well as removal efficiency of PhACs. It has been found that all of the membranes showed a linearity between flux and pressure within a pressure range between 5~20 bars. It was found that 2.5% PTFE/PDMS (RTV 615, viscosity ~45 mPa-s) showed the best performance in case of both permeability and removal efficiency of IBP, NPR and DCF. The retention mechanism of OSNF for pharmaceuticals has been explained by solution diffusion mechanism based on Hansen’s solubility parameter theory.
[Crossref] [Google Scholar] [PubMed]
[Crossref] [Google Scholar] [PubMed]
[Crossref] [Google Scholar] [PubMed]
[Crossref] [Google Scholar] [PubMed]
[Crossref] [Google Scholar] [PubMed]
[Crossref] [Google Scholar] [PubMed]
[Crossref] [Google Scholar] [PubMed]
[Crossref] [Google Scholar] [PubMed]
[Crossref] [Google Scholar] [PubMed]
[Crossref] [Google Scholar] [PubMed]
[Crossref] [Google Scholar] [PubMed]
[Crossref] [Google Scholar] [PubMed]
[Crossref] [Google Scholar] [PubMed]
[Crossref] [Google Scholar] [PubMed]
[Crossref] [Google Scholar] [PubMed]