Research & Reviews: Journal of Ecology and Environmental Sciences
ISSN: 2347-7830
ISSN: 2347-7830
Sandani Buddhima Abewickrama*, Daham Jayawardana, Kalpana Dissanayake, Kuis Gunathilake, P.L.Herath
Department of Forestry and Environmental Science, University of Sri Jayewardenepura, Gangodawila, Sri Lanka
Received: 13-Oct-2022, Manuscript No.JEAES-22-77095;Editor assigned: 18-Oct-2022, Pre QC No. JEAES-22-77095 (PQ); Reviewed: 01-Nov-2022, QC No. JEAES-22-77095; Revised: 08-Nov-2022, Manuscript No. JEAES-22-77095 (A); Published: 14-Nov-2022, DOI: 10.4172/2347-7830.10.07.005
Visit for more related articles at Research & Reviews: Journal of Ecology and Environmental Sciences
The main objective of this study is to investigate the sorption behaviour of fluoride in tea waste under various fluoride concentration levels in water in Sri Lanka and to study the chemical kinetics of fluoride adsorption by tea waste with the necessary amendments for fluoride removal from drinking water for effective use of tea waste. The physicochemical characteristics of tea waste were investigated using SEM, AAS, BET, and FTIR analysis. The results obtained by batch experiments showed that the maximum removal efficiency attained was at pH 6, after 20 min of contact time, and with an adsorbent dose of 1.5 g. The adsorption equilibrium isotherms followed by the Langmuir model, and the reaction obeyed the pseudo-second-order model. It was found that phosphate ions have shown maximum influence on the fluoride removal by the soil mixture, and the tea waste-laterite mixture containing 65% tea waste showed the highest removal efficiency with the maximum adsorption capacity of 0.0216 mg/g. Finally, a fluoride removal setup was prepared and the filtering performance of the tea waste-based mixture was studied under selected influent fluoride concentrations of 1.5 ppm, 2.0 ppm, and 2.5 ppm, respectively. The results of this experiment showed that each filtering set-up with different influent concentrations had significant fluoride removal efficiency to the WHO drinking water quality standard limit of 1.5 ppm. The optimum fluoride removal happened at pH6 in both batch experiments and filtering set-up experiments. Therefore, the material can be applied for fluoride removal without changing the normal pH of potable groundwater.
Tea waste; Laterite; Fluoride; Sorption
Fluorine is the most electronegative element that occurs naturally [1]. It benefits teeth at low drinking water concentrations, but excessive fluoride exposure can produce several adverse effects. In contrast, the range from mild dental fluorosis to crippling fluorosis increases with exposure to high levels.
The majority of fluoride in the human body is ingested through drinking water [2]. According to the WHO, the standard fluoride concentration in drinking water ranges from 0.5 to 1.5 mg/L [3]. Higher fluoride levels in potable water in hot tropical lands where people consume large amounts of water can lead to excessive fluoride intake [4]. Water must be treated to meet regulated concentrations to meet these recommended levels. Precipitation and coagulation, membrane separation, ion exchange, and adsorption are some of the primary defluoridation techniques used to reduce fluoride levels in drinking water [5]. Even though most defluoridation methods are commercially available, removing fluoride from water is not always simple or inexpensive. Attempts to develop a method of defluoridation that can be sustained under varying social, financial, environmental, and technical constraints have not been fully successful [6]. Therefore, Cost-effective, easy-to-handle, and quick defluoridation methods are in high demand in developing countries like Sri Lanka. Adsorption is generally regarded as an appropriate technique for small community water sources compared to other methods due to its simplicity of design, ease of operation, availability of a diverse range of adsorbents, and low operating and investment costs [7]. Tea is the most commonly consumed beverage that second only to water since it is consumed by a large number of people all over the world. Recent increases in tea use worldwide have resulted in large quantities of tea waste [8]. The production of such large amounts of waste alone from the tea sector would inevitably contribute to many environmental problems associated with its inappropriate disposal [9]. The adverse environmental effects of simply disposing of tea waste could be mitigated by developing uses for tea waste as a low-cost source of biomass.
Little work has been done so far to test the use of tea waste in the defluoridation of drinking water [10]. There are no studies done on the use of tea waste for sorption experiments in Sri Lanka [11]. Sri Lanka has diverse fluoride concentrations in groundwater, and high fluoride levels in groundwater pose serious health risks to the household level. The study's objective is to effectively use tea waste for potential applications by studying the behaviour of fluoride in tea waste under selected water types and exploring the chemical kinetics of the adsorption of fluoride with the necessary amendment for the effective use of tea waste.
Tea waste was collected from households and washed with boiling water several times until the supernatant solution remained colorless [12]. The washed tea waste was oven-dried at 105ºC until tea waste got dried. Then the dried tea waste was grounded and sieved in a 0.5 mm US standard sieve. The laterite soil obtained from the southwestern part of Sri Lanka was washed several times using distilleº water to remove impurities. Then the sample was air-dried for around 24 hours to remove moisture and soil samples were ground with the motor and the pestle. Finally, the ground samples were sieved using a US standard sieve of 0.5 mm. prepared tea waste powder and laterite powder were placed in zip lock bags to reduce moisture loss and contamination. Groundwater samples were randomly collected from Kalutara and Colombo districts in the western province, and samples were taken as composite samples. Nitrate, Sulfate, Fluoride, and Phosphate solutions were prepared by dissolving sodium nitrate (NaNO3), sodium sulfate (Na2SO4), sodium fluoride (NaF), and potassium phosphate dibasic anhydrous (K2HPO4) in distilled water. All chemicals and solvents used during experiments were of analytical grade quality.
Physico-chemical analysis of tea waste
X-Ray Fluorescence (XRF) analysis: The powdered laterite samples were initially analyzed for major and trace elements by X-ray fluorescence spectrometry (RIX 2000) at the National Gem and Jewellery Research and Training Institute, Sri Lanka. The sample was split and oven-dried for 48 hours at 160ºC. Under a force of 200 kN for 60 seconds, powdered samples (<63 μm) were compressed into briquettes [13].
Fourier-Transform Infrared spectroscopy (FT-IR) analysis: FT-IR analysis was performed in the Instrumental centre of the Institute of Chemistry Ceylon to investigate the chemical bandings of all filter media before and after filtration. Small amounts (2-5 mg) of samples were placed directly on the plates and operated by the machine with the assistance of the staff.
SEM (Scanning Electron Micrograph) and EDX (Energy-Dispersive X-ray spectroscopy): The test was carried out utilizing double-sided conductive carbon tape of gold-sputtered ground soil samples mounted on the SEM sample holder. At a steady current of 25 mA, gold sputtering of ground soil was achieved [13]. The instrumentation facility was provided by the Department of Materials Science and Engineering, University of Moratuwa.
Atomic Absorption Spectroscopy (AAS): There can be chemical changes occur and elements readily available in the samples can be leached to the solution during the experiment. An elution test was carried out and the filtrate was acidified using concentrated HCl for preservation. The prepared samples were analyzed to determine element concentrations using the AAS at the Geological Survey and Mines Bureau.
Determination of the textural properties of mixtures: The textural properties of the studied samples were determined from the adsorption and desorption isotherms. The powdered sample was analyzed for specific surface area and pore size distributions by N2 adsorption at 77 K using the Autosorb IQ-MP (1 Stat.) Viton BET surface area analyzer. The pore size distribution was obtained from the adsorption isotherm using the BJH (Barrett- Joyner-Halenda) method [14].
Determination of the pH (pzc) of tea waste
For the determination of the pH value at the point of zero charges of tea waste, solutions of 50 ml 0.1 M NaCl were taken, and the initial pH (pHi) of solutions was adjusted between 2 and 10 by the addition of 0.1 M HCl and 0.1 M NaOH. After pH adjustment, 0.05 g of tea waste was added to the solutions, and the suspension was shaken at a speed of 120 rpm at room temperature. After 24 hours, the solutions were filtered by a 0.45 μm cellulose acetate membrane, and the final pHs (pHf) of the filtrates were measured. The difference between the initial and final pH values (Δ pH =pHi -pHf) was plotted versus pHi. The pH at which Δ pH=0 was considered the pH value at the point of zero charges [15].
Investigate possible sorption behavior of different fluoride concentrations with the tea waste in selected water type under common salinity/hardness
Step 01- Groundwater samples were collected from the districts of Colombo and Kalutara and tested with tea waste. Then, tea waste was added to collect groundwater samples, maintaining a tea waste: groundwater ratio of 1:200 (g: ml). The mixture was shaken at 120 rpm at 25ºC at room temperature for 1 hour. The solid phase was separated using centrifugation at 4000 rpm for 10 minutes. Then, solutions were filtered by millex-GP syringe filter unit pore size 0.45 μm. The concentration of remaining fluoride was determined in supernatants by the Hach DR900 Multipara meter Portable Colorimeter. The percentage removal efficiency was calculated using equation (1) [15].
Step 02- Fluoride concentrations in collected groundwater samples were adjusted and tested with tea waste to determine the sorption behavior of tea waste under different fluoride concentrations in groundwater. The required amounts of material were then added to the fluoride level-adjusted groundwater samples and repeat the procedure in step 01.
Determination of the optimum mixing ratio of tea waste and laterite
Tea waste and laterite powder were combined at various mass percentages of tea waste, ranging from 50% to 100% while maintaining the overall mass constant at 1 g. A series of fluoride solutions (C0=2 mg L-1) were added with the prepared mixtures keeping a ratio of [m:V]=[1:50]. The mixtures were then shaken for 1 hour with an agitation speed of 120 rpm at room temperature. The solid phase was separated by centrifugation at 4000 rpm for 10 min. The solutions were filtered by a millex-GP syringe filter unit pore size of 0.45 μm. The concentration of remaining fluoride was determined in supernatants by the Hach DR900 Multiparameter Portable Colorimeter. The percentage removal efficiency was calculated using equation (1) and the amount of fluoride absorbed per unit weight of adsorbent (qe in mg g−1) was calculated as equation (2).
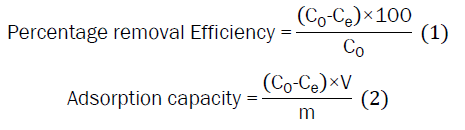
Where C0 is the initial fluoride concentration and Ce is the equilibrium concentration of fluoride in solution (mg L−1), V is the volume of solution (L), and m is the mass of the tea waste and laterite (g) [15,16].
Batch experiments
Effect of dosage: The effect of adsorbent dosage on fluoride adsorption was studied by adjusting the adsorbent dosage from 0.5 g to 10.0 g with an initial fluoride concentration of 2 mg L−1. Then TWL65 mixture was added to the solution, maintaining a ratio of 1:200(g: ml), respectively. The pH of the synthesized solution was adjusted to 6.00, and the experiment was done at a normal room temperature of 25ºC. The mixture was shaken at 120 rpm for 1 hour. After 1 hour, the solid phase was separated by using centrifugation at 4000 rpm for 10 min, and then solutions were filtered by millex-GP syringe filter unit pore size 0.45 μm. The remaining fluoride concentration was immediately determined in supernatants by the Hach DR900 Multipara meter Portable Colorimeter.
Effect of optimum contact time: The influence of contact time on adsorption experiments was investigated. The series of solutions with an initial fluoride concentration of 2 mg L-1 were mixed with TWL65 maintaining a ratio of 1:200, at the optimum dosage of 1.5 g of TWL65. The pH was adjusted to 6, and the temperature was 25ºC. The mixture was kept for different time intervals from 5.00 minutes to 6.00 hours while shaking under 120 rpm in the mechanical stirrer to determine the optimum contact time for fluoride removal. Then the solid phase was separated by using centrifugation at 4000 rpm for 10 min, and then solutions were filtered by millex-GP syringe filter unit pore size 0.45 μm. The concentration of remaining fluoride was determined in supernatants by the Hach DR900 Multipara meter Portable Colorimeter.
Effect of pH: The effect of adsorbent dosage on fluoride adsorption was studied by adjusting the solution pH from pH 2-11 by using 0.1 M HCl and 0.1 M NaOH at optimum with an initial fluoride concentration of 2 mg L−1 with optimum dosage and optimum contact time. The required amount of material was added to the solution, maintaining a 1:200 (g: ml) ratio of the TWL65 mixture and the fluoride solution, respectively. The mixture was shaken at 120 rpm at 25ºC at room temperature. The solid phase was separated by centrifugation at 4000 rpm for 10 min. The solutions were filtered by millex-GP syringe filter unit pore size 0.45 μm. The concentration of remaining fluoride was determined in supernatants by the Hach DR900 Multiparameter Portable Colorimeter.
Adsorption kinetic studies
Kinetic adsorption experiments were conducted with a series of solutions with an initial fluoride concentration of 2 mg L−1, optimum pH, and optimum adsorbent dosage, at room temperature of 25ºC by varying the contact time with an agitation speed of 120 rpm. After the predetermined time interval was completed, the solids phase was removed from the solutions by filtration using 0.45 μm cellulose acetate membrane filters, and fluoride concentrations were analyzed. The dynamics of the fluoride adsorption process by TWL65 were evaluated with the pseudo-first-order (Eq. (3)), pseudo-second-order (Eq. (4)) kinetic models [17,18].
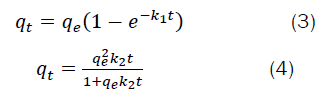
Where qt and qe and are the amounts of nitrate ions adsorbed on the modified biochar (mg g−1) at time t and equilibrium time, respectively; k1 is the rate constant of the pseudo-first-order (min−1), k2 is the rate constant of the pseudo-second-order (g mg−1 min−1).
Adsorption isotherms
Equilibrium adsorption experiments were conducted using a series of solutions with initial fluoride concentrations of 1.5-3.5 mg L-1 with an optimum solution pH and optimum adsorbent at room temperature 25ºC. The mixtures were shaken at 120 rpm, and after equilibration, samples were filtered by 0.45 μm cellulose acetate membrane filters and were analyzed by the HACH DR900 Multiparameter Portable Colorimeter for the determination of residual fluoride concentration. The Langmui, Freundlich and Temkin models were applied to fit the equilibrium data. Each isotherm model was expressed by relatively certain constants, which characterized the surface properties and indicated the adsorption capacity of this material [19-21].
Effect of co-existing (competing) anions
The fluoride adsorption potential of the mixture TWL65 was also investigated in the typical presence of co-existing (competing) anions (e.g., phosphate, sulfate, and nitrate) in real groundwater. Experiments were conducted by adding varying concentrations of co-existing anions (5-50 mg L-1) in a fluoride solution with a fixed fluoride concentration of 2 mg L-1, optimum pH, optimum contact time and optimum adsorbent dosage. The mixtures were shaken at a speed of 120 rpm at a room temperature of 25ºC. Then the solid phase was separated from the solution by filtration using a millex-GP syringe filter unit pore size 0.45 μm. The concentration of remaining fluoride was determined by the Hach DR900 Multipara meter Portable Colorimeter.
Fluoride removal study with tea waste and laterite mixture
A simple fluoride removal setup was designed to study the effect of feeding volume on fluoride removal efficiency and changes in pH of effluent solutions using transparent plastic pipes with a 3.5 cm diameter and a cross-sectional surface area of 38.5 cm2. The height of the pipes used to prepare filter columns was 20 cm. Prepared 3 different influent fluoride solutions (1.5 ppm, 2.0 ppm, and 2.5 ppm) were used for filter from each filter setup. The influent laboratory-prepared fluoride solution was entered into the filter at the top and effluent was collected from the bottom of the columns of each filter [22]. Each column was filled with 100 g of TWL65 filter media with a sand layer about 1 cm in height at the bottom.
Analysis of data
All analyses were performed using IBM SPSS Statistics 18.
Physico-chemical analysis of tea waste and laterite
The composition of the soil samples used was determined using an XRF analysis. There were 33 elements and compounds found in laterite (Table 1). Fe was the most common element in all three samples, accounting for 65.1% ± 0.643% of the total mass. Aside from that, Al and Si were plentiful. When it comes to the compounds discovered by XRF analysis, SiO2 is the most abundant of all three. High levels of Al2O3 and Fe2O3 were also found. TiO2, CaO, and K2O are among the other compounds discovered (Table 1) [13].
| Sample 1 | Sample 2 | Sample 3 | Average | Min | Max | SD | |
|---|---|---|---|---|---|---|---|
| Minerals/ wt % | - | - | - | - | - | - | - |
| SiO2 | 44.6 | 44.3 | 44.8 | 44.6 | 44.3 | 44.8 | 0.252 |
| Al2O3 | 32.9 | 33.5 | 33 | 33.1 | 32.9 | 33.5 | 0.321 |
| Fe2O3 | 19.3 | 18.8 | 18.9 | 19 | 18.8 | 19.3 | 0.265 |
| TiO2 | 2.31 | 2.34 | 2.33 | 2.32 | 2.31 | 2.34 | 0.015 |
| K2O | 0.171 | 0.168 | 0.162 | 0.167 | 0.162 | 0.171 | 0.005 |
| CaO | 0.078 | 0.07 | 0.085 | 0.078 | 0.07 | 0.085 | 0.008 |
| Elements/ wt % | |||||||
| Fe | 64.8 | 64.6 | 65.8 | 65.1 | 64.6 | 65.8 | 0.643 |
| Al | 16.3 | 15.8 | 15.8 | 16 | 15.8 | 16.3 | 0.289 |
| Si | 14.9 | 15.6 | 14.7 | 15.1 | 14.7 | 15.6 | 0.473 |
| Ti | 1.91 | 1.91 | 1.9 | 1.9 | 1.87 | 1.91 | 0.023 |
| Zr | 1 | 0.98 | 1 | 1 | 0.984 | 1 | 0.009 |
| Tb | 0.26 | 0.19 | 0.3 | 0.3 | 0.196 | 0.347 | 0.076 |
| Co | 0.18 | 0.2 | 0.2 | 0.2 | 0.181 | 0.201 | 0.01 |
| Gd | 0.17 | 0.16 | 0 | 0.2 | 0.164 | 0.175 | 0.008 |
| K | 0.13 | 0.13 | 0.1 | 0.1 | 0.129 | 0.131 | 0.001 |
| V | 0.08 | 0.08 | 0.1 | 0.1 | 0.085 | 0.088 | 0.002 |
Table 1. Composition of raw laterite.
Elution analysis was carried out for tea waste to find readily available metal ions that can be leached into the solution. The elements which can be leached to the filtrates were checked through atomic absorption spectroscopy (Table 2). According to the results obtained, Na, Mg, K, Fe, Mn, Al, and Ca were found, and these elements were present at ppm level. All elements were present in ppm levels that were highly below the WHO drinking water quality guidelines [3].
SEM observed the surface topography of the tea waste. The surface of the tea waste was rough and had tiny pores, and the adsorbent surface was irregular and porous. Thus, the surface of tea waste would facilitate the adsorption of fluoride ions onto tea waste (Table 2) and (Figures 1 and 2) [23,24] .
| Constituents determined | Element concentration (ppm) |
|---|---|
| Fe | 0.11 |
| Mg | 8.6 |
| Na | 12.6 |
| Mn | 0.3 |
| Al | <0.1 |
| K | 3.3 |
| Ca | 2.7 |
Table 2. Elements detected in the elution analysis of tea waste.

Figure 1: SEM images of tea waste at higher magnification.

Figure 2: Low-temperature nitrogen adsorption and desorption isotherms of samples TW and TWL65.

BET analysis was performed to study the surface area, total pore volume, and average pore radius of the TW and TWL65 mixture. The BET surface area was higher in the TWL65 mixture than in the TW, which is relatively higher than other common-plant-based adsorbents [25]. The average pore radii of TW and TWL65 recorded were 3.3077 nm and 8.9620 nm, respectively, which fall within the range of mesoporous pore size within 2-50 nm. The N2 adsorption/desorption isotherm exhibits the type IV behavior for TWL65 in Figure 2, which is characteristic of mesoporous structure based on the IUPAC classification. The main advantages of mesoporous materials are narrow pore size distributions and high surface areas, simple organic functioning strategies, biocompatibility, and low toxicity [26]. The applicability of both blends for the study is thus confirmed. Points of zero charge (pHpzc) are the pH at which the adsorbent's net surface charge is zero. The difference between the initial and final pH values (Δ pH=pHi−pHf) was plotted versus pHi. The pH at which Δ pH=0 was considered as the pH value at the point of zero charges [26]. The results of this experiment show that the pHpzc of tea waste is about 5.10 (Figure 3).

Figure 3: Points of zero charge (pHpzc) of Tea Waste (TW).
Before and after fluoride adsorption, FTIR spectra of each material were obtained for TW and TWL65 (Figure 4). The broad and intense absorption peaks at around 3332 cm-1 correspond to O-H stretching vibrations caused by inter and intermolecular hydrogen bonding of polymeric compounds (macromolecular associations), such as alcohols, phenols, and carboxylic acids found in pectin, cellulose, and lignin, indicating the presence of "free" hydroxyl groups on the adsorbent surface [26]. The symmetric and asymmetric C-H stretching vibration of aliphatic acids is responsible for the peak at 2920 cm-1. The peak at 1616 cm-1 is caused by asymmetric stretching vibrations of C=O, while an aromatic compound group causes the peak at 1515 cm-1 [23]. However, in the TW mixture, distinct changes are not noted between the spectra before and after fluoride adsorption onto tea waste. This indicates that the main structures of both soil mixtures were not altered due to fluoride adsorption.

Figure 4: FTIR for TWL65 before and after fluoride adsorption.
Sorption properties of fluoride in tea waste under selected water types in the typical salinity/hardness range
Step 1: After adding tea waste to the fluoride non-adjusted groundwater samples, diverse fluoride removal behaviors were observed as shown in Figure 5a. Both the sorption and leaching behavior of fluoride by tea waste could be observed during the experiments. Favorable (positive) sorption efficiencies were interpreted as fluoride removal from the solution, whereas negative sorption efficiencies were interpreted as fluoride leaching into the solution.

Figure 5a: Variation of fluoride sorption efficiency with changes in initial fluoride concentration (mg L-1) of groundwater samples.
Step 2: Fluoride concentrations in collected groundwater samples were adjusted to align with fluoride levels in water in Sri Lanka from <0.01 mg/L to 8.00 mg/L [23], to further investigate the potential sorption behavior of tea waste in groundwater under low to high fluoride concentration range as the experimental procedure outlined in section 2.4 (step 02). According to the initial fluoride concentration of water samples, both the sorption and leaching behavior of fluoride by tea waste could be identified when tea waste was added to fluoride-adjusted and non-adjusted groundwater samples (Figure 5b). During the sorption studies, higher fluoride levels in water resulted in fluoride sorption, whereas lower fluoride levels in water resulted in fluoride leaching by tea waste. It was discovered that the behavior of fluoride sorption by tea waste varies depending on the fluoride concentration in the water. Similar sorption behavior was observed in tea leaves as mentioned in [27], which indicated that fluoride is easily released from tealeaves in low-fluoride water and tealeaves may release or absorb fluoride, depending on the fluoride content of water (Figures 5a and 5b).

Figure 5b: Variation of fluoride sorption efficiency with initial fluoride concentration (mg L-1) of adjusted groundwater samples.
It was discovered that the pH, EC, and TDS values of filtrates did not differ when compared to the initial pH, EC, and TDS values of fluoride-adjusted and non-adjusted groundwater samples (Table 3). The mean pH value of the filtrates was slightly lower than the maximum permissible pH level of the SLS drinking water quality standard in Sri Lanka, which is 6.5-8.5 [28]. According to drinking-water quality guidelines, the maximum allowable level of EC in drinking water is 1500, and all filtrates had EC values lower than that limit [3]. The TDS levels in effluent filtrates were lower than the maximum permissible TDS level in the Sri Lankan drinking water quality standard, which was 500 (Table 3) [27,28].
| Non-Adjusted groundwater samples | ||||||
|---|---|---|---|---|---|---|
| Initial pH (n=40) | Initial EC/ µ S/cm (n=40) | Initial TDS/ mgL-1(n=40) | Final Avg. pH (n=40) | Final Avg.EC/ µ S/cm(n=40) | final Avg. TDS/ mgL-1(n=40) | |
| Max | 6.2 | 0.46 | 328 | 6 | 0.45 | 330.6 |
| Min | 3.7 | 0.02 | 26 | 5.07 | 0.03 | 33.67 |
| Mean | 4.73 | 0.103 | 81.35 | 5.43 | 0.1 | 81.35 |
| Adjusted groundwater samples | ||||||
| Initial pH (n=40) | Initial EC/ µ S/cm(n=40) | Initial TDS/ mgL-1(n=40) | Final Avg. pH(n=40) | Final Avg. EC/ µ S/cm(n=40) | final Avg. TDS/ mgL-1(n=40) | |
| Max | 6.5 | 0.49 | 350 | 6.07 | 0.49 | 394.67 |
| Min | 4.4 | 0.02 | 30 | 0.04 | 0.03 | 37 |
| Mean | 4.99 | 0.12 | 92.51 | 5.23 | 0.127 | 97.24 |
Table 3. Variation of pH, EC, and TDS values of fluoride-adjusted non-adjusted groundwater samples before and after the sorption process.
Determination of the optimum mixing ratio of tea waste and laterite
The fluoride removal efficiency is the highest when TWL65 is used, including 65% of tea waste and 35% of laterite powder. The lowest removal efficiency was seen in TW100, which was made of 100% tea waste powder. As the highest removal efficiency (40.83 ± 1.607) % was recorded in TWL65 (65% of tea waste and 35% laterite powder), it was considered the optimum mixture and was used to carry out further studies (Table 4).
| Tea waste percentage/% | Remaining fluoride concentration/mg L-1 | Percentage removal efficiency/% | Adsorption capacity/ mg g-1 |
|---|---|---|---|
| 50 | 1.24 ± 0.075 | 40.33 ± 3.753 | 0.087 ± 0.004 |
| 55 | 1.44 ± 0.020 | 30.50 ± 1.000 | 0.072 ± 0.001 |
| 60 | 1.32 ± 0.154 | 34.50 ± 7.697 | 0.080 ± 0.008 |
| 65 | 1.23 ± 0.032 | 40.83 ± 1.607 | 0.769 ± 0.002 |
| 70 | 1.41 ± 0.174 | 32.00 ± 8.718 | 0.077 ± 0.009 |
| 75 | 1.68 ± 0.030 | 18.50 ± 1.500 | 0.043 ± 0.002 |
| 80 | 1.54 ± 0.026 | 25.50 ± 1.323 | 0.060 ± 0.001 |
| 90 | 1.62 ± 0.129 | 21.67 ± 6.449 | 0.049 ± 0.006 |
| 100 | 1.77 ± 0.096 | 14.00 ± 4.822 | 0.014 ± 0.005 |
Table 4. Results of optimum mixing ratio.
Batch experiments
Effect of dosage: When the adsorbent dose of tea waste increases, the percentage of removal will also increase, and the highest adsorption efficiency was achieved at 1.5 g with the removal efficiency of 40.77 ± 5.19% (Figure 6a). Further increase in adsorbent dosage beyond 1.5 g did not significantly affect the fluoride adsorption efficiency, and with further increase in adsorbent dose, the adsorption efficiency remained constant. Due to the increasing number of accessible active sites of the adsorbent, the removal efficiency is commonly increased by increasing the amount of adsorbent dose. The adsorption capacity, however, remains constant after a certain adsorbent dose (Figures 6a) [29].

Figure 6a: Variation of fluoride removal efficiency with changes in dosage for TWL65 mixture.
Effect of time: The effect of contact time on fluoride adsorption was studied in Figure 6b, with an initial fluoride concentration of 2 mg L-1, an adsorbent dose of 1.5 g, and an optimal initial pH of 6, the effect of contact time on fluoride adsorption potential of TWL65 was investigated. The adsorption potential of TWL65 for removing fluoride was found to be rapid in the early stages of contact time. The rate of adsorption decreases with time after 20 minutes, and the adsorption mechanism reaches equilibrium within 20 minutes. According to [29], this observation may be explained by a larger number of active sites on TWL65 for fluoride ion adsorption in the early stages (Figure 6b).

Figure 6b: Time-dependent variation in removal fluoride efficiency for TWL65.
Effect pH: The adsorption efficiency increased as the aqueous phase pH values increased from 2 to 11 (Figure 6c). Initially, the percentage of fluoride ions removed increased rapidly with the increasing pH of the solution, with pH 6 being the optimal pH. A further increase in pH results in a significant decrease in the adsorption percentage. This could be because of the electrostatic repulsion between the oppositely charged adsorbate and adsorbent (Figure 6c) [30].

Figure 6c: Variation of fluoride removal efficiency with changes in pH for TWL65 mixture.
Adsorption kinetic studies
The adsorption kinetics study determines the controlling step and mechanism of the adsorption process. The correlation coefficient value (R2) for the pseudo-second-order model is 0.9950, which is greater than those obtained from the pseudo-first-order model. The reason for the lower R2 for the pseudo-first-order model is that the equilibrium time for a kinetic experiment is insufficient for a bio sorbent since equilibrium takes longer. The plot of t/qt against t gives a linear relationship and suggests the fitness of the Pseudo-second-order model kinetics with the adsorption mechanism. Following the Pseudo-second-order model, kinetics proposes that the adsorption process is governed by chemisorption. The sharing or exchanging of electrons between adsorbent and adsorbate is a rate-limiting step in the Pseudo-second-order model (Table 5) [31].
3| t/min | qe/mg g-1 | qt/mg g-1 | ln (qe-qt) | t/qt | t1/2 |
|---|---|---|---|---|---|
| 5 | 0.021667 | 0.02165 | -11.5129 | 230.9469 | 2.24 |
| 10 | 0.021667 | 0.021 | -7.3232 | 476.1905 | 3.16 |
| 15 | 0.021667 | 0.02155 | -9.115 | 696.0557 | 3.87 |
| 20 | 0.021667 | 0.02111 | -7.5055 | 947.4183 | 4.47 |
| 30 | 0.021667 | 0.01733 | -5.4421 | 1731.102 | 5.48 |
| 60 | 0.021667 | 0.01713 | -5.397 | 3502.627 | 7.75 |
Table 5. Results used for kinetic studies.
| Kinetic model | Parameter | Value |
|---|---|---|
| Pseudo first order | R2 | 0.465 |
| - | K1 (min-1) | 0.0015 |
| - | qe (cal) (mg g-1) | 0.0216 |
| - | qe (exp) (mg g-1) | 5.65×10⁻⁵ |
| Pseudo second order | R2 | 0.995 |
| - | K2 (g mg-1 min-1) | 24.136 |
| - | qe (cal) (mg g-1) | 0.0216 |
| - | qe (exp) (mg g-1) | 0.0164 |
Table 6. Kinetic parameters of fluoride adsorption by TWL65.
The qcal values calculated from the pseudo-second-order model is 0.0216 mg g−1 which is close to the experimental values qexp value 0.0164 mg·g−1 than the pseudo-first-order model. These findings validated the pseudo-secondorder kinetic model's applicability indicating chemical reactions of valence electron forces between adsorbents and adsorbents were likely involved, which determined the rate of reaction (Figure 7) [32].

Figure 7: Effect of competing anions on the adsorption capacity of TWL65 for fluoride adsorption.

Adsorption isotherms studies for TWL65
To investigate the interaction of fluoride with the surface of TWL65, adsorption isotherms were plotted and investigated. The Langmuir isotherm model in Table 6 has a higher R2 value (0.92529) compared to the Freundlich isotherm model in Table 6 value of R2-0.88853 and the Temkin isotherm model (Figure 8c) value of R2 - 0.77121. The adsorption of fluoride data was well represented in the Langmuir model, which indicates that the adsorption mechanism follows the monolayer adsorption behavior [19]. The adsorbent has active sites with uniform energy on the surface of the adsorbent. The best fit model for TWL65 was the Langmuir adsorption isotherm model based on the linear regression coefficient (Table 6 and Figures 8a-8c).

Figure 8: Fluoride concentration variation with feeding volume of influent solution (1.5 ppm) (a): Fluoride concentration variation with feeding volume of influent solution (2.0 ppm) (b and c): Fluoride concentration variation with feeding volume of influent solution (2.5 ppm).
Effect of competing ions
It was found that the removal efficiency of TWL65 towards fluoride was reduced due to the presence of co-existing (phosphate, nitrate, and sulfate) in the water. Nitrate and sulfate have nearly identical effects on fluoride adsorption, which showed removal efficiency ranging between 27.77 ± 0.555% to 48.23 ± 7.692% in the presence of nitrate and between 33.33 ± 3.469% to 42.40 ± 0.320% in the presence of sulfate. Phosphate ions have shown maximum effects on the adsorption of fluoride, and the removal efficiency varied between 0.555 ± 0.555 to 44.31 ± 3.239% (Figure 7). The decrease in fluoride removal in the presence of phosphate could be attributed to the adsorbent's high affinity for carbonate and phosphate ions and their competition for active binding sites with fluoride [33].
The fluoride removal efficiency decreased as the concentration of the competing ion increased. It could be explained by the fact that in multi-element solutions, the electrostatic interaction of co-existing anions with adsorption sites of TWL65 mixture was much stronger than the electrostatic interaction of fluoride ions species (Figure 7).
Effluent fluoride concentration variations with feeding volume and fluoride removal efficiencies under 1.5 ppm, 2.0 ppm, and 2.5 ppm influent fluoride concentrations
Fluoride concentrations in the effluent dropped as the feeding volume increased, and fluoride removal efficiency increased gradually in the initial stage of the filtering process in all fluoride removal set-ups with 1.5 ppm, 2.0 ppm, and 2.5 ppm influent fluoride concentrations as shown in Figure 8a . When feeding more volume, the effluent fluoride concentration decreased, than the initial stage of the filtering process. Similar fluoride removal trends were observed in the study conducted on the development of activated iron oxide soil pellets to study the filtering efficiency of fluoride ions in aqueous fluoride solutions [2]. However, when more volume is added, time passes and the available sites are decreased, while the effluent fluoride concentration increased. In all three setups with different influent fluoride concentrations, fluoride removal efficiencies were found to be closer or lower than the WHO drinking water quality standards level for fluoride of 1.5 ppm [3] and Sri Lankan drinking water standards level for fluoride of 1 ppm. When the feeding volume was increased, the pH values in the filtrates varied, but the pH values did not differ significantly from the initial values of the influent solutions in all three fluoride removal setups.
The mean pH values of the filtrates were lower than the maximum permissible pH level of the drinking water quality standard in Sri Lanka, which is 6.5-8.5 (Table 7 and Figure 8a) [28].
| Influent (Fl -) concentrations | ||||
|---|---|---|---|---|
| 1.5 ppm | 2.0 ppm | 2.5 ppm | ||
| No | Feeding Volume (ml) | pH | pH | pH |
| 1 | 60 | 6 | 6 | 5.8 |
| 2 | 60 | 5.9 | 5.9 | 5.6 |
| 3 | 60 | 6 | 6.3 | 5.8 |
| 4 | 60 | 6 | 6.3 | 6 |
| 5 | 60 | 6.1 | 6.2 | 6.2 |
| 6 | 60 | 6.1 | 5.6 | 6.1 |
| 7 | 60 | 6.2 | 6.3 | 5.9 |
| 8 | 60 | 6.1 | 6 | 5.8 |
| 9 | 60 | 6.2 | 6.4 | 5.8 |
| 10 | 60 | 6.2 | 6.4 | 5.6 |
| 11 | 60 | 6.1 | 6.5 | 5.5 |
| 12 | 60 | 6.2 | 6.5 | 6 |
| 13 | 60 | 5.9 | 6.5 | 5.9 |
| 14 | 60 | 6 | 6.5 | 5.8 |
| 15 | 60 | 6.2 | 6.2 | 5.4 |
| 16 | 60 | 6.3 | 6.5 | 5.5 |
| 17 | 60 | 6.1 | 6.2 | 5.5 |
| 18 | 60 | 6.5 | 5.9 | 5.4 |
| 19 | 60 | 6.4 | 6.5 | 5.7 |
| 20 | 60 | 6.4 | 6.2 | 5.2 |
| 21 | 60 | 6.3 | 6.5 | 6.2 |
| - | Max | 6.5 | 5.6 | 5.2 |
| - | Min | 5.9 | 6.25 | 5.73 |
| - | Mean | 6.15 | 6.15 | 6.15 |
Table 7. pH variation of effluent with feeding volume of influent solutions (1.5 ppm, 2.00 ppm and 2.5 ppm).
The study was planned to investigate the sorption behavior of tea waste with dominant harmful fluoride concentrations and finally, a novel adsorbent was introduced by amending laterite to tea waste. The initial sorption behavior of tea waste with different fluoride levels in groundwater concluded that fluoride leaches from tea waste with lower fluoride levels in the water, while tea waste absorbs fluoride from high fluoride in water. Thus, it is vital to examine the chemical kinetics of fluoride adsorption by tea waste with the necessary amendments to reduce possible desorption for the effective use of tea waste. In this experiment, laterite powder was discovered to be a suitable amendment. As a result, the material can be used to remove fluoride from water while maintaining the normal pH of potable groundwater. In batch experiments, fluoride removal was highest around pH6, whereas the influent fluoride solution at pH6 produced better filtering performances in fluoride removal experiments using a simple fluoride removal setup. The addition of laterite to tea waste inhibited fluoride leaching from tea waste into the water. Therefore, tea waste and laterite mixture can be introduced as an eco-friendly adsorbent for removing fluoride from water and for further possible application for the effective use of tea waste.
We extend our gratitude to the Department of Forestry and Environmental Sciences staff for granting support. Our special thanks to the Central Instrumental Centre, Faculty of Applied Science University of Sri Jayewardenepura (USJP), Sri Lanka. This study was conducted under the AHEAD ICE grant.
Funding
This study was funded by the AHEAD ICE grant.
Conflicts of interest/Competing interests
I confirm that all manuscript authors have no conflict of interest to declare.
Availability of data and material
The authors declare that all necessary data supporting the findings of this study are available within the article. If additional data supporting this study's findings are required, they can be made available from the corresponding author upon reasonable request.
Ethical Approval
(Not applicable, as this study is entirely based on laboratory experiments, with no human or animal trials involved.)
Authors' contributions
Corresponding author, laboratory experiments and research paper writing were done by Ms.A.V.P.S.Buddhima.Dr.Daham Jayawardana, senior lecturer, supervised the research. Mrs. N.U.S. Dissanayake and Mr. P.L.Herath were engaged in conducting laboratory experiments. Mr.B.M.Gunathilake worked on drawing figures and providing technical assistance.
[Crossref] [Google Scholar] [PubMed]