Research & Reviews: Journal of Ecology and Environmental Sciences
ISSN: 2347-7830
ISSN: 2347-7830
Department of Natural Resource, Mizan Teferi Atvet College, Ethiopia
Received Date: 03/11/2017; Accepted Date: 13/12/2017; Published Date: 20/12/2017
Visit for more related articles at Research & Reviews: Journal of Ecology and Environmental Sciences
Land use/land cover change (LULCC) analysis is the major important information required for planning and decision making. However, up to date information on drivers of LULCC in Guraferda district is found to be lacking. Therefore, this study was conducted to identify types as well as extent of LULCC within three decades and its drivers in the district. Information was extracted from three periods of Landsat imagery (1984 /ETM/, 2001/ETM+/, and 2015/OLI/ image) for LULCC analysis. Socio-economic data were collected through household survey, key informant interviews, and group discussions. Analysis of data was accomplished through the use of ERDAS imagine (version 9.1), ArcGIS (version 10.1), and SPSS (version 20) along with Microsoft Excel software. For 1984 and 2001 landsat images, four LULC classes namely shrub/bush land, grass land, natural forest, and agricultural land/settlement while one additional LULC class (plantation coffee) were identified for 2015 LULCC analysis. Results from LULCC analysis showed a significant transformation of LULC classes for the respective years. In 1984, grassland, shrub/bush land, and natural forest covered 30.4%, 33.8%, and 35.2% of the total area (2565.42km2), respectively. However, agricultural land/settlement shared 0.6% of the district area at the same time. In 2001, natural forest declined to 29.86%, whereas grassland, shrub/bush land, and agricultural land/settlement increased to 31.61%, 37.14%, and 1.39%, respectively. After three decades, in 2015, agricultural land/settlement increased to 18.35% of the area while grass land, shrub/bush land, and natural forest decreased to 27.37%, 18.11%, and 25.76% of the district total area, respectively. At the same time new land use type (plantation coffee) have emerged and increased to10.41% of the district area. Findings of this study showed the existence of LULCC with a significant expansion of agricultural land/settlement and plantation coffee while decreasing trends of shrub/bush land, grass land, and natural forest. Resettlement, agricultural investment, government policies, poor governances within the district, subsistence agricultural land expansion, fuel wood collection, wood extraction for house construction, wildfire, and land certification problems were identified as a driver of those LULCC in the district. Thus, the study concluded the interaction of proximate and underlying causes forced the district to LULCC.
Deforestation, Agriculture, Sustainable, Wildfire, Grassland
One of the most significant global challenges in this century relates to managing the transformation of the earth’s surface occurring through changes in land use and land cover (LULC) [1]. It is one of the most important drivers of global change and affects many parts of human environment systems. Land use and land cover dynamics are widespread, accelerating, and significant processes driven by human actions but also producing changes that impact humans [2,3]. Changes in the condition and composition of the land cover affects climate changes in biogeochemical cycles and energy fluxes and affect thereby livelihoods [4,5]. The driving forces of LULCC are generally subdivided into two groups: proximate causes and underlying causes. Land use is constantly changing in response to the dynamic interaction between underlying drivers and proximate causes [6]. Proximate causes are the activities and actions of local people that directly affect land use in order to fulfill their needs from the use of the land. However, underlying causes are often external and beyond the control of local communities and are fundamental socio-economic and political processes that push proximate causes into immediate action on land use/ land cover including demographic, economic, technological, institutional and cultural factors [7]. The South West part of Ethiopia is a region in the country that contains one of the counties remaining moist Afromontane forest. Particularly, Sheka, Kafa and Bench-Maji Zones are known for their natural forests with 60, 20 and 15% of forest cover, respectively [8]. However, the forest covers in the region at the current situation are declining both in quality and quantity at a faster rate in this decade than ever before [9]. Guraferda is one of Benchi Maji districts which falls under a high rate of land use/land cover change due to resettlement (both in Derg and EPRDF regime) agricultural land expansion, and large scale plantation of coffee (Coffea arabica )at the expense of the natural forest (Guraferda district land administration office, November 13, 2015) [10]. Therefore, this study aims to assess types and extent of land use/land cover changes and identify major drivers of land use/land cover change in Guraferda district for the last three decades.
Description of the Study Site
Guraferda is found in southwestern part of Ethiopia, in the Bench Maji Zone of the Southern Nations Nationalities and Peoples Regional (SNNPR) government at about 630 km southwest of Addis Ababa. It is located between 34°55’59” to 35°26’13” E (Latitude) and 6°29’5” to 7°13’20” N (Longitude) (Figure 1). It is bordered on the south by Bero district, on the west and north by the Gambela Region, on the northeast by Sheko, on the east by South Bench, and on the southeast by Menit Shasha. An estimated area of Guraferda district is about 2565.42 km2. In Guraferda district there are 27 kebeles with administrative town of Biftu. Some of these kebeles are newly emerged by splitting larger kebeles due to population growth. The largest part of the district is not administered as a kebele, but is governmental territory. This means that this land is (officially) not allotted to farmers. This governmental territory is mostly either forest/savannah/shrub bush land or rented to investors who cultivate shaded coffee, rubber, rice, and fruits [11]. The soil of the area is mostly fertile nitosols [12] . According to Hildebrand in southwest Ethiopia the massif above 2000 m has stony and rocky surfaces while between 1500 and 2000 m, somewhat stony and the soil textural class is loam to clay [13]. The topography of Guraferda district is highly variable. A number of hills and mountains characterize the landform of the area.

Figure 1: Location map of the study area.
The famous once among others are the Susuka mountian bordering the Gambela National Regional State and Ambesa mountian to north. The elevation ranges of the district lays between 559 and 2389 meter above sea level. Agro-climatic zones of Guraferda are low land (Moist Qolla) and medium (Woynadega), which constitute 78.25% and 21.75% respectively, of the total area of the district. The annual rainfall of Guraferda district varies from 1601- 2000 mm whereas the mean annual rain fall is about 1332 mm. The mean annual minimum and maximum temperature of the area ranges between 20°C and 29°C, respectively. The main rainy season, Meher, is considered as important for rain-fed agriculture in the area. The broad-leaved deciduous woodlands are found in the northwestern, western parts and the southwest along the Ethio-sudan boundary between 500-1900m.a.s.l. The vegetation is characterized by Combretum spp., Oxytenanthera abyssinica (A.Rich.) Munro, Boswellia papyrifera, Lannea schimperi, Anogeisus leiocarpus, and Stereospermim kunthianumcham, where the under-storey vegetation is constituted of a combination of herbs and grasses [14]. According to the finance and economy office of Guraferda, the population of Guraferda district was 45,028 in 2015 (Guraferda district finance and economy office, November 13, 2015). Since 1984, people from other parts of the country, mainly from North Shoa, Gondar, and Wollo have massively migrated in to the area seeking for farmlands as government organized and spontaneous resettlement program. As a result, it became home for a multitude and diverse population. Before the 1980s resettlement of the Derg, the district comprises only three ethnic groups namely Mejengir, Sheko and Me’enit. Start ing from 2002, government sponsored resettlers mainly from northern and southern parts of the country have also entered into the district. Now, the district has become the place of multiple ethnic and inguistic groups. As a result, the district has become a home for several ethnic groups namely Amhara, Sidama, Wolayta, Kambata, Guragie, Hadiya, Bench, Gedeo, few Oromo and others Abeje, et al. Like the economy of the Zone, Guraferda is predominantly plough-based agriculture dominantly of cash crops, like coffee and rice. The first three major products of the district are coffee, rice, maize, and sorghum. Besides crop production, farmers of the district rear livestock.
Sampling Design
Data source
For the purpose of this research both primary and secondary data were used. Primary data were obtained through field survey, GPS measurement, group discussions, and key informant interviews around the study area, whereas secondary data used includes; Satellite image, Digital Topographical Map on shape files of scale 1:50,000, relevant publications such as books, journals, articles, and other data from district land administration offices, and censuses results. Satellite images of 1984, 2001, and 2015 were used for this study (Table 1). Images from the year 1984 were taken due it was the earlier available images for the study area. On the other hand, government-organized resettlement program during the Derg regime has taken place at about the end of 1984.Similarly, images from the year 2001 selected as resettlement program organized by the current EPRDF government was implemented starting from 2002. Therefore, it can be assumed that these years indicate important points in the dynamics of LULCC in the area. Accordingly, satellite images that captured in the months of December to January were taken. This time is selected to acquired satellite images due to the atmosphere is cloud free during December to February as a result satellite images can be cloud free for land use/land cover interpretation.
Table 1. Time series satellite images used for this study.
| Year | Path/row | Date of acquisition* | Sensor | Resolution | Producer |
|---|---|---|---|---|---|
| 1984 | 170/055 170/056 171/055 |
12/28/1984 01/12/1984 01/04/1984 |
TM | 30 × 30 | GLCF |
| 2001 | 170/055 170/056 171/055 |
01/04/2001 12/22/2001 01/17/2001 |
ETM+ | 30 × 30 | USGS |
| 2015 | 170/055 170/056 171/055 |
01/03/2015 01/03/2015 12/26/2015 |
OLI | 30 × 30 | USGS |
Bio-Physical and Socioeconomic Data Collection
For this study six kebeles were purposively selected from three strata (two kebele from each stratum) stratifying as resettlers from northern parts of the country, resettlers from different zones of SNNPR, and areas under native people by considering deforestation rate and land use conversion for collecting the required bio-physical data. Stratification by ethnic group was undertaken as a result of the livelihood activities, land use patterns, and therefore the land management strategies of people from these different regions are expected to show distinct characteristics. Accordingly, the extent, type, and pattern of LULCC may vary among respective areas settled by these groups. As a result, a good representation of the dynamics in LULCC in the area can be captured by identifying areas dominantly settled by each group and stratifying during the sampling process. The required bio-physical and socioeconomic data was first collected through detailed socioeconomic assessment which was conducted by different tools such as Group Discussion (GD), Household Survey, Key Informant Interview (KII), and Field Observation. Selection of households to be interviewed was undertaken through random sampling technique. A sample of 140 households were selected from the total household of the sample kebeles (from 2740 households) based on Cochran’s (1977) sample size determination equation and by adding some households to increase accuracy.
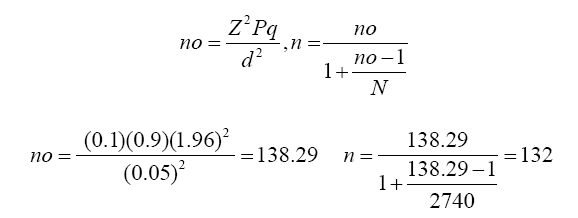
Where no=the desired sample size Cochran’s (1977), when population is greater than 10000; n=number of sample size when population is less than10, 000; Z=95% confidence limit i.e. 1.96; P=0.1 (proportion of population to be included in the sample i.e. 10%); q=1-P i.e. (0.9);N=total number of population; d=Precision or degree of accuracy desired (0.05).
Allowing for data loss for various reasons, the total sample size was increased to 140 households. Numbers of sample households for each sample kebeles were determined proportionally among the total sample households of the six kebeles. Based on the data obtained from Guraferda district land administration office on November 13, 2015, total households of the six kebeles were 2740. Total households and number of households selected is shown below in Table 2. The survey was conducted through direct interview with household members using structured and semi-structured questionnaire. Before conducting the formal questionnaire survey, questionnaires were pre-tested using 20 households not included in the sample and some necessary modifications were made for the questionnaires. Interview was conducted with family heads and in absence of a family head; it was made with appropriate representative and knowledgeable member of the household.
Table 2. Household and respondents’ number for each selected kebeles.
| No | Kebeles | Selected households | Total | ||||
|---|---|---|---|---|---|---|---|
| No of totalhh | Native | Southern resettler |
Northern resettler |
In number | In % | ||
| 1 | Gabika | 568 | 2 | 24 | 3 | 29 | 20.45 |
| 2 | Gelit (kutiramist) | 409 | 6 | 14 | 1 | 21 | 15.15 |
| 3 | Alenga | 555 | 5 | 3 | 20 | 28 | 20.45 |
| 4 | Kuja | 339 | 2 | - | 15 | 17 | 12.12 |
| 5 | Otuwa | 602 | 24 | 3 | 4 | 31 | 21.98 |
| 6 | Malagonac | 267 | 14 | - | - | 14 | 9.85 |
| Total | 2740 | 53 | 44 | 43 | 140 | 100 | |
Data Analysis
Software and tools used in the study
Geographical positioning system (GPS), ERDAS Imagine 9.1, ArcView GIS 10.1, and SPSS (statistical software for social science, IBM Statistical 20).
LULC classification
Satellite imageries of 1984, 2001, and 2015 were downloaded from USGS and GLCF. Multi temporal raw satellite image data were imported to Erdas Imagine 9.1 image processing software. Then, these images were layer stacked, georefernced to their corresponding latitude and longitude by using a georefernced digital map of the study area, and projected to WGS 1984_ UTM_ zone _37North. Different image mosaicking, subseting, radiometric enhancement (histogram equalization, haze reduction, noise reduction and normalization) techniques were applied on the raw TM, ETM+, and OLI Landsat images. The scene difference problems of different sensors satellite images removed by using normalization techniques of radiometric correction. Then unsupervised and supervised classification methods were applied on Erdas imagines 9.1.
Accuracy assessment
Error matrices were designed to assess the quality of the classification accuracy. The Kappa coefficient was also used to assess the classification accuracy. The overall accuracy and Kappa statistics calculated by using formula as follows [15].
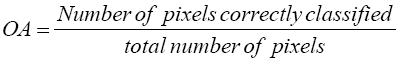
Where, OA=overall accuracy; Diagonals in error matrixes table represent sites classified correctly according to reference data while Off-diagonals are misclassified.
Kappa (K ˆ): It reflects the difference between actual agreement and the agreement expected by chance and estimated as:
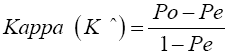
Where, Po=proportion of correctly classified pixels and determined by diagonal in error matrix; Pe=proportion of correctly classified pixels expected by chance and incorporates off-diagonal.
Accordingly, overall accuracy for the three years land use/ land cover classification of this study was 89.81%, 89.72%, and 88.62% for the respective years of 1984, 2001, and 2015 with kappa coefficient or statistics of 0.86, 0.85, and 0.85. Due to these values are within allowable range further analyses undertook.
Change detection
To examine the land use/land cover change detection and the rate of its changes, post classification comparison change detection method was employed. This kind of change detection method identifies where and how much change has occurred. Additionally, change detection matrix had been generated to assess trends and patterns of land use/land cover change. The rate of land use/land cover change computed using Puyravaud (2003) equation:
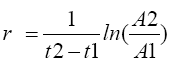
Where r is percentage of land use change per year and A1 and A2 are the amount of land use type at time t1 and t2, respectively.
Bio-physical and socioeconomic data analysis
The statistical data were coded, rearranged, summarized, and entered for analyses using SPSS version 20 and Microsoft excel 10. Descriptive statistics like; percentage and frequencies were analyzed and presented in the form of tables. For those parameters that required ranking (drivers of land use/land cover change) Index of Relative Ranking (IRR) were calculated (Figure 2) [16].

Figure 2: Flow chart of research methods applied.
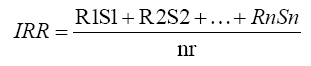
Where, IRR=Index of Relative Ranking; R1=rank of first order (No. of observation on first order); S1=score of highest rank; Rn=rank of last order (No. of observation on last order); Sn=score of lowest rank (1); n=Number of observation; r=total rank given to particular attribute.
Land Use/Land Cover Change of the Study Area Within the Period 1984 -2015
For a clear and informative comparison of the land use/land cover change, area value for the periods of 1984, 2001 and 2015 are summarized in Table 3. More of grass land, shrub/bush land, and Natural forest cover existed in 1984 and 2001 maps but were reduced in 2015. The latter map (Figure 3) LULCC map of 2015 showed wide spread agricultural land and newly emerged plantation coffee land cover that increased considerably in the expenses of natural forest, shrub/bush land, and grass land.
Table 3. Comparison of area under different land use/ land covers type during 1984, 2001 and 2015.
| 1984 | 2001 | 2015 | ||||
|---|---|---|---|---|---|---|
| LULC class | area (ha) | area in % | area (ha) | area in % | area (ha) | area in % |
| Grass land | 78031.5 | 30.4 | 81119.0 | 31.61 | 70240.3 | 27.37 |
| Bush/ shrub land | 86824.7 | 33.8 | 95313.5 | 37.14 | 46454.0 | 18.11 |
| Natural forest | 90172.0 | 35.2 | 76605.5 | 29.86 | 66091.4 | 25.76 |
| Plantation Coffee | - | - | - | - | 26681.3 | 10.41 |
| Agricultural land/settlement | 1513.5 | 0.60 | 35.04 | 1.39 | 47075.0 | 18.35 |
| Total | 256542.0 | 100 | 256542.0 | 100 | 256542.0 | 100 |

Figure 3: Land use/ land cover map of Guraferda district in 1984, 2001, and 2015.
In 1984 map, natural forest found around central, north eastern and western parts of the district covering 35.2%. Bush/ shrub land and grass land were the second and third land cover distributing in all parts of the district. Very limited agricultural lands found mostly in the Middle Eastern tips accounted 1513.51 ha (0.6%). On the 2001 LULC map, Shrub/ bush land predominated covering 37.14% of the district followed by grass land with 31.61% area coverage. Natural forest, which dominated around central, north eastern and western parts of the district with high disturbances in the agricultural land boundaries covered 29.86% and agricultural land/settlement shown an increment concentrated around Biftu, Alenga, and Ojemita kebeles. In the LULC map of 2015, grass land shared the largest district areas but with decreasing trend in area covering 27.37%, followed by natural forest with 25.76%, Bush/shrub land 18.11%, agricultural land/settlement 18.35%, and plantation Coffee 10.41% of the district total area. In addition to remote sensing result, key informants and group discussion participants reported that very large land covered with dense natural forests, shrub/bush lands, and grasslands in the past were converting to agricultural land/resettlement and commercial farm land. Also most respondents stated that some years back majority of the study area was covered by dense forest and grassland whereas today it has declined at an alarming rate. This finding in line with the study conducted by Gete and Hurni in Northwestern Ethiopia a drop in natural forest cover from 27% to 0.3% (for the period 1957-1995) while cultivated land increased from 39% in 1957 to 70% in 1982 and 77% in 1995. Similarly Gessesse and Kleman revealed that natural forest was declined from 16 to 2.8% between the periods of 1972 to 2000 and conversely cultivated land was increased by 82% between the periods of 1972 to 2000 in the South central rift valley of Ethiopia.
Rate of Land Use/Land Cover Change
Between 1984 and 2001, as shown in Table 4 there was an increment in grass land, shrub/bush land, and agricultural land/settlement while natural forest declined in the study area. Within this period interval, agricultural land/settlement increased at the higher rate (4.94%/year) whereas natural forest showed a higher negative rate of change (-0.96%/year). In the second phase(2001 to 2015); grass land and shrub/bush land showed a reversed trend from the first phase (1984 to 2001).The rate of decrement for shrub/bush land accounted the higher negative value (-5.13%/year). In the meantime, agricultural land/settlement showed a higher rate of increment. Within this year interval plantation coffee land use/ land cover system emerged and increased at a rate of 7.14%/year.
Table 4. Rate of land cover conversion “+” Sign shows increment, “- “sign shows decrement”.
| Land cover type | Year interval | |||||
|---|---|---|---|---|---|---|
| 1984-2001 | 2001-2015 | 1984-2015 | ||||
| (rate ha/year) | (rate %/year) | (rate ha/year | (rate %/year | (rate ha/year) | (rate %/year) | |
| Grass land | 181.6 | 0.23 | -777.1 | -1.03 | -251.3 | -0.34 |
| Shrub/bush land | 499.3 | 0.55 | -3489.9 | -5.13 | -1302.3 | -2.02 |
| Natural forest | -798 | -0.96 | -751 | -1.05 | -776.8 | -1 |
| Plantation Coffee | 0 | 0 | 1905.8 | 7.14 | 860.7 | 3.23 |
| Agricultural land/settlement | +117.1 | +4.94 | +3112.2 | +18.56 | +1469.7 | +11.09 |
Generally, grassland and shrub/bush land showed fluctuation whereas natural forest decreased throughout the study period (1984 to 2015). Within those 31 years, natural forest showed the higher decrement next to shrub/bush land in Table 4. Contrary to natural forest, agricultural land/settlement expanded from the beginning to the end at the higher positive rate (11.09%/year). Similarly, the newly emerged land use system (plantation coffee) showed the higher rate of increment (3.23%/year). As a result, the land use and land cover changes that detected in the study area revealed the greater areas of grassland, shrub/bush land and natural forest transformation into agricultural land/settlement and plantation coffee. In the study period, the class of agricultural land/settlement was highly escalated from 1984 to 2015 that shows forced conversion of the larger part of grass land and shrub bush land to agricultural land/settlement which were constantly increased in all land use/land cover analysis. In this regard, human activities are taken basically in to consideration for the expansion of huge agricultural lands through unplanned expansion of agricultural land/settlement for the spontaneously increased population.
Overview About Drivers of Land Use/Land Cover Change In the Study Site
According to the survey result and field observation a multiple drivers contributed to land cover change in the study area. Similar to the remote sensing data results, survey results were shown that forest cover, grass land, and shrub/bush land were decreased. Findings of this study showed, the main drivers of land use/land cover changes in the study area were resettlement, annual and perennial crop investment, wildfire, and fuel wood. House construction and farm implementing material collection, poor governances, and land tenure system of the farming community also had a great impact on the land cover change according to Key informants and group discussions result.
Although these were drivers of land use/ land cover change in the district, their extents were different from kebele to kebele. As shown in Table 5, at Gabika, Alenga and Gelit; 89.6%, 89.3%, and 81% percent of respondents were put resettlement as a first cause for land use/land cover change respectively. On the other hand, respondents of Kuja, Otuwa and Malagonac gave priority for annual and perennial crop investors with 64.7%, 77.4% and 100% respectively as land use/ land cover change agent. The reason why they differed significantly was that at Gabika there was no investor, then also at Gelit and Alenga investors given land in 2014/2015 that had not been start their investment. On the other hand, at Malagonac respondents were put investors 100% as the first driver of land use change due to there were no resettlement within their kebele.
Table 5. Respondent’s response as major causes of land use/ land cover change in their kebele.
| Resettlement | Agricultural Investment | Wildfire | |||||
|---|---|---|---|---|---|---|---|
| Ethnicity | Kebeles | Frequency | % | Frequency | % | Frequency | % |
| Southern resettlers | Gabika | 26 | 89.6 | 0 | 0 | 3 | 10.4 |
| Gelit | 17 | 81 | 4 | 19 | 0 | 0 | |
| Northern resettlers | Alenga | 25 | 89.3 | 3 | 10.7 | 0 | 0 |
| Kuja | 6 | 35.3 | 11 | 64.7 | 0 | 0 | |
| Natives | Otuwa | 6 | 19.4 | 24 | 77.4 | 1 | 3.2 |
| Malagonac | 0 | 0 | 14 | 100 | 0 | 0 | |
Proximate (Direct) Causes of Land Use/Land Cover Change
Agricultural investment
During this research work in Guraferda district there were 34 investors who were engaged in different agricultural investment especially on coffee and spice, annual crop production, and rubber tree plantation. Among those, 21 of them were coffee and spices investors with an area of 20365 hectares of land. Others included: nine annual crop investors’ with 4095 hectares of land, and three integrated agriculture investors with a land of 5637.22hectare (source, Guraferda district land administration office, November, 2015). These investors had been used shrub/bush land, natural forest, and grass lands for investment. In-flow of investor has being still increased from time to time. Among those 34, 6 investors have been entered in 2014/15 into different kebeles of the district.
Similarly, the aggregate results of respondents put investment as a major driver of land use/ land cover change next to resettlement with index of relative ranking 0.3 (Table 6). Particularly in kebeles like Malagonac, the sole land use/land cover change agent according to the respondents is perennial crop investors. Investment at Malagonac leads land use change in two ways. The first one is directly by changing the forest land in to coffee forest. On the other hand, natives were basing their livelihoods by NTFPs mainly beekeeping and forest tubers. But, after investors taken up the forest, they were forced to shape their economic activities into intensive annual crop production like maize and sorgum.
Table 6. Index of relative ranking for the major causes of LULCC as a whole studied kebeles.
| Derivers of LU/LC change | Sum of scores | IRR | Rank |
|---|---|---|---|
| Resettlement | 485 | 0.346 | 1 |
| Agricultural investment | 420 | 0.300 | 2 |
| wildfire | 260 | 0.186 | 3 |
| fuel wood | 235 | 0.168 | 4 |
Note: *n=140, r=10
Fuel wood collection
As any other developing countries, farming communities in Guraferda district have used fuel wood as sources of energy. Although majority of the farming communities uses trees on their farm land as energy sources presently, people around the forest have use natural forest for household energy consumption. Survey results of this study show that 24.3% of the respondent uses natural forest as energy sources. On the other hand, for those agroforestry tree energy users (75.7%) for household energy consumption, trees on their farm land were not planted by them rather it was the remnant of trees and shrubs during changing of shrub/bush land and natural forest to cultivated land and settlement. The result of index of relative ranking of the study area according to respondents answer shown in Table 6 firewood collection was the third major driver of deforestation that change forest land and shrub land cover in the area. Hence, an increasing demand of fuel wood within and outside the study area has resulted land use/land cover change in the study area. Meseret (2009) found similar results at Adaba-Dodola forest priority area, Ethiopia who stated that firewood and charcoal productions are major causes of forest cover change.
Wood for house construction and farm implementation
Demand of house construction and farm implementing materials from forest has been causing forest and shrub/bush land cover change in the study area. According to local communities responses, major forest disturbance were started during resettlement mainly for resettlers house construction. After they settled, they cut farm implementing materials, and also renewed their house by cutting forest trees. About 90.7% of the respondent stated that forest products for farm implementing and house construction were their important NTFPs and decreased due to deforestation and selective cutting of these products [17].
Wildfire
Forest fire in Guraferda district is a common phenomenon. Particularly around Shupi and Kuja grass and shrub/bush land, fire starting from December to May is common every year due to Surma tribes. As key informants and group discussion participants at Gabika and Kuja kebeles said, Surma tribes usually burn the grass and shrub/bush land to make a pass way for going to resettlement sites. In Surma tribe, to marry a lady, a youngster should give a lot of cattle for the female family in the form of bride price. For that reason Surma raiders come to resettlement site either on grazing place or within a house and they raid cattle in a massive way. As one of the respondent said, Surma tribes had taken 23 oxen at the common grazing place of Kuja kebele in February 2014/15. To do such activities, they opened the way by using fire. This is the main reason for wildfire incidences in Guraferda district. According to key informants and groups discussions, the other thing causing forest fires is that people living around shrubs and bushes clear the land for cultivation by using fire. Especially during resettlement times, shrub/ bush lands and grass lands were cleared for settlement and cultivation land by burning. The same to group discussion and key informant interview, the result of Index of relative ranking of respondents in the study area set apart wildfire as the third land use/land cover change agent next to resettlement/agricultural land expansion and investment with IRR value of 0.186 in Table 6.
Underlying (Indirect) Causes of Land Use/Land Cover Change
Resettlement
In-flow of resettlers from different parts of the country was the major drivers of land use/ land cover change in Guraferda district. The results of index of relative ranking of the respondents for drivers of land use/land cover change put resettlement as the first cause Table 6. According to the respondents’ responses, resettlement changes the land use/land cover of the district for agricultural land expansion, for house hold material consumption, for house construction, for settlement, and for fuel wood. Resettlement as a formal in-flow to the district was started during Derg regime in 1984. As shown in Table 7 shown population of the district in 1984 were 149 which were not strictly comparable to the population of 2015. During 2003/4 legal resettlement of the EPRDF, grass lands and shrub/bush lands were burnt with fire for settlement while a massive deforestation of natural forest were accompanied for house construction of resettlers. This study in lines with (Dejene, 2011) he gotten that “resettlers fired on the forest to protect themselves from wild animals and bees’ bites through the process they cut the trees and converted to farm land”.
Table 7. Population of different years at Guraferda district.
| Sex | Year | ||
|---|---|---|---|
| 1984 | 2007 | 2015 | |
| Male | 90 | 19,405 | 22,064 |
| Female | 59 | 15,859 | 22,964 |
| Total | 149 | 35,264 | 45,028 |
With related to resettlement, population of the district were grew to incomparable number that needed large farming land. As many places in developing countries, in the district, an increase in agricultural areas were accompanied with proportional decrease in forest, grass land, and shrub/bush land cover. As this study shows resettlement programs undertaken by EPDRF exert heavy pressure on destination areas, which in turn results in swift land use/land cover changes. This was why agricultural land increased from 1557.81 hectare in 1984 to 47117.88 hectare in 2015 within the district as land use/ land cover change result of this study shown.
Land certification
In the case of the study area as Guraferda district land administration office said; land certification was under processes of land demarcation and surveying in the time of this research work. As key informant one of the office worker said; although those resettlers were given 2.1 ha of land during they entered to the district, they had been expanded their farm land to nearby forest, shrub/bush land and grass land. During land survey by the district land administration office large amount of extra land were recorded from each farmer. On the other hand spontaneous resettlers were also used those land uses for agriculture. Likewise, as some of key informants said, after they knew the economic values of rice, native communities were also expand their land to shrub/bush land and grass land for income generation through rice production. Some of them were also converted forest land, shrub/ bush land, and grass land to farm land by saying “this land is my family historical land”. After conversion they hire out these lands to resettlers. Thus, as seen from the result, security of land tenure over land occupied by a household significantly increased the temptation of expanding unplanned farms towards the neighboring natural forests, shrub/bush lands, and grass land.
Poor governances within the district
The other problem related to land resources at Guraferda district was associated with the district politicians. According to key informants, those district political leaders used their power illegally in relation to land. They give land for spontaneous resettlers if he/she gave bribes. They confiscate land from a resettler as they want by saying “it is not yours” and gave for the other who gave bribe for them.
Subsistence agricultural land expansion
During this research work, Communities at Guraferda district had varied economic activities. Those resettlers (organized / spontaneous resettlers) who came from northern parts of the country were practicing oxen driven ploughing for producing annual crops due to they are depending on crop production for their household food consumption. All (100%) of northern resettlers use annual crops for household consumptions whereas majority (59.1%) of southern resettlers use vegetables particularly Enset and root crops like cassava, potato, and taro for household consumption. The livelihood strategies of native communities were annual crop (49.1%), NTFPs other than beekeeping (3.8%), vegetables and fruits (24.5%), and beekeeping (22.6%), respectively. Before resettlement, 67.9% of native communities had used Manihot esculenta/cassava species (‘Chaka kach’, in Me’enit word, which found within forest) and lekut (Me’enit word which is a forest tuber) as a main NTFPs food while taro and maize were covered 18.9% and 13.2% of their household consumption correspondingly. As a result, the livelihood activity differences had its own impact on land use/land cover of the district. To fulfil their food consumption requirement, those crop dependent communities plough large amount of land due to Crop production needs more land. To do this, the land given by the government (2.1 ha) did not enough. As a result, those communities push towards other land uses like grass land, shrub/bush land, and natural forest.
Government policies
Following the 1984 countrywide famine and drought, the government launched a resettlement program through which the demography of the study area was changed significantly. Some of the district experts as a key informant pointed out that, during EPDRF following the separation of Guraferda district from Sheko district and call for resettlement and agricultural investment by the district authorities, resettlers and agricultural investors streamed to the district particularly from 2003/4 to 2006/7. These key informants restated that natural vegetation cutting was escalated to construct houses for new settlers. The clearance of vegetation was indiscriminate and wider in scale which consequently lowers the vegetation cover of the area. It is evident from the above evidences that government resettlement policy had brought about population and land use/land cover changes in the area, particularly since the mid-1980s (Figure 4).

Figure 4: Charts that show drivers of LULCC at Guraferda.
This study found the dynamic change in LULC with a significant increase of agricultural land and plantation coffee from 0.6% in 1984 to 18.35% and from inexistence to 10.41% in 2015 of the district total area correspondingly. Contrary to agricultural land/settlement and plantation coffee, natural forests decreased from the beginning to the end at the rate of 776.8 ha/year during the study period. Grassland and shrub/bush land shows a fluctuation trend. In the first phase (1984 to 2001), these land uses increased, but decreased in the second phase (2001 to 2015). As a whole period shrub/bush land and grassland show a decreasing trend at the rate of 1302.3ha/yr and 251.3ha/year respectively. These LULCC occurred as a result of resettlement, agricultural investment, subsistence agricultural land expansion, forest fire, fuel wood requirement, house construction and farm implementing material requirement, poor governance within the district, and land certification problem.
This thesis owes its existence to the help, support and inspiration of many people. In the first place, I am profoundly indebted to Dr. Yemiru Tesfaye and Dr. Motuma Tolera for their unreserved advice, guidance and valuable suggestions. I do not have adequate words to express my feelings of gratitude to my beloved father and mother Haile Gessese and Lemilem Getahun who were with me always whatever the circumstances are. Thanks are due to them for their endless encouragement, moral and financial supports. My elder brother Fikade Haile is highly acknowledged that provided me a moral and financial supports. Last but not the list I would like to thank all those who put a drop of contribution in any ways in my study.