Keywords
|
| Electrocardiogram, Cardiac arrhythmia, Filters , Wavelet transform, Matlab. |
INTRODUCTION
|
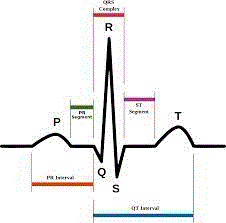
| Electrocardiography measures the electrical activity of the heart. The heart is a muscular organ about the size of a closed fist that functions as the body’s circulatory pump. The task of supplying oxygen is done by cardiovascular systems. Blood is the body’s medium for transporting oxygen to the organs[2].The activation of the heart starts at the sino-atrial node that produces the heart frequency, at about 70 cycles per minute. This activation propagates to the right and left atria muscle tissues. The SA node is located in the wall of the right atrium inferior to the superior vena cava. The SA node is responsible for setting the pace of the heart as a whole and directly signals the atria to contract.[6] At the atrioventricular node, there is a delay to allow the ventricles to fill with blood from atrial contraction. The depolarization then propagates to the ventricles through the Bundle of His and spreads along the Purkinje fibers. This activates the ventricles to contract and pumps blood to the aorta and to the rest of the body. Finally, depolarization occurs and this cycle is repeated [5].As the above cycle occurs, the trans membrane potential, which is the voltage difference between the internal and external spaces of the cell membrane, changes at each stage. These voltage differences can be measured using surface electrodes. The different peaks P, Q, R, S, and T are observed in Fig.1 If ECG is properly analyzed, can provide us information regarding various diseases related to heart. Moreover, visual analysis cannot be relied upon. This calls for computer-based techniques for ECG analysis. The importance of the Electrocardiography is remarkable since heart diseases constitute one of the major causes of death in the world. ECG varies from person to person due to the difference in position, size, anatomy of the heart, age, relatively body weight, chest configuration and various other factors. There is strong evidence that heart’s electrical activity embeds highly distinctive characteristics, suitable for various applications and diagnosis.[1] ECG analysis algorithms have always been very difficult tasks in the realization of Computer aided ECG diagnosis. Implementation of such algorithms becomes even harder for small and mobile embedded systems that should meet the given latency requirements while minimizing overall energy dissipation for the system.[3] The electrocardiogram ECG is a physiological signal that represents the mechanical heart contraction and relaxation as shown in Fig 1 If p is upward and QRS is upward and T is Downward RR0 is Normal RR1 is Normal then type is Normal ECG Signal. |
| • P wave: is the contraction of the atria. |
| • QRS complex: equivalent to a contraction the ventricles. |
| • T wave: is the relaxation of ventricles [4] |
| The above Fig shows the standard ECG waveform along with intervals the normal value of the parameters are shown in table 1[8] |
ECG Arrhythmia
|
| Cardiac arrhythmias are any abnormality or perturbation in the normal activation sequence of the myocardium. The sinus node, displaying properties of automaticity, spontaneously depolarizes, sending a depolarization wave over the atrium, depolarizing the atrioventricular (AV) node, propagating over the His-Purkinje system, and depolarizing the ventricle in systematic fashion. The signs and symptoms of cardiac arrhythmias can range from none at all to loss of consciousness or sudden cardiac death. In general, more-severe symptoms are more likely to occur in the presence of structural heart disease. Depending upon R-R interval there are two types of arrhythmia and they are broadly classified below |
Bradycardia
|
| The heart rate is less than 60 beats/min[5]. Bradycardia occurs in trained athletes and in patients with increased intracranial pressure, myxoedema and jaundice[4] |
Tachycardia
|
| The heart rate is greater than 100 beats/min[5]. Tachycardia occurs due to the presence of an ectopic focus in the atrium which beats regularly at a rapid rate.[4] |
LITERATURE SURVEY
|
| During past few years, various contributions have been made in literature regarding noise removal, ecg feature extraction and classification of ECG signal. Most of them use either time or frequency domain representation of the ECG waveforms.This section of the paper discusses various techniques and transformations proposed earlier in literature for extracting feature from ECG. |
| V.vijaya and K.K.rao together [2] developed an algorithm for ECG feature extraction based on multiresolution wavelet transform. The algrorithm which was implemented for feature extraction is based on pan- Tompkins algorithm. One cardiac cycle in an ECG signal consists of the P-QRS-T waves. This feature extraction scheme |
| determines the amplitudes and intervals in the ECG signal for subsequent analysis. The ECG signal was denoised by removing the corresponding wavelet coefficients at higher scales. Then, QRS complexes are detected and each complex. |
| M.b.messsaoud [8] developed an algorithm for efficient p wave detection based on morphology characteristics of arrhythmia using correlationand regression in ecg signal. The correlation coefficient can indicate the kind of arrhythmia diseases the algorithm was tested using MIT-BIH arrhythmia database where every p wave was classified . the results are presented in terms of correlation coefficient. |
| J.pan and W.J.tompkins [7] developed an real time algorithm for detection of the qrs complexes of ecg signals. The qrs complexes are based upon digital analyses of slope, amplitude, and width. A special digital bandpass filter reduces false detection caused by the various types of interference present in ecg signals |
| N. Safdarian, K. Maghooli and Nader J. Dabanloo[9] together work on Classification of Cardiac Arrhythmias with TSK Fuzzy System using Genetic Algorithm. Their study was based on the Takagi- Sugeno-Kang (TSK) fuzzy system for ECG arrhythmia detection and classification of normal sinus rhythm (NSR), ventricular fibrillation (VF) and ventricular tachycardia (VT) has been used. |
PROPOSED METHODOLOGY
|
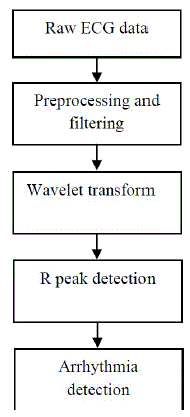
| To attain the objectives of this research work, we first refer a raw ECG from physionet.org in mat. Form which consist a data of 2 rows and 3600 columns. First of all ,a pre-processing is required in this scenario to make the signal filter ,and first we use Firl filter (least square linear phase fir filter) which would firstly initiate the hard values of the filter coded data to clip them further on Butter worth filter is applied for pre-processing and filtering. A wavelet pattern Discrete wavelet transform is applied to define the R-peaks of the data.In this research work haar wavelet transformation have been used. To define and to determine the R- peaks, we were required to define a rule base that which peak would be considered as R-peak . Hence an amplitude difference of 0.5 have been taken the peaks above 0.5 amplitude selection is a threshold value[7] and considered as R-peak. The block diagram of above methodology is shown in Fig 2 |
Raw ECG
|
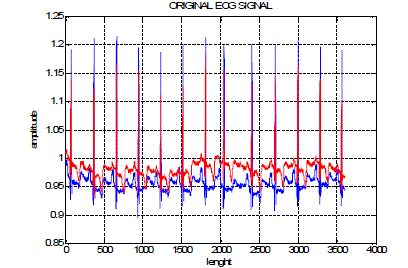
| The Raw ECG of mit- bih arrhythmia database is taken from physionet.org and uploaded in matlab .The uploaded data consist of two overlapped ECG .This overlapped ECG is splitted into a single, where the y axis represents amplitude and x axis represents samples |
Prepocessing
|
| Ecg mainly consist of different types of noise namely frequency interference, baseline drift, electrode contact noise, muscle noise internal amplifier noise and artifacts. Artifacts are the noise induced to ECG signals that result from movement of electrods. We use the Firl filter and Butterworth filter having a frequency range from 300-500 Hz..The first step the original signal is filtered at 300 Hz and the resultant signal is filtered at 500 Hz .So that we get a noise free signal |
Wavelet transform
|
| The wavelet transform provides good time resolution at high frequency. Wavelet Transform provides efficient localization in both time and frequency domain. The discrete wavelet transform is applied on complete ECG signal in order to extract approximation coefficient and detailed coefficient. |
R Peak Detection
|
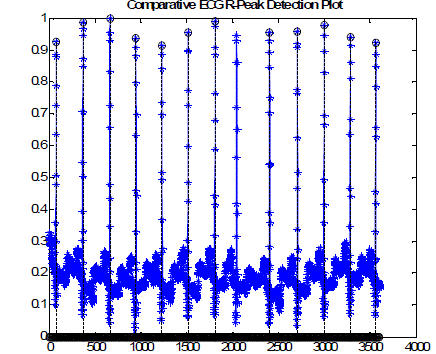
| The detection of R peak is the first step of feature extraction. The R-peak has a largest amplitude corresponds to other peaks . Hence an amplitude of .5 have been taken as a threshold to detect R peak and finally we detect the R peak location and the difference between two R peak is the R-R interval with reference to x axis. |
Arrhythmia detection
|
| Once all R peaks are detected then we can easily identified Bradycardia and Tachycardia on the basis of R-R interval. |
RESULTS AND DISCUSSION
|
| • The overlapped Ecg for record 100.mat is taken from physionet .org and this data consist of 2 rows and 3600 columns as shown in Fig 3 and this data represents complete length of the signal. |
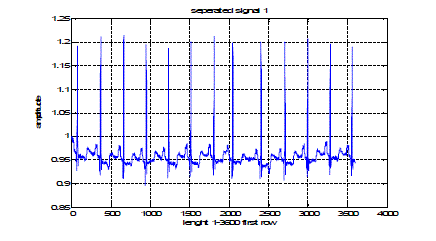
| • From the above fig it is clear that the blue and red colored lines represents overlapped ecg which is spiltted to get single row which consist the data of 3600 columns that represents the length of the signal as shown in Fig 4 |
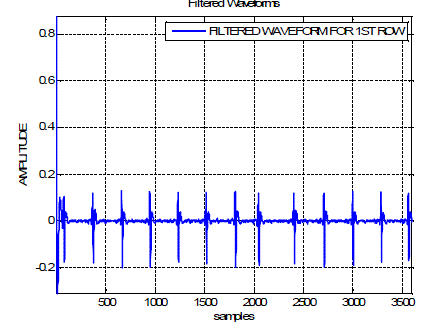
| • The ecg manly consist of different type of noise such as electrod noise, artifacts etc.these noise are removed by using firl and butterworth filter to get noise free signal as shown in Fig 5 |
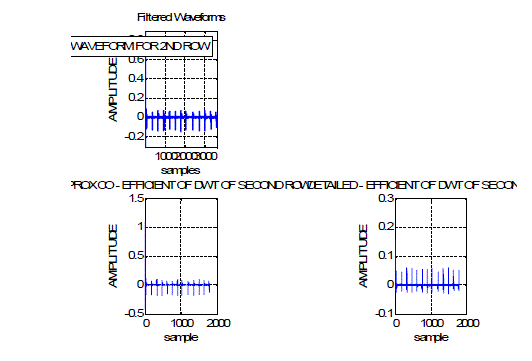
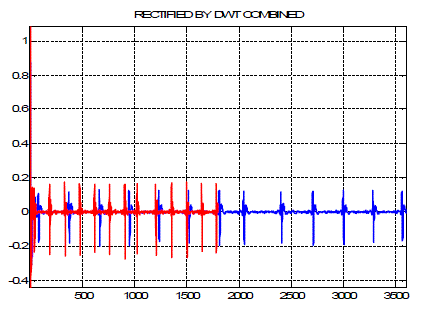
| • The approximation and detailed coefficient are also sub plotted using discrete wave transform to provide good time resolution at high frequency as shown in Fig 6. Finally the complete signal is rectified using discrete wavelet transform as shown in Fig 7 |
| • The amplitude of 0.5 is taken as a threshold to determine the effective R-Peak location and shown in Fig 8 |
CONCLUSION
|
| In this paper an algorithm for R- peak is implemented using filter and discrete wavelet transform (Haar transform). The information about R-peak obtained is very useful for classification, analysis and arrhythmia detection such as Tachycardia and Bradycardia. From this technique Tachycardia and Bradycardia can be easily identified from R-peak location and this technique gives the best possible locations for R- peak. The approximation and detailed coefficient are also plotted using discrete wavelet transform(Haar transform).From the R-peak location R-R interval can be easily estimated that will provide best possible heart beats for humans. The main advantage of this kind of detection is less time consuming for long time ECG signal. |
Tables at a glance
|
 |
| Table 1 |
|
| |
Figures at a glance
|
 |
 |
 |
 |
| Figure 1 |
Figure 2 |
Figure 3 |
Figure 4 |
 |
 |
 |
 |
| Figure 5 |
Figure 6 |
Figure 7 |
Figure 8 |
|
| |
References
|
- Sasikala P. and Wahidabanu R.S.D, “Robust R Peak and QRS detection in Electrocardiogram using Wavelet Transform”, (IJACSA)International Journal of Advanced Computer Science and Applications, Vol. 1,NO.6, pp.48-53,2010
- Vijaya V., Rao K.K. and Rama V., “Arrhythmia Detection through ECG Feature Extraction using Wavelet Analysis”, European Journal ofScientific Research Vol.66 No.3 , pp. 441-448 ,2011
- Jafari R., Noshadi H., .Ghiasi S., and Sarrafzadeh M., “Adaptive Electrocardiogram Feature Extraction on Distributed Embedded Systems”,IEEE Transactions on Parallel and Distributed Systems, Vol. 17, NO. 8, pp.797-807,2006
- N.Srinivas N., Babu A.V. and Rajak M.D., “ Condition Monitoring and Analysis for ECG Signal Using Fuzzy Advance Neural Networks(FANN) and Hypertext Preprocessor(PHP)”, International Journal of Emerging Technology and Advanced Engineering, Volume 3, Issue 4,pp.474-481,2013
- Patel P.G., Warrier J.S. and Bagal U.R., “ECG analysis and detection of arrhythmia using matlab,International Journal of Innovative Researchand Development, Vol 1 Issue 11, pp-59-68,2012
- Izzah T.A., Alhady S.A., Ngah U.K. and Ibrahim W.P., “A journal of real peak recognition of electrocardiogram (ecg) signals using neuralnetwork”, American Journal of Networks and Communications,pp.9-16,2013
- Pan J. and Tompkins W.J., “A real-time QRS detection algorithm”, IEEE Trans. Biomed. Eng., vol. 32, pp. 230–236, 1985
- Messaoud M.B.,Kheli B. and Kachouri A., “Analysis and Parameter Extraction of P Wave Using Correlation Method” The International ArabJournal of Information Technology, Vol. 6, No. 1,pp.40-46,2009
- Safdarian N., Maghooli K. and Dabanloo N.J., “ Classification of Cardiac Arrhythmias with TSK Fuzzy System using Genetic Algorithm”,International Journal of Signal Processing, Image Processing and Pattern Recognition Vol. 5, No. 2, PP.89-100,2012
|