Research & Reviews: Journal of Pharmaceutics and Nanotechnology
e-ISSN: 2347-7857 p-ISSN: 2347-7849
e-ISSN: 2347-7857 p-ISSN: 2347-7849
Kanaka Durga Vikash Guntiboyina1*, Sanjay P Umachigi1, Prasanth VV1, Abhishek Sharma1, Rinku Mathappan2, and Sam T Mathew3
1Department of Pharmaceutics, Gautham College of Pharmacy, Bangalore, 560 032, India
2Department of Pharmacognosy, Gautham College of Pharmacy, Bangalore, 560 032, India
3Regulatory affairs and Medical writing, Biocon Pvt Ltd, Bangalore 560 100, India
Received date: 03 January 2014 Accepted date: 04 March 2014
Visit for more related articles at Research & Reviews: Journal of Pharmaceutics and Nanotechnology
Six formulations of Propranolol Hydrochloride loaded microspheres were prepared by non-aqueous emulsification-solvent evaporation technique.The percentageyield of the microspheres varied from 75.33 ± 0.006 and 92.21 ± 0.003. The entrapment efficiency of Propranolol Hydrochloride microspheres were ranged between 79.7 ± 0.02 and 85.87 ± 0.03 %. It was reported that the encapsulation efficiency depends on the solubility of the drug in the solvent.The mean particle size of the prepared formulation ranged from 256.56 ± 0.07 and 382.77 ± 0.05μm. The drug content of the prepared formulation ranged between 76.19 ± 2.5 and 87.74 ± 3.1%. The swelling indices of the microspheres were high (up to 0.89 ± 0.02 for F4) and varied between the formulations.The maximum in vitro release was evaluated to be 96.55 % over a period of 14 h for formulation F4. The in vitro drug release increased in the following order: F1< F6< F3< F5< F2< F4.Formulations F6 provided good fit to the Higuchi model and the remaining formulations showed the best fit to the Korsmeyer-Peppas model.Scanning electron micrographs of selected formulation indicated that the microspheres were discrete, uniform and spherical with a smooth surface. During at the end of accelerated stability studies the tested formulation (F4) showed non-significantly different drug content, entrapment efficiency and in vitro drug release from that observed at the beginning of the study. No color changes were also observed during the study period.
Accelerated stability studies,Higuchi,Korsmeyer-Peppas, Propranolol Hydrochloride,Particle size,Scanning electron microscopy
Oral drug delivery is the most attractive and favored manner of drug delivery for achieving mutually systemic and local therapeutic effects. But a variety of problems are also related with the conventional oral dosage forms, that it is frequently essential to take several times per day to retain the concentration of administered drug within the therapeutically effective range which results in a fluctuated drug level and consequently undesirable toxicity and poor efficiency. So to overcome such problems associated with conventional oral dosage form, the idea of controlled drug delivery systems was introduced [1]. The real challenge in the development of a controlled drug delivery system is not just to control the drug release, also to extend the existence of the dosage form in the absorption site until all the drug is completely released in the preferred period of time [2-4]. Continuous release of the drug involves polymers that release the drug at a controlled manner due to the degradation of polymer over time and it can be achieved by using drug carrying polymer.
Propranolol Hydrochloride is a beta-adrenergic blocking drug, which is widely used in the treatment of cardiovascular diseases, particularly in the treatment of weak and moderate hypertension, angina pectoris, ventricular arrhythmia, hypertrophic subaortic stenosis, etc [5]. It was the first successful beta blocker developed [ 6]. Propranolol Hydrochloride is highly lipophilic and is almost completely absorbed after oral administration. Its oral bioavailability of Propranolol Hydrochloride is approximately 26% and half life is almost 3-4hour [7]. Moreover, the site of absorption of Propranolol Hydrochloride stomach and dosage forms that are retained in the stomach would increase the absorption, improve drug efficiency, and decrease dose requirements [8]
The aim of the present work was to formulate an alternative controlled release formulation of Propranolol Hydrochloride to retain the dosage form in the absorption site more than the half life of the drug, to improve the bioavailability, reduce dose frequency, toxicity and patient compliance.
Preparation of Propanol Hydrochloride Microspheres
The compositions of different Propanol Hydrochloride microspheres are shown in Table 1.Microparticles containing Propranolol Hydrochlorideas the core material was prepared by a solvent evaporation method using water and ethanol as solvent[9]. The drug, solvent and polymers were mixed at (1:2) ratios. The polymer solution was slowly introduced into 40 mL of liquid paraffin while being stirred at 700 rpm using a mechanical stirrer equipped with a three bladed propeller at room temperature. The solution was stirred for 2 hr to allow the solvent to evaporate completely and the microcapsules were collected by filtration. The microcapsules were washed repeatedly with petroleum ether (40-60oC) until free from oil. The collected microcapsules were dried for 1 hr at room temperature and subsequently stored in a desicator over fused CaCl2 until further study.

Table 1. Compositions of Different Propanol Hydrochloride Microspheres
Evaluations
Micromeritic Properties
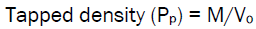
Microspheres were characterized for micromeritic properties such as bulk density, tapped density, compressibility index, Hausner's ratio, and angle of repose [10-11]. The tapping method was used to determine the tapped density in which the cylinder containing known amount (M) of microspheres was subjected to a fixed number of taps (approximately 100) until the bed of microspheres had reached the minimum. The final volume after tapping 'V o ' was recorded and the tap density was calculated by the following equation:
Angle of repose, Hausner ratio, and Carr index (% compressibility index) were determined to predict flowability. A higher Hausner ratio indicates greater cohesion between particles, while high Carr index is indicative of the tendency to form bridges. Angle of reposeof the microspheres, is the maximum angle possible between the surface of the pile of microspheres and the horizontal plane, was obtained by fixed funnel method using the formula;

Where, h is height and d is the diameter of the microsphere pile that is on a paper after making the microspheres flow from the glass funnel. Hausner ratio and Carr index were calculated using the formulae:
Carr index or % compressibility index or C = [1 – (Vo/V] x 100
Here, V and V o are the volumes of the sample before and after the standard tapping, respectively and C is Carr index.
Determination of Encapsulation Efficiency (EE) and Percentage Yield of Microspheres
To determine the amount of Propanol Hydrochloride encapsulated in microspheres, a known weight of microspheres was weighed into screw-capped vials with phosphate buffer (pH 6.8) and digested by sonicating the sample for 10 minutes and subsequently keeping the sample aside for 10 minutes. This procedure was repeated thrice (i.e. 30 min sonication) in order to extract the entrapped drug completely. The absorbance was noted at 219 nm using a double-beam spectrophotometer (UV 1800 Shimadzu, Kyoto, Japan) after diluting suitably with distilled water. Blank microspheres treated in a similar manner were used as the blank [12]. The percentage of encapsulation efficiency was calculated by the following formula.
%EE = (ED/AD) x 100
Where, %EE is the percentage encapsulation efficiency; ED is the amount of encapsulated drug; and AD is the amount of added drug. The percentage yield of microspheres was calculated using the following formula.
Percentage Yield = (Practical Yield/ Theoretical Yield) x 100
Particle Size
The particle size of the albumin microspheres was analyzed by laser particle size analyzer (Malvern Instruments, Mastersizer 2000, Malvern, UK) using n-Hexane as dispersant. The sample was vortexed for 1 minute before sampling. The samples were then sonicated in a sonicator attached to the instrument throughout the process, and the duration of sonication was kept constant for all samples. The obscuration value was observed as 14.87%. Volume of distribution was plotted using a computer program supplied by the manufacturer. Polydispersity was calculated by the following equation[ 13]:
Polydispersity= [D (0:9) −D (0:1)] / D (0:5)
Where D (0.9), D (0.5), and D (0.1) are the particle diameters determined respectively at the 90th, 50th, and 10th percentile of undersized particles.
Swelling Index
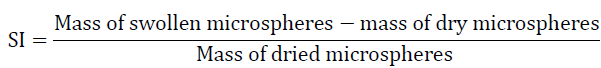
The swelling of microspheres were carried out in phosphate buffer (pH 6.8) for 14 hrs. The excess liquid drops adhered to surface were removed by blotting and the swollen microspheres were weighed. The microspheres were then dried in hot air oven at 400C for 60 hrs until there was no change in dried mass of sample. The swelling index was calculated from the following equation [14].
Drug Content
Crushed microparticles 40 (mg) were vortex–mixed for 2 hours with phosphate buffer (pH 6.8). The extract was transferred to a 25 mL volumetric flask and the volume made up using water. The concentration was measured by UV spectrophotometer at 219 nm against appropriate blank. The amount of drug entrapped in the microparticles was calculated [15].
In-vitro Drug Release Study
In-vitro release studies were carried out for the formulations in dissolution test apparatus USP type II[16]. Microparticles equivalent to 100 mg of the pure drug were used. 900 mL of phosphate buffer (pH 6.8) was used as the dissolution medium and then same volume of phosphate buffer (pH 6.8) was replaced in the dissolution apparatus for 14 h, at 50 rpm at 37 ± 0.5oC. One ml of the aliquot was withdrawn at different predetermined time intervals (1.0, 2.0, 3.0, 4.0, 5.0, 6.0, 8.0, 10.0, 12.0 and 14.0 h), and replaced with an equal volume of fresh dissolution medium to maintain constant volume. The samples were filtered through 0.45 μm filter and appropriately diluted with phosphate buffer (pH 6.8) and assayed spectrophotometrically at 219 nm. The mechanism of drug release from the microspheres was determined by finding the best fit of the release data to Higuchi and Korsmeyer-Peppas plots. The release rate constants k and n of each model were calculated by linear regression analysis using Microsoft Excel 2003 software. Coefficients of determination (R2) were used to evaluate the accuracy of the fit [17-18].
Scanning Electron Microscopy (SEM)
The surface morphology of pure drug was examined by (JOEL JSM T330A) scanning electron microscope. The sample was examined and photographed under various magnifications with direct data capture of the images onto a computer.
Accelerated Stability Studies
Accelerated stability study was carried out for six months for the selected formulations. The optimized formulations were packed in polyvinyl dichloride blister packing and loaded into stability chamber and were maintained at 40 ± 2 oC/75 ± 5% temperature and relative humidity respectively. The samples were withdrawn at Accelerated stability study was carried out for six months for the selected formulations. The optimized formulations were packed in polyvinyl dichloride blister packing and loaded into stability chamber and were maintained at 40 ± 2 oC/75 ± 5% temperature and relative humidity respectively. The samples were withdrawn at
Formulation Studies
In the present study, a total of 6 formulations of Propranolol Hydrochloride loaded microspheres were prepared by non-aqueous emulsification-solvent evaporation technique using different polymers like gelatin, ethyl cellulose, chitosan and HPMC.
Micromeritic properties
Flow properties of selected microspheres were evaluated by measuring the angle of repose, Hausner‟s ratio, bulk density, tapped density and compressibility index is shown in Table 2. The Angle of repose ranged between 21 °. 10' ± 1.1 and 22 °. 27' ± 1.4, bulk density varied between 0.322 ± 1.2 and 0.398 ± 0.6 g/mL and tapped density lies between 0.418 ± 2.2 and 0.482± 1.7 g/mL. The compressed index was found between 6.87 ± 1.3and 8.78 ± 1.2 and Hausner ratio lies between 1.032± 1.8 and 1.089± 3.1. All tested microspheres showed excellent flowability with angle of reposes being less than 23º. The compressibility of the tested microspheres was less than 7%. It was reported that when compressibility is below 9% and the angle of repose is within 250 the powder show good flowability and do not require any glidants to improve the bioavailability. It was reported that powders with a Hausner‟s ratio lesser than 1.25 is considered to be possessing good flowability.

Table 2. Micromeritic properties of Propranolol Hydrochloride Microspheres
Determination of Encapsulation Efficiency (EE) and Percentage Yield of Microspheres
The percentage yield and encapsulation efficiency of Propranolol Hydrochloride microspheres are shown in Table 3.The percentageyield of the microspheres varied from 75.33 ± 0.006 and 92.21 ± 0.003. The effect of different factorson the percentage yield of microspheres was not clear, possibly due to an improper recovery of microspheresfrom the filter paper.Entrapment efficiency is an important parameter for microspheres and it gives a measure of the robustness of the formulation technique. Drug may get entrapped into the core of the spherical matrix, polymer matrix or may be loosely bound to the surface. The entrapment efficiency of Propranolol Hydrochloride microspheres were ranged between 79.7 ± 0.02 and 85.87 ± 0.03 %. It was reported that the encapsulation efficiency depends on the solubility of the drug in the solvent. In the current study, the drug was highly soluble in the solvent (water) and slightly soluble in the continuous phase (light liquid paraffin). The solubility of Propranolol Hydrochloride in light liquid paraffin could be one of the reasons for lesser entrapment efficiency. This inference could not be confirmed since the drug present in the paraffin washings was not quantified. However, relation between other processing parameters and entrapment efficiency was unclear

Table 3.The percentage Yield and Encapsulation Efficiency of Propranolol Hydrochloride Microspheres
Particle Size and Drug Content
The data for particle size and drug content is shown in Table 4. The microspheres could not reveal a unimodal size distribution cure. The mean particle size of the prepared formulation ranged from 256.56 ± 0.07 and 382.77 ± 0.05μm. The drug content of the prepared formulation ranged between 76.19 ± 2.5 and 87.74 ± 3.1%.

Table 4. The Mean Particle Size and Drug Content of Propranolol Hydrochloride Microspheres
Swelling Index
The swelling index of the prepared formulations is showed in Figure 1. The swelling indices of the microspheres were high (up to 0.89 ± 0.02 for F4) and varied between the formulations. Higher swelling indices may be due to the presence of water soluble polymers. The swelling behavior provides an indication of the relative moisture absorption capacities of polymers and whether the formulations maintain their integrity after absorption of moisture. Differences in swelling of the tested hydrophilic polymers could be explained by the difference in resistance of the matrix network structure (hydrogen bond) to the movement of water molecules. The swelling indices increased in the following order: F3<F5<F6<F1<F2<F4.

Figure 1: Swelling Index of Propranolol Hydrochloride Microspheres
In-vitro Drug Release Study
The in vitro drug release of Propranolol Hydrochloride microspheres is shown in Figure 2.The release of drug from the formulation depends on the type and concentration of polymer used and the pH of the dissolution medium. The release of Propranolol Hydrochloride from different formulations was carried out in phosphate buffer (pH 6.8).The maximum in vitro release was evaluated to be 96.55 % over a period of 14 h for formulation F4. The in vitro drug release increased in the following order: F1< F6< F3< F5< F2< F4.The drug release mechanism from controlled release devices is very complex, and not yet completely understood. Although some processes may be classified as either purely diffusion or purely erosion controlled, many others can only be interpreted as being governed by both. The R2, „k’ and „n’ values are given in Table 5.From the drug release profile we have selected formulation F4 as the best formulation and used for further studies such as scanning electron microscopy and accelerated stability studies.

Figure 2. In Vitro Drug Release of Propranolol Hydrochloride Microspheres
Formulations F6 provided good fit to the Higuchi model. According to this model, the drug release from these patches may be controlled by diffusion through the micropores. The remaining formulations showed the best fit to the Korsmeyer-Peppas model showed super case II transport drug release. This mechanism could result from increased plasticization at the relaxing boundary.
Scanning Electron Microscopy
Scanning electron micrographs of selected formulation is shown in Figure 3. The result indicated that the microspheres were discrete, uniform and spherical with a smooth surface. The particles appear to be in the form of aggregates. The aggregate formation may be due to insufficient washings.

Figure 3. Scanning Electron Micrographs of Selected Propranolol Hydrochloride Microspheres (F4)
Accelerated Stability Studies
The accelerated stability study of selected formulation is shown in Table 6. During the evaluation, the tested formulation (F4) showed non-significantly different drug content, entrapment efficiency and in vitro drug release from that observed at the beginning of the study. No color changes were also observed during the study period.

Table 5: R2, „k’ and „n’ values of Propranolol Hydrochloride Microspheres

Table 6: The accelerated stability study of selected Propranolol Hydrochloride Microspheres (F4)
The microspheres of Propranolol Hydrochloride were prepared by solvent casting method to ensure satisfactory drug release, enhance improved bioavailability, reduce dose and frequency of administration and also to release the drug from the formulation in a controlled manner. From this study, it is concluded that, the microspheres of Propranolol Hydrochloridecan be formulated using chitosan, HPMC, gelatin and ethyl cellulose. The in vitro studies have shown that this is a potential drug delivery system for Propranolol Hydrochloride with a considerably good stability and release profile. Future studies are warranted to confirm these results in vivo.