Keywords
|
| fibrosis; respiratory system; electrical mode; time/frequency-domain responses; state-space technique; stability analysis; compliance. |
INTRODUCTION
|
| The potential causes of lung fibrosis maybe due to inhalation of asbestos, ground stone or metal dust; however if the cause is unknown then the condition is called idiopathic lung fibrosis. For the past two decades it has been observed that probability of death from pulmonary fibrosis is increasing rapidly with age [1-3]. According to, American Thoracic Society and the European Respiratory Society, the most common cause of death is progressive lung disease (60% of deaths) and among which idiopathic lung fibrosis is very common [4-5]. |
| Researchers have proposed various models to study the breathing performance relating lung compliance and air tract resistance. Graham Sturton et al. showed that changes in the physiological structure of the minute airways (<2 mm diameter) were mostly responsible for Chronic Obstructive Pulmonary Diseases (COPD) [6]. In 2006, B. Diong et al. described an electric circuit based model of the respiratory system that helps the detection and diagnosis of various obstruction related diseases of human respiratory system [7]. P. Segers and R. De Keyser proposed a technique to provide the mechanical parameters of the respiratory airways (resistance, inertance, and compliance) from morphological insight to enable the correlations of fractional-order models with pathologic changes. The investigators formulated a set of equations taking into account the various anatomical aspects , such as, inner radius, wall thickness, tube length, and tissue structure of each airway level to effectively model the pressure drop, wall elasticity, flow, and air velocity (both axial and radial). They studied the effects of pulmonary diseases which affect the inner radius and elastic modulus of bronchial tree [8]. |
| A theoretical model of sound transmission from within the respiratory tract to the chest wall due to the motion of the walls of the large airways was proposed by K. N. Stevens et al.. The vocal tract, trachea, and first five bronchial generations were implemented over the frequency range from 100 to 600 Hz by an equivalent acoustic circuit. This circuit made it possible to estimate the magnitude of airway-wall motion in response to an acoustic perturbation at the month. The model estimates the magnitude of acceleration over the extra thoracic trachea and at three locations on the posterior chest in the same vertical plane. The predicted spectral characteristics of transmission corroborate with the previous experimental observations [9]. Clara Ionescu, Eric Derom, Robin De Keyser, in January 2010, for assessment of respiratory mechanical properties [6, 12]. A complex formula of an iterative, weighted nonlinear least squares method of parameter estimation of the human respiratory system was proposed to provide physiological data to the performance of the breathing system [10]. T. Sbrana et al. In the year 2011, proposed a model to simulate exhalation phase in human respiratory system which mimics the bronchial resistances of human's lung in during expiration in MATLAB environment. The inputs to this model were the spirometric values [11]. The fractional-order modelling was introduced in clinical studies of ventilator diseases where the structural changes in lung components were correlated for diagnosis of lung where the inertia of airflow, compliance of trachea and resistance offered by the respiratory tract were compared with an inductor, a capacitor, and a resistor respectively. |
| In this paper, the human ventilatory system has been represented through an electrical model which has been simulated for assessment of the severity of fibrosis in the lungs. So as to assess the ventilatory performance, lung compliance (C) and airway resistance (R) are two vital lung parameters. Here, we have also considered inertia of the air flow, whose electrical analogy is inductance (L). For this purpose, the lung ventilator model is developed in the form transfer function comprising of R, L and C. This driving pressure which allows the air flow in and out of the lungs is considered the differential pressure between the atmospheric pressure and alveolar pressure. For analysing fibrosis in lungs, we have simulated the electrical model for three different lung conditions as i) normal ii) affected and iii) highly affected by varying the compliance of lungs. |
| The paper is divided four sections beginning with electrical modelling of respiratory system. The following section introduces the respiratory problems associated with fibrosis. The third one deals with validation of our proposed model of the breathing system by application of state space analysis technique. In results and discussions section, we have enriched our study by using Bode plots where a correlation between phase margin and alveolar compliance has been shown. The conclusion of this work is discussed briefly in the fourth section. |
ELECTRICAL MODELlING OF RESPIRATORY SYSTEM
|
| Fig. 1 showcases the physiological structure of lungs and airways whose equivalent electrical circuit is represented in Fig. 2. In Fig. 2, the trachea (an airway with largest cross section area among the respiratory airways) is represented by electrical resistance Rt , air-flow inertia is indicated by Lt, Rb1 and Rb2 are meant for the main bronchi (both left and right with smaller cross sectional areas relative to trachea), whereas, air-flow inertia in the bronchi are characterized by Lb1 and Lb2 (electrical inductances). The assembly, comprising of bronchioles and cluster of alveoli (Fig. 1) is a series connection of a resistor Rv and an effective capacitor Cv in Fig.2. |
RESPIRATORY PROBLEMS ASSOCIATED WITH LUNG FIBROSIS
|
| Lung fibrosis, also referred to as pulmonary fibrosis, is a clinical condition that occurs when the alveoli, or air sacs, become inflamed and scarring develops on the lung tissue. Due to scarring of the air sacs, the lung tissue is gradually replaced by air fibrous tissue. Fibrous tissue is thicker and stiffer, so it prevents the sacs from inhaling oxygen. |
| The alveolar elasticity is described through its compliance whose electrical analog is capacitance (Fig. 2). |
MATHEMATICAL REPRESENTATION OF THE TRANSFER FUNCTION
|
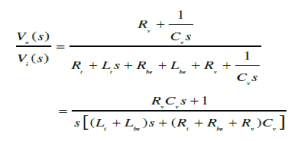 |
| where, Re and Le stand for the effective resistance and inductance of the bronchi (left and right) respectively, Vo and Vi indicate the alveolar and atmospheric pressures respectively. |
VALIDATION OF PROPOSED ELECTRICAL MODEL
|
| A. To study lung fibrosis through state space technique |
| We have observed the responses of the respiratory system for pulmonary fibrosis with three different stages. i) healthy i.e. normal ii) affected and iii) severely affected alveoli. For normal lung conditions, we have chosen that the air ways impedances are constant and the electrical compliance is averaged with Cv=0.01 Liter/cm of H2O. |
| Stage1: Stating the patient’s alveloi are in healthy condition (normal) |
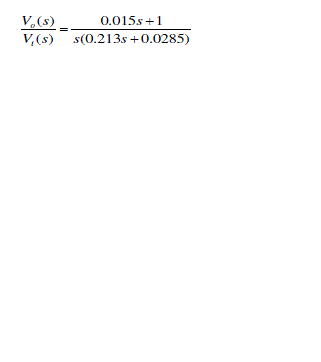
| We have studied the performance of the respiratory system using state space model by taking values of Rt=4.5 cm of H2O-sec./ liter, Re =9 cm. of H2O-sec./liter, Rv=15 cm. of H2O-sec./liter, Lt = 0.043 cm of H2O-sec.2/liter, Le =0.17 cm. of H2O-sec.2/liter, Cv=0.01 Liter transfer function is |
 |
| By using the concept of state space model, we have computed the following matrices (derived from Eq. 2). The respiratory system matrix is evaluated as |
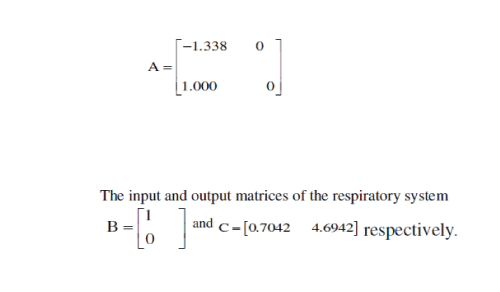 |
| Finally the Eigen values of the system are figured as 0 and -1.3380. |
| Stage2: Stating alveoli are in affected condition |
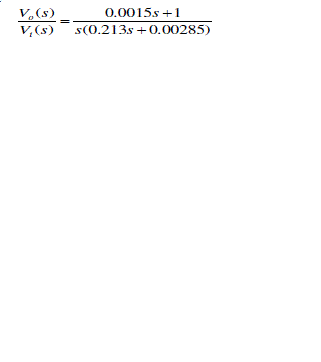
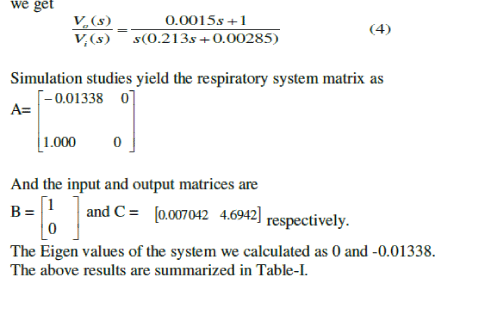
| In a similar technique, we have simulated the response of the affected alveolar condition using state space model. Here too, keeping the air tract impedances unchanged, we have changed the alveolar compliance to 0.001 Liter/cm of H2O. The transfer function is as |
 |
| The simulation results are observed in terms of state space matrices. Thus, the respiratory system matrix |
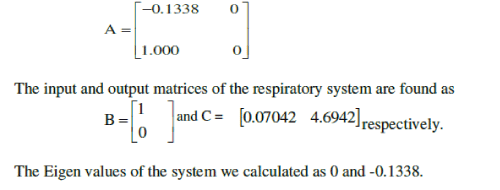 |
| The Eigen values of the system we calculated as 0 and -0.1338. |
| Stage3: Stating badly affected alveolar condition The alveolar compliance reduces due to long-term exposure to a number of toxins and pollutants. By following the similar computational approach and choosing the value of Cv = 0.0001 Liter/cm of H2O in the transfer function (Eq.1), we get |
 |
| The results show that Eigen values are indicative of the severity of the scarring of the lung tissue. As the Eigen values, which are the roots of the characteristic equation of the respiratory system, are approaching the origin of the complex splane, severity of the disease increases. |
RESULTS AND DISCUSSIONS
|
| We have further enriched our simulation process with Bode plots. Once again, we have classified the alveolar conditions as normal, affected and highly affected. Considering the airway-impedance same and alveolar compliance as Cv = 0.01 Liter/cm of H2O, the Bode plots are observed as shown in the Fig. 4. The phase margin, which is a frequency domain specification, is used to assess the relative stability of the ventilator was figured as 50.40. In second stage, we have chosen CV as 0.001 Liter/cm. of H2O, for a distressed alveolar state, the Bode magnitude and phase plots were obtained as shown in the Fig. 5 showing a phase margin of the breathing system as PM=5.40 . With Cv =0.0001 Liter/cm of H2O, in third stage, we have monitored the Bode plots as depicted in Fig. 6 for severely fibrosis affected patient. Phase margin was quantized as 0.540. |
| As the phase margin is decreasing the severity of the fibrosis or scaring in the lungs is more. The simulation results are summarized in Table-II. |
CONCLUSION
|
| In this work an electrical model consisting of passive components has been tested on three groups: healthy, affected and severely affected fibrosis patients. The main purpose of this work is to identify the differences in responses of a healthy individual and one with scarred lungs. The differences have been monitored and accumulated in tabular form. The influence of fibrous tissue on lungs have been assessed in terms of stability analysis |
Tables at a glance
|
 |
|
| Table 1 |
Table 2 |
|
Figures at a glance
|
 |
 |
 |
| Figure 1 |
Figure 2 |
Figure 3 |
 |
 |
 |
| Figure 4 |
Figure 5 |
Figure 6 |
|
References
|
- Mannino DM, Etzel RA, Parrish RG. Pulmonary fibrosis deaths in the United States, 1979–1991: an analysis of multiple-cause mortality data. Am J RespirCrit Care Med 1996;153:1548–1552,1996
- Olson AL, Swigris JJ, Lezotte DC, Norris JM, Wilson CG, Brown KK. Mortality from pulmonary fibrosis increased in the United States from 1992 to 2003. Am J RespirCrit Care Med 2007;176:277–284,2007
- Hiwatari N, Shimura S, Takishima T, Shirato K. Bronchoalveolar lavage as a possible cause of acute exacerbation in idiopathicpulmonary fibrosis patients. Tohoku J Exp Med 1994;174:379–386,1994
- King TE Jr, Behr J, Brown KK, du Bois RM, Lancaster L, de Andrade JA, Stahler G, Leconte I, Roux S, Raghu G. BUILD-1: a randomizedAmerican Thoracic Society Documents 819 placebo-controlled trial of bosentan in idiopathic pulmonary fibrosis. Am J RespirCrit Care Med2008;177:75–81,2008
- Wells AU, Desai SR, Rubens MB, Goh NSL, Cramer D, Nicholson AG, Colby TV, du Bois RM, Hansell DM. Idiopathic pulmonaryfibrosis: a composite physiologic index derived from disease extent observed by computed tomography. Am J RespirCrit Care Med2003;167:pp.962–969,2003
- Graham Sturton, Carl Persson and Peter J. Barnes; “Small airways: an important but neglected target in the treatment of obstructive airway diseases “Original Research Article,Trends in Pharmacological Sciences, Volume 29, Issue 7, Pages 340-345, July 2008,.
- Diong, B. ;Nazeran, H. ; Nava, P. ; Goldman, M. ,” Evaluation of Respiratory System Models Based on Parameter Estimates from Impulse Oscillometry Data” , Engineering in Medicine and Biology Society, 2005. IEEE-EMBS 2005. 27th Annual International Conference of the; Page(s):2958 – 2961,2005
- Wodicka, G.R.; Stevens, K.N.; Golub, H.L.; Shannon, D.C.,” Biomedical Engineering”, IEEE Transactions on Volume: 37, Issue: 12 Pages 78-85.
- Wodicka, G.R.; Stevens, K.N.; Golub, H.L.; Shannon, D.C., “Spectral characteristics of sound transmission in the human respiratory system”, IEEE Transactions on Biomedical Engineering, Volume: 37 , Issue: 12 ; Page(s): 1130 – 1135 Publication Year: 1990.
- P.J. Stoll, J.S. Meditch ; “Least squares estimation of respiratory system parameters”, Mathematical Biosciences, Volume 8, Issues 3–4, Pages 307-321 August 1970,
- TommasoSbrana, Alberto Landi, Giosuè Angelo Catapano; Innovative model to simulate exhalation phase in human respiratory system; Computer Methods and Programs in Biomedicine, Volume 104, Issue 2, November 2011, Pages 300-305
- C. Ionescu, I. Muntean, J. T. Machado, R. De Keyser, and M. Abrudean, “A theoretical study on modelling the respiratory tract with ladder networks by means of intrinsic fractal geometry,” IEEE Trans. Biomed. Eng., vol. 57, no. 2, pp. 246–253, Feb. 2010.
- Dhanjoo N. Ghista, “Lung Ventilatory Performance Pressure-Volume Model and Parameteric Simulation for Disease Detection,” 19th C. Ionescu, P. Segers, and R. De Keyser, “Mechanical properties of the respiratory system derived from morphologic insight,” IEEE Trans.Biomed. Eng., vol. 56, no.4, pp. 949–959, Apr. 2009.
- C. Ionescu, P. Segers, and R. De Keyser, “Mechanical properties of the respiratory system derived from morphologic insight,” IEEE Trans.Biomed. Eng., vol. 56, no. 4, pp. 949–959, Apr. 2009.
- Nucci G., Tessarin S. and Cobelli C., “A Morphometric Model of Lung Mechanics for Time-Domain Analysis of Alveolar Pressures during Mechanical Ventilation,” Annals of Biomedical Engineering, V. 30, p.537-545, 2002.
- Meste O., Khaddoumi B., Blain G. and Bermon S., “Time-Varying Analysis Methods and Models for the Respiratory and Cardiac System Coupling in Graded Exercise,” IEEE Transactions on BiomedicalEngineering, V. 52, N. 11, .p.1921-1930, 2005.
- Rong- Mao Lee , Hsin-Lin Chiu and Nan-Chyuan Tsai, “Mathematical Model of Interactive Respiration/ Cardiovascular Composite System”, Int. Conf. on trends in Mechanical and Industrial Engineering (ICTMIE’2011), Bangkok, pp. 135-139, 2011.
- http://en.wikipedia.org/wiki/Lung
- http://www.nhlbi.nih.gov/health/health-topics/topics/ipf/lungworks.htm
|